The Use of PLC Technology in Broadband Services Offered to Households

Author: Stanislav Klucik, Juraj Taraba, Milos Orgon, Daniel Adamko
Journal: International Journal of Information Technology and Computer Science(IJITCS) @ijitcs
Article in issue: 4 Vol. 4, 2012.
Free access
The volume and quality of broadband services in any country is being understood not only as a major parameter related to the economic growth of that country, but also as a major parameter how much that country is ready for economic growth in the near future. With this understanding the main reasons why expansion of broadband services in Slovakia is an urgent issue are briefly outlined in this paper.
IPTV, PLC, QoS, VLAN, VoIP
Short address: https://sciup.org/15011674
IDR: 15011674
Text of the scientific article The Use of PLC Technology in Broadband Services Offered to Households
Published Online April 2012 in MECS DOI: 10.5815/ijitcs.2012.04.01
PLC (Power Line Communication) is a technology that allows information transmission using electrical wires. Nowadays these devices enable quality management which is the main subject of this article. The home network implementation, quality management for multimedia streams and the ensuring of quality for home multimedia like VoIP and IPTV are more closely described and measured.
The tested PLC modems operate with proprietary developed technologies HomePlug by Powerline Alliance [1] in HomePlug AV (HPAV) version, in 2 – 30 MHz frequencies. This technology uses the frequency channels divided by OFDM (Orthogonal Frequency Division Multiple Access) technology with 917 channels. Every PLC modem measures the line status of all OFDM channels and based on the status automatically chooses the correct modulation (BPSK to 1024QAM [2]). All the PLC modems sharing the same media communicate with each other. For logical separation of networks, the network name is used. A 128 bit AES encryption is used to prevent interception of transferred data [3].
2. QoS management options
The basis of the quality management is to divide the transmission into two types: connection oriented transmission using TDMA (Time Division Multiple Access), non-connection oriented transmission using CSMA/CA (Collision Sense Multiple Access/Collision Avoidance). TDMA is used in operations demanding high QoS (Quality of Service), such as VoIP (Voice over Internet Protocol) or IPTV (Internet Protocol Television). It enables to reach low one-way delay and delay variation (jitter). The tested devices only communicate via TDMA technology. For TDMA technology synchronization of the alternating signal voltages (50 Hz) itself is used [3].
Based on the manufacturer’s recommendations, it is advised to mark the PLC devices nearest to the CPE user as Fixed AP (Access Point) [4]. This connection is important for Fixed AP functions [3], since the central CCo (Central Coordinator) which allocates the data transfer options to other EP (End Point) PLCs connected to the network, is their managing centre. Default priority sets the relative priority of the transmission of a specific PLC modem with predefined value 2. The higher the value, the higher the relative transfer priority the modem gets. However, it does not distinguish between the types of transmission (voice or data).
Another important option of the QoS management is its prioritization based on different parameters. The operation may be filtered based on the used protocols and their fields (Custom Criterion Configuration). Afterwards it is necessary to assign a class of service to the filtered operations and the class priority. The higher value, the higher priority the filtered operation gets. The filtration requires the knowledge of the protocol structure of Ethernet, 802.1Q, 802.1q, IP, UDP (User Datagram Protocol) or TCP (Transmission Control Protocol) labels. There are defined and preset QoS profiles than enable the operation to be filtered based on 802.1p PCP (Priority Code Point), ToS (Type of Service) field in IPv4, ARP (Address Resolution Protocol) operation, TCP operation based on 802.1p PCP field or TCP operation based on ToS field.
3. QoS measurement setting on PLC devices
The sample structure of connection of a home network with the connection to a telecommunication provider’s IPTV services and internet connection based on the recommendations is shown in fig. 1. In the sample situation we use a specific line. The user is connected to the provider’s network using a standard technology – ADSL2+ (Asynchronous Digital Subscriber Line) (a stable line with minimum qualitative changes in a presumption).
To additionally decrease delay, errors and delay variation of the IPTV service, it is possible to set up the optimalization for this type of service on the modems. It can be divided into TCP or UDP streams. In case of using TCP for video transfer it is recommended to set the optimalization to Optimized of Media Player. In case of using IPTV service that is transmitted via UDP protocol, it is recommended to set it to Optimized for IPTV service. PLC modems automatically send 802.1Q tags in Ethernet frames without considering its use on PLC device inputs. That affects the frame follow settings where it is always necessary to consider the 4-byte-long 802.1Q VLAN (Virtual Local Area Network) tag. In case the VLAN tag is being used at the Ethernet input to the PLC device, its value is being copied into the PLC device tag. So in this case as well only one tag is used within the Ethernet frames.
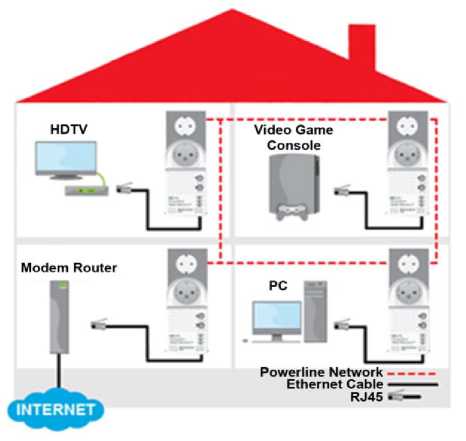
Fig 1: The use of PLC technology for data transfer.
Using this connection it is possible to transfer two IPTV channels, several VoIP connections and a highspeed data transfer (internet connection). Because of the QoS requirements for VoIP and IPTV connections, data rate limitations are not applicable. The connection transfers these three qualitatively different signals together, but different from the managing logic point of view.
The manual traffic filtering based on the DSCP (Differentiated Service Code Point) value is realized in the following steps. Firstly, it is necessary to set the filtration of the Type field in Ethernet II frame by setting the Offset value to 16 (shifting by 16 B) (fig. 2) with a 16-bit-long Bitmask to 0xFFFF. The tracked value in this field is 0x0800 (IPv4).
Considered start of frame
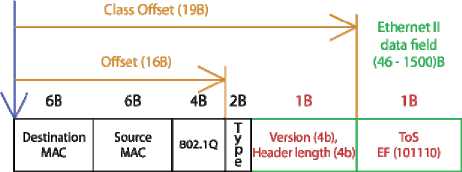
Fig 2: The Offset and Class Offset parameters setting for operation filtration based on DSCP field.
After filtrating IPv4 packets it is necessary to set the filtration based on ToS or DSCP filed in IPv4 header. Offset for the beginning of the DSCP field is 19 B long (fig. 2). DSCP with ECN bits is one byte long and so the Class Bitmask must be set to 0xFF to cover the one-bytelength. Based on the operation classification setting in output of an ADSL2+ router, the value Class Patter in also set. For VoIP operation the DSCP value EF (10111000 B with ECN bits) is set. Similarly, for the AF41 (10001000 B ) class, used for IPTV operation, the Class patter value is 0x88.
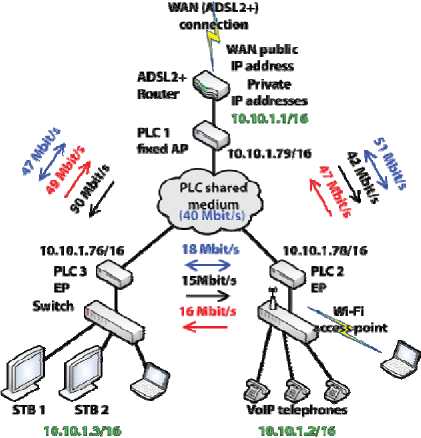
Fig 3 : Model of a network aimed to measure the performance parameters.
To ensure the complete evaluation of parameters of the VoIP and IPTV QoS and the capacity of the transmitted flows we used IxChariot measuring system by Ixia [5].
The delay between transmitted G.711 ц VoIP connections has an exponential distribution with a minimum value 1ms and a maximum value 1000 ms. IPTV operation is mainly formed by UDP operation, or on the higher layer, RTP (Real-time Transport Protocol) operation. Currently the MPEG 2 TS (Transport Stream) is used with MPEG 4, or MPEG 4 AVC or VC-1 coding.
Most IPTV providers transmit IPTV services as variable bitrate flows. The biggest telecommunication operator in our country chose the constant bitrate of the transmitted channels. This choice may be influenced by the choice of simpler multiplexors or easier quality management of such IPTV streams (it enables to measure MDI (Media Delivery Index) [5]). The obvious disadvantages may be seen in non-optimal use of the transmission bandwidth in IP network.
The transmission speed of user’s ADSL2+ connection is limited, so the IPTV implementation with variable bitrate does not transmit more channels. These are the reasons why we use only constant bitrate MPEG2 TS flows.
The third kind of service is the data transfer from the Internet. This service uses TCP, as well as UDP protocol, but in average TCP multiple times exceeds the UDP data rate. In our measurements we expected the worst possible scenario, i.e. maximal usage of the internet access.
In fig. 3 you may see the network model and real measured average transmission speeds of TCP flows stable within 10 minutes on IP protocol layer. One-way measurements between points are marked in black and red arrows; bi-directional measurements are marked in blue. Each arrow represents a measurement of transmission speed between two opposite PLC devices only, excluding the third device in transmission. The average transmission speed in TCP operation between all PLC devices simultaneously and bi-directionally was 40 Mbit/s, which is a higher transmission speed than the maximal speed on an ADSL2+ line. The more devices transmit to the shared medium, the lower the transmission speed. With such transmission speed measurements it is possible to create a network. The branch between the end points 10.10.1.1 and 10.10.1.2 will be used for the connection of a VoIP telephone and a computer. The second branch between 10.10.1.1 and 10.10.1.3 will be used to connect the two STBs for IPTV service and more computers using the Internet access. The connection between the individual points will be possible in either direction.
In fig. 4 we can see the measured characteristics of MOS factor of more VoIP connections with secured and non-secured QoS. The maximum available value of MOS factor in the defined measurement software for the G.711 ц codec is 4,4.
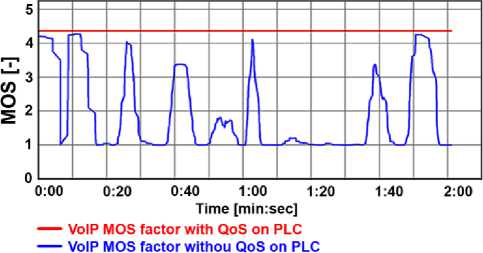
Fig 4 : comparison of raw skeleton and precise skeleton with short branchs removed
All the measurements reflecting the IPTV transfer from a WAN line can be divided in measurement applying the optimalization of the transfer for TCP (Optimized for Media Player) and optimalization for UDP protocol (Optimized for IPTV service). Under each of these settings the operation of the modems is being measured with and without the QoS being applied. The transfer optimalization using multicast was not necessary since the measurements were realized through unicast.
The measurements without considering the QoS are made with the following setting on each of the PLCs:
-
• relative priority of the PLC device (Default Priority) is preset to 2,
-
• no operation filtration is applied (e.g. based on the protocol or ToS field).
The measurements considering the QoS are made with the following setting on each of the PLCs:
-
• PLC with IP address 10.10.1.79 is set onto a fixed
AP (Access Point) with Default Priority 5 and the operation filtration based on ToS field,
• PLC with IP address 10.10.1.78 is set on EP (End Point) with Default Priority 4 and the operation filtration based on ToS field,
4. The measurement of QoS of a PLC network
PLC with IP address 10.10.1.76 is set on EP (End Point) with Default Priority 3 and the operation filtration based on ToS field.
The first test analyzes the load coming from ADLS2+ line:
-
• 2 x VoIP G.711 from endpoint 10.10.1.1 to 10.10.1.2, DSCP = EF
-
• 2 x IPTV MPEG 2 TS with constant transfer speed of 9Mbit/s on IP level per flow, transfer from endpoint 10.10.1.1 to 10.10.1.3, DSCP = AF41
-
• 4,5 Mbit/s internet streams (combination of TCP and UDP protocols, predominantly TCP), SMTP file download (1 Mbit/s), BittTorrent download via UDP (1 Mbit/s), DNS via UDP (16 kbit/s) and video streaming via UDP (2,5 Mbit/s), transfer from endpoint 10.10.1.1 to 10.10.1.3 like with IPTV, DSCP = 0. From endpoint 10.10.1.2 to 10.10.1.3 the aggressively preset TCP and UDP operation is transmitted (IPTVv.scr). From endpoint 10.10.1.3 to 10.10.1.2 TCP operation is transmitted.
The measurement results are shown on tab. 1. In these measurements we focused on the load of the shared media since the differences in measurements are the most remarkable. The measurements realized with no addition load on the shared media caused by data transfer only between the 10.10.1.3 and 10.10.1.2 network devices showed minimum differences and that is why there is no reason for comparison.
Table 1 : Data transfer via ADSL line with the current demanding file transfer.
|
Measurement type |
Optimized for Media Player |
Optimized for IPTV service |
|||
|
No QoS |
QoS |
No QoS |
QoS |
||
|
VoIP |
R-factor [ - ] |
90,88 |
91,29 |
90,88 |
91,39 |
|
OWD [ms] |
8,25 |
4,25 |
7,75 |
4,25 |
|
|
Delay variation [ms] |
2,931 |
2,407 |
3,569 |
2,219 |
|
|
Average loss [%] |
0 |
0 |
0 |
0 |
|
|
IPTV |
Average DF [ms] |
122 |
69,5 |
101 |
43 |
|
Average MLR [MF/s] |
71,362 |
4,204 |
95,78 |
0 |
|
|
OWD [ms] |
103,5 |
32,5 |
110,5 |
18,5 |
|
|
Delay variation [ms] |
0,538 |
0,588 |
0,625 |
0,688 |
|
|
Average loss [%] |
1,201 |
0,067 |
1,646 |
0 |
|
|
Data |
Transmission speed |
16,889 |
11,97 |
16,547 |
11,847 |
VoIP transfer directed from PLC network to WAN line has worse QoS than opposite directed VoIP connections. This interference is caused by the preset priority of the transmission of PLC devices with IP address 10.10.1.78 that was lower than on PLC with IP address 10.10.1.79. The major influence on the increase of VoIP QoS connection in this measurement was the decrease of the delay and delay variation.
A great influence of the QoS setting might be also seen on the IPTV streams. In case of IPTV transmission optimalization for TCP, the transmission loss decreased from 1,2 % to 0,07 %. The optimalization of IPTV for UDP even more improved IPTV QoS where DF decreased to 43 ms and the transmission loss is zero.
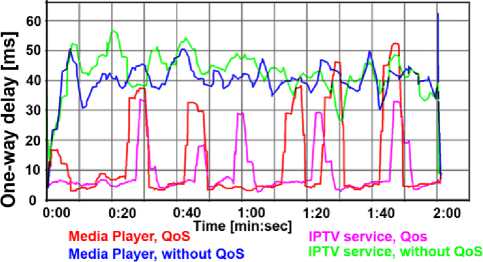
Fig 5: One-way delay for individual measurements (the result for VoIP and IPTV connections).
Fig. 5 shows summary one-way delay curves of VoIP and IPTV streams for individual QoS settings. This result shows that when no QoS was applied, the one-way delay curve does not indicate high variation like the measurements with applied QoS.
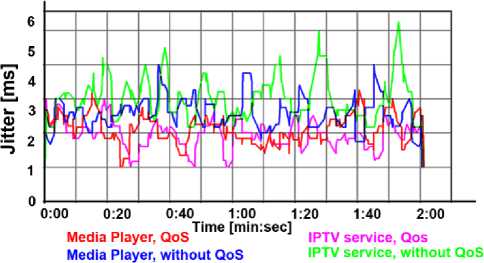
Fig 6: Delay variation for individual measurements (the result for VoIP and IPTV connections).
Fig. 6 shows the course of delay variation of VoIP and IPTV flows for individual measurements. The values oscillate within the radius of 2 to 6 ms.
In fig. 7 we can see the total throughput of all flows within the given measurement based on the QoS on PLC devices. In the measurements with the application of QoS a lower network throughput is seen which is caused by the QoS management itself.
The second test compares the quality management in PLC network using preset ToS QoS and manual QoS setting. The measurements are made for different number of VoIP connections: 4, 24 and 96 and the shared medium is overloaded with a data flow.
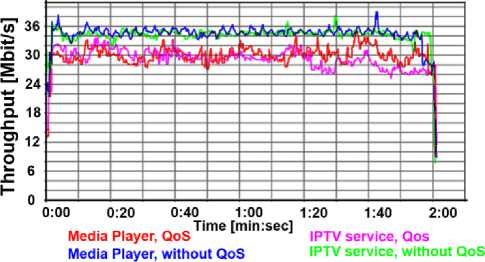
Fig 7: Total throughput of all flows for individual measurements.
The measurements used the following settings:
-
• N x VoIP G.711 µ from endpoint 10.10.1.1 to 10.10.10.1.2, DSCP = EF,
-
• N x VoIP G.711 µ from endpoint 10.10.1.2 to 10.10.10.1.1, DSCP = EF,
-
• 2 x IPTV MPEG 2 TS with constant transmission speed of 9Mbit/s on IP level per flow, the transmission from endpoint 10.10.1.1 to 10.10.10.1.3, DSCP = AF41,
-
• data operation (combination of TCP and UDP operation, the TCP prevailing): SMTP file download (1 Mbit/s), BittTorrent download via UDP 3 Mbit/s), DNS via UDP (16 kbit/s) and video stream via UDP (5 Mbit/s), demanding TCP operation as a supplement to the residual transfer speed, the transfer from endpoint 10.10.1.1 to 10.10.10.1.3 like with IPTV, DSCP = 0.
In tab. 2 the average values for individual measurements for VoIP, IPTV and data operation are shown. The measurements were divided based on the setting of QoS management in PLC network to measurements excluding the preference of operation based on DSCP/ToS field (No QoS), QoS management based on ToS field using preset values given by the manufacturer (ToS QoS) and manual QoS.
Table 2: Transfer 2 of bi-directional VoIP connections.
|
4xVoIP |
No QoS |
ToS QoS |
Manual QoS |
|
|
VoIP |
R factor [ - ] |
90,883 |
91,33 |
91,36 |
|
One-way delay [ms] |
6,167 |
4,75 |
4,083 |
|
|
Delay variation [ms] |
5,694 |
2,891 |
1,667 |
|
|
Delay variation maximum [ms] |
51,5 |
22,75 |
24,667 |
|
|
Average loss [%] |
0 |
0 |
0 |
|
|
IPTV |
Average DF [ms] |
119 |
2,5 |
0,833 |
|
Average MLR [MF/s] |
1005,004 |
0 |
0 |
|
|
One-way delay [ms] |
144,833 |
0,45 |
0,1 |
|
|
Delay variation [ms] |
1,04 |
0,85 |
0,771 |
|
|
Delay variation maximum [ms] |
69,833 |
25,125 |
26,833 |
|
|
Average loss [%] |
17,836 |
0 |
0 |
|
|
Data |
Transfer speed |
21,388 |
18,659 |
18,573 |
Considering the VoIP operation no big differences are obvious. TDMA technology in this case ensures the quality of small packets with no need to preset the QoS. The situation is different with big, 1370 B IPTV packets, where depending on QoS application the loss decreased from 117,836 % to 0 % in both cases of QoS application. The transmission speed of data operation reaches the transmission rate of about 20 Mbit/s which is below the maximum total transmission speed of the media on the level of 40 Mbit/s. The transmission rate of the data flow is higher for measurements excluding the QoS and approximately the same are the readings for ToS QoS and Manual QoS.
The tab. 3 shows the results for the measurements like in the case before but with 24 VoIP bi-directional flows. Similarly like with the four VoIP connections, the degeneration of VoIP signal quality has not been seen, considering the loss, one-way delay and delay variation. In case of the measurements for IPTV operation, the change for the application of ToS QoS is seen, where the loss was almost 0,1 %. For manual QoS there were no transmission quality changes detected.
The transfer of 48 bi-directional VoIP connections (tab. 4.) requires the transmission speed of about 8,6 Mbit/s. This number of connections generates great number of packets per second, which is seen in average loss of bi-directional connection of 0,363 % for QoS measurements. ToS and Manual QoS showed no losses. It can be concluded that even with a big number of VoIP connections this technology is able to maintain high quality for VoIP connections. For IPTV application a significant loss is seen from the transmission in measurements with no QoS applied on the level of 33 % and applying the preset settings of ToS on the value of almost 8 %. Both values are, of course, not suitable for video transmission in such congested environment. The best results had the measurements for Manual QoS where the transmission losses of IPTV were none. The measurements are time limited and during this time no loss was determined. However that does not mean this loss will not be readable in long-term measurements.
Table 3: Transfer 12 of bi-directional VoIP connections.
|
24xVoIP |
No QoS |
ToS QoS |
Manual QoS |
|
|
VoIP |
R factor [ - ] |
91,257 |
91,36 |
91,107 |
|
One-way delay [ms] |
5,889 |
5 |
4,267 |
|
|
Delay variation [ms] |
2,392 |
2,647 |
2,161 |
|
|
Delay variation maximum [ms] |
38,18 |
24,82 |
36,664 |
|
|
Average Loss [%] |
0 |
0 |
0 |
|
|
IPTV |
Average DF [ms] |
105,167 |
28 |
0,7 |
|
Average MLR [MF/s] |
975,146 |
5,457 |
0 |
|
|
One-way delay [ms] |
150,333 |
46,333 |
0,1 |
|
|
Delay variation [ms] |
0,961 |
0,85 |
0,867 |
|
|
Delay variation maximum [ms] |
45 |
29,167 |
37,667 |
|
|
Average loss [%] |
17,033 |
0,096 |
0 |
|
|
Data |
Transmission speed |
19,633 |
17,528 |
17,192 |
Now we would like to compare the individual readings for different numbers of VoIP connections with each other.
Table 4: Transmission of 48 bi-directional VoIP connections.
|
96xVoIP |
No QoS |
ToS QoS |
Manual QoS |
|
|
VoIP |
R factor [ - ] |
90,635 |
91,225 |
91,033 |
|
One-way delay[ms] |
6,589 |
5,677 |
6,778 |
|
|
Delay variation [ms] |
2,391 |
2,842 |
2,99 |
|
|
Delay variation maximum [ms] |
48,094 |
26,303 |
38,156 |
|
|
Average loss [%] |
0,363 |
0 |
0 |
|
|
IPTV |
Average DF [ms] |
86,5 |
196,75 |
4 |
|
Average MLR [MF/s] |
1952,217 |
440,942 |
0 |
|
|
One-way delay [ms] |
222,75 |
462,5 |
1,367 |
|
|
Delay variation [ms] |
1,019 |
0,881 |
0,883 |
|
|
Delay variation maximum [ms] |
37,25 |
37,75 |
50 |
|
|
Average loss [%] |
33,296 |
7,609 |
0 |
|
|
Data |
Transmission speed |
17,109 |
12,841 |
10,917 |
In fig. 8 you can see the comparison of the average value of R-factor of all connections for individual measurements according to the QoS settings and the number of simultaneous VoIP connections. R-factor includes individual parameters, such as transfer and buffer loss, one-way delay, buffer delay and delay variation.
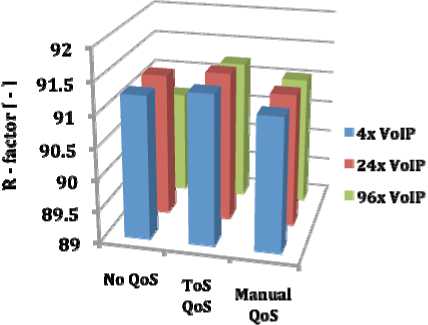
Fig 8: The comparison of VoIP R-factor for individual measurements.
From the readings it can be concluded that without considering the settings and despite the overload on the media, it is possible to ensure the quality for the VoIP communication. The highest decrease in quality can be seen in the measurements excluding QoS with 96 VoIP connections. ToS QoS and Manual QoS keep the quality more or less constant, with no significant changes. It is obvious that any change between these two measurements in the total value of R-factor, where the Manual QoS has a lower value with the benefit of much better quality of the transmitted IPTV signal.
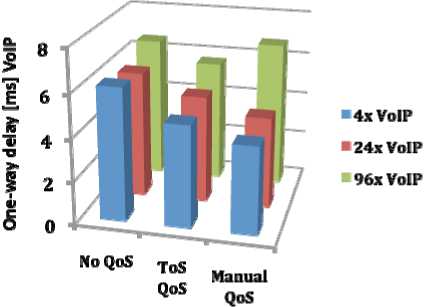
Fig 9: Comparison of one-way delay of VoIP connections for individual measurements.
Fig. 9 shows the average one-way delay of VoIP connections considering the settings of QoS decreases from the measurements excl. QoS to manual QoS where the results for one-way delay are the best. The most significant difference can be seen in manual setting of QoS in 96 VoIP connections where the one-way delay achieves the values of almost 7ms. However, for this small deterioration of delay, quality of IPTV is gained.
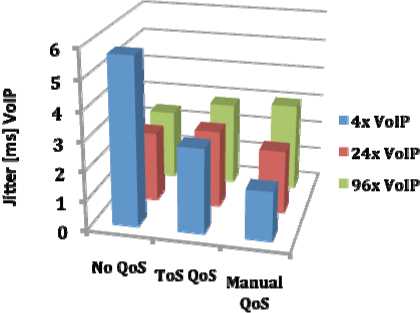
Fig 10: The comparison of average delay variation in VoIP connections for individual measurements.
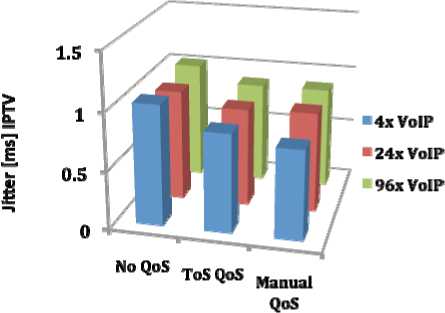
Fig 12: The comparison of average delay variation of IPTV connections for individual measurements.
Average levels of delay variation of VoIP connections (fig. 10) with the settings were nearly the same for all measurements. The main differences were obvious in maximum values of delay variation which also cause the loss in buffer of the receiver when measuring with 96 VoIP connections and settings with no QoS.
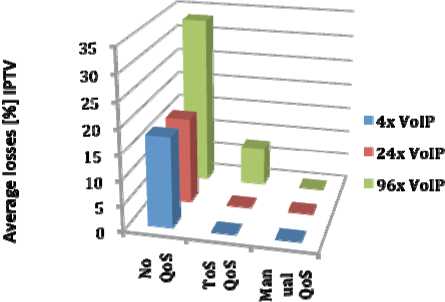
Fig 11: Comparison of average loss in IPTV connections for individual measurements.
Average losses in IPTV flows (fig. 11) have only been detected in case of No QoS and in case of ToS QoS for 96 VoIP connections.
In fig. 12 is shown the distribution of the average variation of IPTV operation for individual measurements. The readings are small and do not show big differences between measurements.
5. Conclusion
PLC devices enable high-speed communication in existing electrical circuits. The main advantage of this solution is the possibility of designing a network where it is not possible to renew the data network or this would be too expensive [6, 7]. The suitable application of the tested PLC devices is in home networks where no high numbers of demanding flows can be expected. When designing the network properly a high quality VoIP and IPTV communication transfer can be expected. The main quality criteria are sufficient transfer capacity via shared media. That is why it is important to consider the electric wiring in the household when designing the network. For the installation it is recommended to measure the throughput of the connection on long-term basis.
To ensure the quality more kinds of technology are used. One of these is the line quality measurement and signal modulation adaptation to channel quality, the use of TDMA transmission only in contradiction with the manual operation prioritization. Other options to influence the quality and network load is in management of multicast groups and transmission optimalization for UDP IPTV operation. Concluding, we would like to thank to Bratislava branch of Corinex that helped us with a more precise description of devices parameters that were helpful in network design and measurements.
Acknowledgements
This work is a part of research activities conducted at Slovak University of Technology Bratislava, Faculty of Electrical Engineering and Information Technology, Institute of Telecommunications, within the scope of the project „Support of Center of Excellence for SMART Technologies, Systems and Services II., ITMS 26240120029, co-funded by the ERDF“.
