Theoretical and methodological problems of measuring social comfort: results of empirical analysis based on Russian data

Author: Shakleina Marina V., Volkova Maria I., Shaklein Konstantin I., Yakiro Stanislav R.
Journal: Economic and Social Changes: Facts, Trends, Forecast @volnc-esc-en
Section: Theoretical issues
Article in issue: 5 т.13, 2020.
Free access
The research is aimed at developing theoretical aspects of the latent category “social comfort”, searching for new assessment methods and opportunities for using various types of information resources (big data, continuous and sample population surveys, state and administrative statistics). Development of the axiomatics of a new category and its modeling are necessary to determine a real level of population's well-being in dynamics, to assess true quality of people's life. The purpose of the research is aimed at development of theoretical and methodological foundations of social comfort as a latent category in the discourse of social processes and the test of its assessment using the method of generalized principal components. The main results of the study include the clarification of connotations and development of axiomatics for the new category “social comfort”; systematization of relevant international surveys, and the formation of reliable categories that ensure the validity of the results; assessment of the level of social comfort using the method of generalized principal components for a space-time sample - the STATIS method. The peculiarity of the method, used for space-time sampling, is an opportunity to simultaneously study object-feature matrices, related to different time points, and the identification of the parameters that mostly determine the scattering of observation objects: in our case, the regions of the Russian Federation, on a plane of main components of the generalized (compromise) space. The scientific novelty of the research is development of the axiomatics of the new category “social comfort”, which allows measuring and studying a person from the point of view of his inclusion in society, semantic correlation of various types of activity with time and external situation, expanding the subjective aspect of measuring the quality of life as one of the most important categories of social and economic science; the formation of new approaches to modeling and evaluating social comfort. The study is of practical interest to researchers, and its results may be used for creating socio-economic development programs in Russian regions.
Social comfort, axiomatics, synthetic latent category, quality of life, statis
Short address: https://sciup.org/147225485
IDR: 147225485 | UDC: 330.59 | DOI: 10.15838/esc.2020.5.71.8
Text of the scientific article Theoretical and methodological problems of measuring social comfort: results of empirical analysis based on Russian data
The relevance of developing theoretical aspects of the latent category of social comfort and improving the methodology for measuring its components is primarily caused by the fact that currently used macroeconomic statistical indicators are not enough to assess a real level of well-being in dynamics and measure true quality of people’s life, taking into account non-directly measurable, implicit values in a certain socio-economic context. This thesis is supported by the results of the work of the Stiglitz-Sen-Fitoussi Commission, which presented “Report on the Measurement of Economic Performance and Social Progress” in 2009, justifying the need to build more accurate and adequate statistical tools for measuring the quality of life. Based on the Commission’s findings, OECD and Eurostat approved in 2010 a number of documents that encourage countries to develop a comprehensive system of life quality indicators that fully utilize available statistical information on the interaction between different aspects of human life and are suitable for measuring well-being within each area of individuals’ daily activity. Russia is currently in the process of reforming social statistics in accordance with the OECD standards and recommendations.
The problem of measuring multi-aspect categories is discussed in the works of many foreign (Easterlin R.A. [1], Frey B. [2], Powdt-havee N. [3], Miringoff M. [4], Lane R.E. [5],
Layard R. [6], etc.) and domestic (S. Ayvazyan [7], O. Antipina [8], L. Rodionova [9], etc.) authors.
Currently, it is known about a large number of various integral measures of life quality, population’s well-being, etc. A linear convolution of incoming variables, which are aggregated without weight values, either with equal weights or weights determined by an expert group, is common to the methods used. A general problem while constructing composite aggregate indicators is the weak validity of the weights of indices included in indicators.
Proposed methods of linear convolution also differ according to the type of data used. There are known integral indices based on statistical indicators [4; 7; 10–15], data from sociological surveys [16; 17, etc.], as well as ones combining subjectivist and objectivist information [18–21, etc.].
Big data have a great potential for measuring complex multidimensional latent categories 1 [22–29]. Attempts to use Google data in building a summary indicator of well-being are discussed [30; 31]. As part of OECD projects, in March 2016, Y. Algan and his colleagues used big data to build the “Google Well-Being Index” in America to understand which aspects of life are associated with negative and positive emotions. Many studies show that data from search queries and social networks are superior in quality to data from sociological surveys, since they exclude distorted responses from respondents [32; 33].
Advantages of Google Trends Data [34]:
-
1) available with high frequency; possible to observe daily changes of users’ moods and preferences;
-
2) many people respond to questionnaire for altruistic reasons, since there is no motive to answer frankly and thoroughly [35]. Search queries can reveal more personal information. For example, the topic of job loss may be very sensitive for a respondent, and they may not want to communicate about it. On the other hand, volume of searches for words “find a job”, “job search” shows a person’s concern for this problem. It is emphasized that data obtained from the search system is more objective [36].
To build reliable categories of social comfort, it is necessary to select data that is relevant and will not lead to the risk of retraining. Problems of primary processing of big data, comparability, consistency, and adequacy are discussed in the works of Askitas N., Varian H., Reimsbach S., Penna D., Benjamin D., and Baker S. [37–42].
In “Human Development Report in the Russian Federation”, dedicated to the analysis and adaptation of the UN sustainable development goals (SDGs) to Russian realities, the dominance of social goals over economic and environmental ones is confirmed. In the paradigm of sustainable development, the role of implementing human potential becomes more important. It increases the need to monitor the implementation of the SDGs, which depends on development of statistical database, big data, indicators, and aggregated indices. Despite the fact that the most popular index for assessing human potential is the UN Human Development Index, the search for the most universal way to assess well-being, quality of life, life satisfaction, and other latent categories continues.
The purpose of the research is development of theoretical and methodological basics of social comfort as a latent category in the discourse of social processes and to a test of its assessment using the method of generalized principal components.
To achieve it, the following tasks were defined:
-
1) clarification of connotations and development of axiomatics for the new category “social comfort” in contextual conditions of Russian regions;
-
2) systematization of current international surveys and formation of reliable categories that ensure the validity of results when building a semantic search system for information about the components of social comfort;
-
3) analysis of matrix-valued time series based on information about the level of social comfort in Russian regions using the STATIS method.
Theoretical and methodological overview
The term “comfort” in social theories goes back to the French word conforter/confort, which means physical and emotional support, comfort, reassurance, and it is not associated with physical or material comforts. In this connotation, consistent with the fundamental paradigm for achieving SDGs, the center of which is a Man, it is necessary to analyze the category of social conformity and the degree of achievement for an individual in the specific context of socio-economic, cultural, and institutional environment. Let us see how the etymology of the “comfort” category has changed ( Tab. 1 ).
The study of the epistemological foundations of the term “comfort” shows a rather complex nature of this phenomenon. Social comfort is a latent multidimensional category that has a dynamic development nature and combines subjective and objective assessments [60; 61; 62].
An individual’s desire for comfortable conditions is studied in a number of disciplines: psychology, sociology, medicine, etc. Research in psychology claims that the search for comfort is the basis of human behavior from birth to death [49].
Thus, modern understanding conceptualizes comfort as an optimization process carried out through active perception, interpretation, and change of the socio-physical environment. However, most researchers may question whether it is appropriate to introduce the category “social comfort” in a scientific glossary, while there is life satisfaction, economic well-being, quality of life, level of happiness, subjective well-being, etc. In the work of M.V. Leshaikina [63], a distinction between three categories is made: social comfort, quality of life, level of happiness, and the problems of its measurement are studied for an individual and conglomerates of individuals. The difference is in the structure of incoming indicators and the usage of assessment approaches, which is associated with a different composition of questionnaires, for example, to study the level of happiness, on the basis of which the components of the final meter are formed. In particular, if priority is given to the study of the inner world of an individual and his psychophysiological feelings during the assessment of the level of happiness, in assessing the quality of life, priority is given to welfare issues, then, in assessing social comfort, the focus is on contextual conditions of an individual’s social life, “motivating to various forms of positive activity and expressed in the balance of preferences, social environmental properties, and inclinations of an individual” [63]. In addition, the introduced category is defined as an optimization process of interaction between a person and external environment, aimed at maximizing the state of comfort. If comfort is an objective function that an individual maximizes, then the components of comfort (various types of an individual’s activity) are the parameters of the objective function. The task is to find the target values of parameters under current restrictions for each type of activity. The maximum of the
Table 1. Etymology of the “comfort” category
Statistical specification of social comfort is partially characterized by properties of related categories “life satisfaction”, “quality of life”, etc., but it conceptually represents a continuous dynamic process of searching for an optimal set of an individual’s life priorities unlike static categories “life satisfaction” or “quality of life”. In this regard, the socio-economic context of the introduced category will differ in the functional affiliation of analyzed indicators. It is noted that the assessment of social comfort should be formed taking into account information about social living conditions and infrastructure, which includes social, transport, information, technological, energy, cultural and entertainment components [63]. A significant limitation of the work, in our opinion, is the absence in the hierarchical structure of the category of a block of indicators that characterizes the financial well-being of an individual. This aspect of the issue should not be ignored, since one of the defining activities of an individual is the process of achieving material well-being. T. Skitovskiy notes that comfort is a release of tension, the decrease of arousal. Due to the fact that economics is a science that studies the distribution of resources by society in order to reduce the tension caused by its limited nature, behavioral aspects of consumption and production are directly related to comfort [64].
Empirical basis of the study
Social comfort is a complex multi-aspect category that requires new approaches to assessment, as well as an update and innovation in the selection of indicators. In this regard, it is proposed to analyze existing international and Russian databases. Systematization of current surveys will allow creating reliable categories that ensure the validity of the results while building a semantic search system for information about the components of social comfort. Next, we examine the most well-known microdata databases ( Tab.2 ).
Desk analysis of the composition of variables, contained in the programs of sample observations on socio-demographic problems, allows making a statistical specification of the social comfort components. It is noted that contextual environmental conditions are not the background where various forms and types of human activities occur, but a factor that determines human actions and judgments [59], which is why the study of comfort expands. Analyzing the epistemological principles of contextuality, it should be said that it is impossible to reliably substantiate constantly existing invariably acting set of factors that determine a particular situation in reality [67]. Contextual conditions of social comfort should be evaluated not only at a given time but also in dynamics. The composition of indicators of social comfort covers a wide range of economic, environmental, social, political, institutional, and other conditions in a town, region, and country as a whole. At this stage of the research, we form the components of social comfort in such a way that they are characterized by a comprehensive coverage of contextual conditions and subjective, psychological assessments of an individual; in this regard, we use the key components of living conditions and personal well-being of an individual from listed databases. Separate studies will be devoted to further analysis and formation of a reduced set of indicators at the macro level, as well as on the basis of big data usage. A generalized set of components (or incoming categories) of studied social comfort may be represented in a diagram form (Fig. 1). The need to use subjectivist information in subsequent assessment and modeling is explained by the conceptual features and functional conditionality of social comfort.
Incoming categories of social comfort are formed on the basis of the European panel of indicators, which makes up the main part of foreign surveys, and they are adapted to take into account surveys on living conditions and quality of life conducted in Russia. A single database, used for analysis, can only reveal certain aspects of the phenomenon. For example, the European Health Interview Survey (EHIS) focuses primarily on population health
Table 2. Systematization of current international and Russian surveys
|
5 |
i I 1 i Е § 8 « ° й Е ст g 8 й 3 Е |
«таг 6, о О ’ey О ГО Ё о го го Е Ё СО ф го ф го Го ^ Е ГО Ф о о го Е ^ г. ^ ^ -—" ^ го о ^ ^ § ё ° - « га та та Б 2 § Ё ГО Ё °" о и о? Е 2 2 и г ё го о) го ° Ё Ё > — ё 11 S су Е го "^ 03 О- су о Ё Ф _ — ГО ГО со — Е го ^ § °; g 8 су с £ с g о 1 ЕI I i 1 |
Е CD" “ ЦТ, Pl -Е .| g I ё 1 ■^ го ° i - < 5 f 11 5 | " Е ” т | ” О) -^ ф ^ 8 -5 °" га 8 о ст та "о Е Е СР--ф СР Е -о Е О го со" Го ф ГО "° го -Е |
СР о
го 8 о го .9 го -8 N ГО о i ° 11 о Е ° го 5 Е ° о та И о Н с о. 3 Е -Е1 S ст та Е ~ ° та 2 с ® ^ ” ~ та « cd" Го ’ey 8" _ГО Е о. ^ g О’ .го су ф -Е) -Е о ’ey "ф о |
1 i С о О) E "co Го ro "^ ^ ® | E ra S ra" 1 i f |
"е |
"О Го "ф го :-| f ГО "ф ^ 1 го" о о о ф ГО ГО ; 11 ill 2га с |
го .о -Ё .го со о .1 i ё о 8 1 ^ го Е >^ о Е = Ф ГО о. 03 | га Е | Е Е § ф О _ ъ Ё о ^ ф" TD О ГО Е , го го о го го о Е го | | Ё Е -^ о о I е 8 |
|
~ о 5 I |
Ё Ё |
СО СР ГО 5 Е S' Sol g 1 ш ё -^ 8 |
Его о “1 1 га . 2 ГО СУ >. 1 S'<”5 ° Н ГО CD ш сс н ° |
"§ а $ го 8 ^ ” § О ГО o’ "о СЭ го Ф ф т— ОС О. СР |
Ilf 1 g 1 о 1 го ^ uZ -E |
tr |
||
|
1 |
га = ® та с S 2 ° о § CM U ° С го Ё .Е _Е ф Е О Е CD CD С/D О 5 ГО >4 "С |
§ |
Ф CxJ с> т > CD CD СУ <^J -,— CxJ CxJ го § ^ jt^ a o> o> а T— Ф ’У CO o> CO о CO O) CD O) -b-7 ГО О) O) CD 8 I « I 5 3 E CO O) CD C О
|
ст |
||||
|
ГО с£ Ё О § су "о с х та^ || Ё го Ё о с Ф со Ё ^ О О ГО СУ >2 ±3 ь о - > 8 С~ о ГО с „о ё ™ | § 1 = Е ° та S S Е .Е g |
03 СО Ё ГО — о ^ го ^ ^ го го со го g ° "го Ё S Ё Е Ё го го о го го -- ^ о I f S | ГО Д ф ф — 5 3 — о, го го го 8 ёё го ° |
Е ст е ё 311 о Е § ||| Го -^ ГО |
p "ra 8 s |
® ё y> о. и ° ” и « о -^ 120 а5 о о ^ с 1 Ё Го о |
Ё го ъ о S о ф "гё п Ъ Ё ° О) " -О Го Ё о го о i 111 .§ ° ГО "су ГО 4-, 3 5 ГО -^ ф ОС го С. -с |
|||
|
ф о £ CD Е 03 |
5 § “ _ СР Ё Ё О_ ф _J СО ^ ^ "О =) ш ио го ^ |
ё ® 5 8 g- £ 23 Го -2 ш |
55 о ^ |
s T3 co 11 |
о |
б 3 ОС СО |
||
Table 2 (ending)
|
5 |
Е О |
о ^ 1 1 ц ~ го о .9 со Ё °, Е о ^ ? оз g 9 1« 1 |
Е ^ S' Ё Ц Е о ^ со ГО ^ g g S 1 ° g СО >ч Е CD ГО С ГО .Го S "го '— — .9 .9 со g го 1 ^1 8 i 1 |
Е о |
ГО СЕ Го го .го "го 9 го !^^ 1 ф Ё "5 Е Ё ф ф о ° ф Q -с е 8 "Ч го о ф Ё о S ° с ® Ё о " — 2 Го Е о со "со Ё tc s ф ё Z Ё « 8 ° о .9 у g’ О) го g 5 1 f о ф Ё го 8 8 ё Ё Ё го 1 Ё Ё ё ° 81 ф |
i Е Е Е |
Е Ё o' Е Е ф о 8 ЕЁ „ ъ е 5 го — 9 го "о g др о |
|
|
® ° ” го ~ о 5 I |
5 |
5 |
5 |
|||||
|
1 |
сг Е Ё |
|||||||
|
§ 8 га ° Е 45 га ™ ф ” 5 Ё о та .го 111 |г £Г |
1 Ё = Е г о § ° го | £ ~ = S 1 8 5 о | Е го го о -9 о g g> Го CD ° Ё Е S' 8 Е ° ст 2 Ё ~ ” ^5 ®е ё ° О "55 У С CD CD С .Е го -о _а |
i _ 1 § | ё Е о д 5 Ё Е Q СО о ™ -О Ё сотат-" О CD о со "О Ф з го го Ё Е 8 Ё го Ё Ё g О о $ го го Е о о о 8 Ё 8 Ё Ъ Ё с Ё S 2 Го го 8 Ё 3 Е го С Ё ф ° =5 ° 8 Ё ф го та го га > 8 та го о "55 cd го Ё та Ё Ё Ё С= < и-. О- (3 V) о о |
||||||
|
О £ CD Е 03 |
ф о Ё S Ё ° го Е с 5 00 |
CD 01 1 о — го Е -g го .9 5 Ilg 1 "го го ^ 1 1^ 8 2 C7D Ъ 8 -Е $2. |
о 1 Ё ” О S Ё Ё та го Ё 8 8 й .Е Ё 8 го ° Е "о ф е > 5 £ 9 оз о о 9 Е со ~ ^ <С ср ч— "с о Е со СО О’ О CD О CD -—- |
|||||
Figure 1. Incoming categories of social comfort
Health and medical care (EU-SILC, EHIS, EVS, WVS, Gallup, RLMS, CMPLC, SMQAS)
Education and training (EU-SILC, CMPLC, SMPI, SMQAS)
Social support and pension provision (EHIS, EVS, WVS, CMPLC, SMPI, SMQAS)
Financial situation (EU-SILC, WVS, Gallup, RLMS, CMPLC, SMPI)
Labor activity and work conditions (EU-SILC, EHIS, EVS, WVS, Gallup, RLMS, CMPLC, SMPI, SMQAS)
House, living conditions (EU-SILC, EVS, WVS, Gallup, RLMS, CMPLC, SMPI)
Ethical standards and values (EVS, WVS, Gallup)
Security (EHIS, EVS, WVS, Gallup)
Political stability (WVS, Gallup, Gallup)
Leisure and free time (EVS, WVS, CMPLC)
Ecology and environment (EVS, WVS, Gallup)
Infrastructure (transport, communication, Internet) (WVS, Gallup, CMPLC)
Social comfort
Source: own compilation on the basis of foreign and domestic databases.
research. In this regard, the “social comfort” category should be considered dynamic in terms of the composition of components, and it will be updated with the emergence of new registered statistical indicators.
Measurement methodology
To assess the level of social comfort, we use the tools of generalized principal components for spatial and temporal sampling – the STATIS method (Structuring Three-Way Data Sets in Statistics) [66; 67]. Its peculiarity is an opportunity to conduct a simultaneous study of object-feature matrices related to different times, as well as to determine the parameters on which the scattering of objects of observation depends the most. STATIS has a wide range of capabilities for analyzing multidimensional data. It can be used to analyze any statistical indicators. The most important thing is to comply with the requirement to maintain a constant number of observation objects and studied indicators: i.e., time is a variable. STATIS may be used in economics, social sciences, meteorology, and even wine-making. In our case, we analyze the position of the regions of the Russian Federation on a plane of main components of the generalized (compromise) space. The source data is a matrix of p feature values (j = 1,...,p) according to number of observations (i = 1, ..., n) for time gap of years (t = 1,..., k). Due to limited information and statistical base, we consider only three moments in time: t1 = 2014, t2 = 2016, t3 = 2018.
The results of complex observations of population’s living conditions in Russian regions for 2014, 2016, and 2018 were used as initial data (Rosstat); the modeling was performed in the Matlab environment.
The analysis includes features that characterize living conditions, the quality of the surrounding area, working conditions, and health status: the parameters that, among others, form the assessment of a comfortable living environment. It should be mentioned that a limited list of indicators does not reflect all aspects of the studied category, since it is based on the Russian monitoring of the economic situation and public health. At the same time, we consider the sufficiency of included components to be reasonable, since the experimental assessment is carried out on the basis of a single database using the method of generalized principal components for a spacetime sample, which takes into account one of the most important properties – the dynamism of contextual conditions of social comfort.
The STATIS data analysis tool can be represented as an iterative procedure.
The first iteration defines the matrix product St = XtX{,St (n x n) , where Xt(n x p) is the matrix of values for the year t, t = 1, ..., к [68], and X-(n x p) is the transposed matrix of initial values. During the second step, we find the scalar product (St,St,)H-s = trace^Sf Stl), where St, = Xt,X^, t' = 1,...,k- 1. Then the correlation coefficients are calculated to determine the pairs of time points with the closest statistical connection, and the correlation matrix is constructed C = UVU-1, where U-1U = I [69]. U matrix elements are eigenvectors of the C correlation matrix, on the diagonal of the matrix V, there are the eigenvalues of the C matrix. From this, it is possible to determine the coordinates of the source data sets in the space of principal components of the correlation matrix: G = UV1/2 (n x n).
Normalized weight coefficients «t = Ut/^k „ are calculated according to the ^t=i Ut components of the U eigenvector corresponding to the maximum eigenvalue of the C correlation matrix.
One of the main stages of data analysis, using the STATIS tool, is the calculation of the components of the generalized (compromise) matrix 5 сотр (n x n) as a linear combination S comp = ^ t=1a-t S t . However, there are alternative methods, such as averaging of all matrices S t . The accounting matrix and the load matrix are determined as the result of the spectral decomposition of the compromise matrix: S comp = QLQ 1 [70].
Results of the research
To assess the level of social comfort in the regions of the Russian Federation, a set of indicators, presented on the portal of the Federal State Statistic Service based on the results of a comprehensive monitoring of population’s living conditions, was formed. To achieve uniformity of statistical base in 2014, 2016, and 2018, a collection of comfortable living and working conditions of individuals was collected ( Tab. 3 ), which is consistent with the input categories of social comfort, defined in accordance with European and Russian dashboards indicators of sociological surveys.
Statistical links between the studied periods are expected to be strong, but the most noticeable link is between 2016 and 2018 (0.995; tab. 4 ).
Insufficient variability of the estimates of the Russian households is explained not only by the inertia of many socio-economic processes but also by time stable attitude of the majority of individuals toward assessment of living
Table 3. Initial set of indicators
|
Designation |
Indicator, % of a number of respondents |
|
x (1) |
Share of respondents who are quite satisfied with their earnings |
|
x (2) |
Share of respondents who are quite satisfied with their work schedule |
|
x (3) |
Share of respondents who are quite satisfied with work conditions |
|
x (4) |
Share of respondents who are quite satisfied with distance to work |
|
x (5) |
Share of respondents experiencing professional satisfaction from work |
|
x (6) |
Share of respondents experiencing moral satisfaction from work |
|
x (7) |
Share of respondents who highly assess their health |
|
x (8) |
Share of households which report the presence of playgrounds in good condition in a local area |
|
x (9) |
Households that indicated that they do not feel constrained while living there |
|
x (10) |
Respondents who note a sufficient level of heat in a household |
|
x (11) |
Respondents who note absence of dampness, freezing of walls and floors in a househild |
|
x (12) |
Respondents who note absence of noise, air pollution in a place of residence, dust and soot from streets |
|
x (13) |
Respondents who note sufficient illumination of a household’s surrounding area or in its entrance |
|
Source: own compilation according to Comprehensive monitoring of population’s living conditions (Rosstat). |
|
Table 4. Correlation matrix С
shows the projection of the original data sets on the plane of the first two principal components of the correlation matrix C .
Figure 2. Projection of data sets for 2014, 2016, and 2018 on the axis of main components of the matrix С
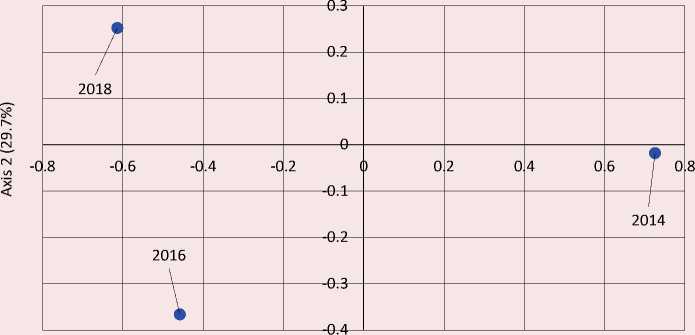
Axis 1 (70.3%)
Source: own compilation.
In order to determine the components of the load and accounting matrices according to available data, a compromise (generalized) matrix is calculated which includes all three initial object-feature sets. Of all possible procedures for calculating matrix components
Scomp , we chose variant of weighted estimates, meaning Scomp = Et=1atSt, since it allowed us to get the maximum value of the information content criterion of the compromise matrix in comparison with others QuaL
^ comp
= Я1/у л * In Li^i к II, calcu-t=iiUt I
this case, QualScomp = 70,2% |
Weight coefficients, a t = U t /^
lated in proportion to the components of the eigenvector, corresponding to the maximum eigenvalue of the correlation matrix C, have the following values: 2014 = 0.403, 2016 = 0.254,
2018 = 0.341.
To evaluate the structure of the generalized information, a spectral decomposition of the compromise matrix is performed: Scomp = QLQ-1. As the result, the groups of variables that are most closely statistically related to each other and correlated with the first two axes of the compromise space are determined.
The characteristics of Russian population’s satisfaction with the level of wages and working conditions in regions are of primary importance for forming the level of social comfort ( Fig. 3 ).
There are several groups of variables that are most closely related to each other in the context of generalized space analysis:
– good health is naturally associated with the quality of housing, the absence of adverse factors that can cause or exacerbate existing chronic diseases;
– evaluation of the quality of work, such as moral and professional pleasure to be associated with the regime of work.
Figure 3. Projection of elements of the load matrix on the plane of the first principal components of the compromise space
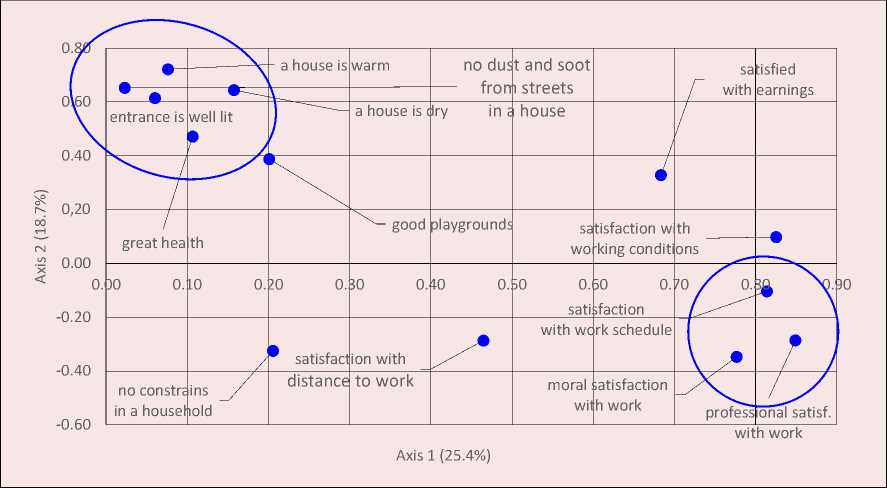
Source: own compilation.
Satisfaction with working conditions rather than earnings is of the greatest importance, which once again confirms the thesis that it is necessary to introduce and study such latent categories as social comfort.
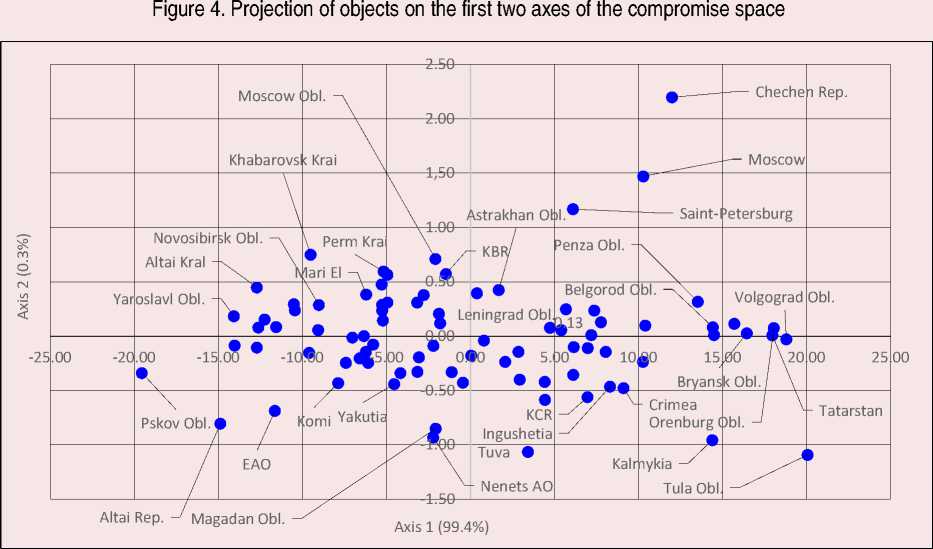
The projection of all observation points (regions of the Russian Federation) on the plane of the first two axes of the generalized space makes it possible to estimate the degree of their distance from each other. For this purpose, the components of the matrix of accounts are calculated, each row of which is an object of observation, and the columns are the axes of the compromise space ( Fig. 4 ).
As the result of using the STATIS method to assess the level of social comfort based on subjective data, groups of regions where population is more or less satisfied with their living conditions are identified. The leaders are Moscow, St. Petersburg, and the Chechen Republic. This could be explained not only by higher (in comparison with other territories) estimates of wages, working conditions, and professional and moral satisfaction from work but also by the well-being of surrounding territories, including the availability of good playgrounds. In addition, groups of regions that are similar in terms of socio-economic development and, in our opinion, the peculiarities of the mentality in a particular area have been formed. These are, for example, the southern territories of Russia: Crimea, Karachay-Cherkess, Ingushetia republics; Penza, Volgograd, Orenburg oblasts and the Republic of Tatarstan.
Conclusion
Currently, there is a significant gap between traditional dimensions of economic growth, employment, and other important socioeconomic phenomena (level of happiness, quality of life). In some countries, this gap undermines public confidence in official
Source: own compilation.
statistics. All this suggests that the current system of socio-economic phenomena measurement is imperfect. J. Stiglitz’s analysis [71] showed that existing macroeconomic indicators are clearly insufficient to assess the real level of well-being in the country, and, therefore, there is a need to introduce the new category of “population’s social comfort of living”.
Justification and introduction of the complex latent category “social comfort” into scientific usage will make a significant contribution to development of the theory of life quality, allowing us to measure and study a person from the prospect of his/her inclusion in society, the semantic correlation of various activities in relation to time and external situation, expanding the subjective aspect of life quality measurement as one of the most important categories of social and economic science.
Systematization and analysis of current international and domestic surveys (European Union Statistics on Income and Living Conditions (EU-SILC), European Health Interview Survey (EHIS), European Values Study, World Values Survey, Gallup, RLMS (NRU “Higher School of Economics”), Comprehensive monitoring of population’s living conditions (Rosstat), Selective monitoring of population’s income and participation in social programs (Rosstat), Selective monitoring of the quality and availability of services in education, health and social services, and employment promotion (Rosstat)) allow making statistical specification and create a reliable panel of valid indicators of social comfort, which will be further reduced in accordance with the estimated level (individual group, city, region, country) of comfort and possibilities of harmonization of various information resources.
Due to its relevance, multi-aspect, and high role of the contextual factor, social comfort requires new approaches and methods for its assessment. In this regard, matrix-valued time series, based on information about the level of social comfort in Russian regions, using the STATIS method, were analyzed in this paper. Groups of regions that are similar in terms of socio-economic development and, in our opinion, mentality in a particular area were revealed (Crimea, Karachay-Cherkess, Ingushetia republics, Penza, Volgograd, Orenburg oblasts, and the Republic of Tatarstan). The method allowed us to consider the entire set of initial information in one block, to find the key parameters that form the main axes of the generalized space, and to identify the features of the distribution of regions on the plane of its main axes.
The results of the study are the first stage of the project. Taking into account the potential and prospects of using big data in measuring complex latent categories, we will have to solve the problem of creating methodological approaches to big data processing in terms of building statistical series based on them in compliance with basic principles that ensure the quality of statistics – comparability, consistency, accuracy and uniformity of data, and, based on the interconnection of various data types, to build a dynamic system of social comfort with the ability to model the institutional design of the socio-economic environment depending on the expected trends in national economy development. Deepening of the analysis on the studied problem will expand the practical significance of the research. Its results may be used by executive authorities at the federal, regional, and municipal levels to develop organizational, administrative, and program-oriented documents for implementing social policies of executive authorities at the appropriate level. It could also be used for determining the strategic priorities of the government’s social policy: at the federal level, it is possible to typologize entities of the Russian Federation by the level of social comfort in order to conduct a holistic-oriented social policy of the government.
References Theoretical and methodological problems of measuring social comfort: results of empirical analysis based on Russian data
- Easterlin R.A. Explaining happiness. Proceedings of the National Academy of Sciences, 2003, vol. 100, no. 19, pp. 11176–11183. DOI: 10.1073/pnas.1633144100
- Frey B.S., Stutzer A. Happiness and Economics: How the Economy and Institutions Affect Human Well-Being. Princeton University Press, 2010. 220 p.
- Powdthavee N. Unhappiness and crime: Evidence from South Africa. Economica, 2005, vol.72, no. 287, pp. 531–547. DOI: 10.1111/j.0013-0427.2005.00429.x
- Miringoff M., Miringoff M.L. The Social Health of the Nation: How America is Really Doing. Oxford University Press, 1999. 241 p.
- Lane R.E. Quality of life and quality of persons: A new role for government? Political theory, 1994, vol. 22(2), pp. 219–252. DOI: 10.1177/0090591794022002002
- Layard P.R.G., Layard R. Happiness: Lessons from a New Science. Penguin UK, 2011. DOI: 10.2307/20031793
- Aivazyan S.A. Analiz kachestva i obraza zhizni naseleniya: monografiya [Analysis of the Quality and Lifestyle of the Population: Monograph]. Moscow: TsEMI RAN, 2012. 432 p.
- Antipina O.N. Economics of happiness as an academic research discipline. Voprosy ekonomiki=Voprosy Ekonomiki, 2012, no. 2, pp. 94–107. DOI: 10.32609/0042-8736-2012-2-94-107 9 (in Russian).
- Rodionova L.A. Methodological aspects of measuring and modeling the level of happiness. Ekonomika. Upravlenie. Pravo= Economics.Management. Law, 2012, no. 1-2(25), pp. 25–30 (in Russian).
- Cobb C., Halstead T., Rowe J. The Genuine Progress Indicator: Summary of Data and Methodology. Redefining Progress, San Francisco, 1995. Vol. 15.
- Estes R.J. Praxis: Resources for social and economic development. School of Social work & Practice, University of Pennsylvania, 1995.
- Rahman T., Mittelhammer R.C., Wandschneider P. Measuring quality of life across countries: A multiple indicators and multiple causes approach. The Journal of Socio-Economics, 2011, vol. 40(1), pp.43–52. DOI: 10.1016/j.socec.2010.06.002
- Kacapyr E. Are you middle class? American Demographics, 1996, vol. 18(10), pp. 30–35.
- Andreev E.M., Alekseev A.I., Zubarevich N.V. Rossiya regionov: v kakom sotsial’nom prostranstve my zhivem? [Russia of Regions: What Social Space Do We Live in?]. Moscow: Pomatur, 2005. 278 p.
- Schmidt-Traub G, Kroll C., Teksoz K., Durand-Delacre D., Sachs D. National baselines for the sustainable development goals assessed in the SDG Index and dashboards. Nature Geoscience, 2017, vol. 10, pp. 547–555. DOI: 10.1038/NGEO2985
- Ferrans C., Powers M. Quality of life index: Development and psychometric properties. Advances in Nursing Science, 1985, vol. 8, pp. 15–24. DOI: 10.1097/00012272-198510000-00005
- Raphael D., Waalen J., Karbanow A. Factor analytic properties of the quality of life profile: Examination of the nine subdomain Quality of Life model. Psychological Reports, vol. 88(1), pp. 265–276. DOI: 10.2466/ pr0.2001.88.1.265
- Hagerty M. et al. Quality of life Indexes for National Policy: Review and Agenda for Research. Social Indicator Research, 2001, vol. 55(1), pp. 1–97. DOI: 10.1023/A:1010811312332
- Veenhoven R. Happy life expectancy: A comprehensive measure of quality of life in nations. Social Indicators Research, 1996, vol. 39(1), pp. 1–58. DOI: 10.1007/BF00300831
- Kahneman D., Deaton A. High income improves evaluation of life but not emotional well-being. Proceedings of the National Academy of Sciences, 2010, vol. 107(38), pp. 16489–16493. DOI: 10.1073/pnas.1011492107
- How’s Life? 2020: Measuring Well-being. Paris, OECD Publishing, 2020. DOI: 10.1787/9870c393-en
- Prata D.N. et al Social data analysis of Brazilian’s mood from Twitter. International Journal of Social Science and Humanity, 2016, vol. 6(3), pp. 179. DOI: 10.7763/IJSSH.2016.V6.640
- Nguyen Q.C. Leveraging geotagged Twitter data to examine neighborhood happiness, diet, and physical activity. Applied Geography, 2016, vol. 73, pp. 77–88. DOI: 10.1016/j.apgeog.2016.06.003
- Yang C., Srinivasan P. Life satisfaction and the pursuit of happiness on Twitter. PloS one, 2016, vol. 11(3), pp. 1–30. DOI: 10.1371/journal.pone.0150881
- Wang W., Hernandez I., Newman D.A., He J., Bian J. Twitter analysis: Studying US weekly trends in work stress and emotion. Applied Psychology, 2016, vol. 65(2), pp. 355–378. DOI: 10.1111/apps.12065
- Liu P., Tov W., Kosinski M., Stillwell D.J., Qiu L. Do Facebook status updates reflect subjective well-being? Cyberpsychology, Behavior, and Social Networking, 2015, vol. 18(7), pp. 373–379. DOI: 10.1089/cyber.2015.0022
- LiKamWa R., Liu Y., Lane N.D., Zhong L. Moodscope: Building a mood sensor from smartphone usage patterns. Proceeding of the 11th annual international conference on Mobile systems, applications, and services, 2013, pp. 389–402. DOI: 10.1145/2462456.2464449
- Schwartz H.A., Sap M., Kern M.L., Eichstaedt J.C., Kapelner A., Agrawal M., Kosinski M. Predicting individual well-being through the language of social media. Biocomputing 2016: Proceedings of the Pacific Symposium, 2016, pp. 516–527, DOI: 10.1142/9789814749411_0047
- Carlquist E., Nafstad H., Blakar R., Ulleberg P., Delle Fave A., Phelps J. Well-being vocabulary in media language: An analysis of changing word usage in Norwegian newspapers. The Journal of Positive Psychology, 2017, vol. 12 (2), pp. 99–109, DOI: 10.1080/17439760.2016.1163411
- Algan Y., Beasley E., Guyot F., Higa K., Murtin F.,Senik,C. Big data measures of well-being: Evidence from a Google well-being index in the United States. OECD Statistics Working Papers, 2016. 38 p. DOI: 10.1787/5jlz9hpg0rd1-en
- Fantazzini D., Shakleina M., Yuras N. Big data for computing social well-being indices of the Russian population. Applied Econometrics, 2018, vol. 50, pp. 43–66.
- Mavragani A., Tsagarakis K. YES or NO: Predicting the 2015 Greek Referendum results using Google Trends. Technological Forecasting and Social Change, 2016, vol. 109, pp. 1–5. DOI: 10.1016/j.techfore.2016.04.028
- Oliveira-Brochado A. Google search-based sentiment indexes. IIMB Management Review, 2019, pp. 1–38. DOI: 10.1016/j.iimb.2019.10.015
- Da Z., Engelberg J., Gao P. The sum of all FEARS investor sentiment and asset prices. The Review of Financial Studies, 2015, vol. 28(1), pp. 1–32. DOI: 10.1093/rfs/hhu072
- Singer E. The use of incentives to reduce nonresponse in household surveys. Survey nonresponse, 2002, vol. 51, pp. 163–177.
- Vissing-Jorgensen A. Perspectives on behavioral finance: Does” irrationality” disappear with wealth? Evidence from expectations and actions. NBER macroeconomics annual, 2003, vol. 18, pp. 139–194. DOI: 10.1086/ma.18.3585252
- Askitas N., Zimmermann K.F. Google econometrics and unemployment forecasting. 2009. Available at: https://ssrn.com/abstract=1465341
- Varian H.R. Big data: New tricks for econometrics. Journal of Economic Perspectives, 2014, vol. 28(2), pp. 3–28. DOI: 10.1257/jep.28.2.3.
- Reimsbach-Kounatze C. The proliferation of “big data” and implications for official statistics and statistical agencies: A preliminary analysis. OECD Digital Economy Papers, no. 245. OECD Publishing, 2015. DOI: 10.1787/5js7t9wqzvg8-en
- Della Penna N., Huang H. Constructing consumer sentiment index for US using Google searches. Working Papers, no. 26. University of Alberta, 2009. 22 p.
- Benjamin D.J. Beyond happiness and satisfaction: Toward well-being indices based on stated preference. American Economic Review, 2014, vol. 104, no. 9, pp. 2698–2735. DOI: 10.1257/aer.104.9.2698
- Baker S., Fradkin A. The impact of unemployment insurance on job search: Evidence from Google search data. Review of Economics and Statistics, 2017, vol. 99(5), pp. 756–768. DOI: 10.1162/REST_a_00674
- Josselin R. The Diary of Ralph Josselin, 1616–1683(vol.3). OUP Oxford, 1991. 707 p.
- Crowley J.E. The Invention of Comfort: Sensibilities and Design in Early Modern Britain and Early America. JHU Press, 2003. 349 p.
- Berens L.H. The Digger Movement in the Days of the Commonwealth, 2014. 315 p.
- Smith A. An Inquiry into the Nature and Causes of the Wealth of Nations. JJ Tourneisen and JL Legrand, 1791. DOI: 10.1093/oseo/instance.00043218
- Odile-Bernez M. Comfort, the acceptable face of luxury: An Eighteenth-century cultural etymology. Journal for Early Modern Cultural Studies, 2014, vol. 14(2), pp. 3–21. DOI: 10.1353/jem.2014.0015
- Scitovsky T. The Joyless Economy: The Psychology of Human Satisfaction. Oxford University Press on Demand, 1992. 449 p.
- Slater K. Human Comfort. Vol. 1. USA: CC Thomas Pub Ltd., 1985.
- Kolcaba K. Comfort Theory and Practice: A Vision for Holistic Health Care and Research. Springer Publishing Company, 2003. 201 p.
- Tetior A.N. Ekologicheskaya garmoniya, krasota, komfortnost’ goroda (na baze ekologicheskoi infrastruktury) [Ecological Harmony, Beauty, Comfort of the City (based on Ecological Infrastructure)]. Moscow: FGOU VPO MGUP, 2010. 312 p.
- Tetior A.N. Ekologicheskaya infrastruktura i sreda zhizni [Ecological Infrastructure and Living Environment]. Moscow: REFIA, 2002. 102 p.
- Merinov Yu.N., Merinova Yu.Yu. Ecological and social comfort of the population in the southwestern part of the Rostov region. In: Aktual’nye voprosy i innovatsionnye tekhnologii v razvitii geograficheskikh nauk [Topical issues and innovative technologies in the development of geographical sciences], 2020. Pp. 328–331 (in Russian).
- Cabanac M. Pleasure and joy, and their role in human life. In: Creating the Productive Workplace. D. Clements-Croome ed. London: E&FN Spon, 2006. Pp. 40–50.
- Lyons A.C., Spicer J. A new measure of conversational experience: The speaking extent and comfort scale (SPEACS). Assessment, 1999, vol. 6(2), pp. 189–202. DOI: 10.1177/107319119900600206
- Owens T.J., Stryker S., Goodman N. (ed.) Extending Self-Esteem Theory and Research: Sociological and Psychological Currents. UK: Cambridge University Press, 2001, pp. 198–222.
- Spake D., Beatty S., Brockman B., & Crutchfield T. Consumer comfort in service relationships: Measurement and importance. Journal of Service Research, 2003, vol. 5(4), pp. 316–332. DOI: 10.1177/1094670503005004004
- Cole R.J. Re-contextualizing the notion of comfort. Building Research & Information, 2008, vol. 36(4), pp. 323–336. DOI: 10.1080/09613210802076328
- Shin J. Toward a theory of environmental satisfaction and human comfort: A process-oriented and contextually sensitive theoretical framework. Journal of Environmental Psychology, 2016, vol. 45, pp. 11–21. DOI: 10.1016/ j.jenvp.2015.11.004
- Stiglitz J., Sen A., Fitoussi J. Report by the Commission on the Measurement of Economic Performance and Social Progress, 2009.
- McGregor A., Sumner A. Beyond business as usual: what might 3-D wellbeing contribute to MDG momentum? IDS Bulletin, 2010, vol. 41(1), pp. 104–112. DOI: 10.1111/j.1759-5436.2010.00111.x
- Allin P., Hand D.J. The Wellbeing of Nations: Meaning, Motive and Measurement. UK: John Wiley & Sons, 2014. DOI: 10.1002/9781118917046
- Leshchaikina M.V. Econometric cross-country analysis of the living population social comfort. Prikladnaya ekonometrika=Applied Econometrics, 2014, no. 36 (4), pp. 102–117 (in Russian).
- Scitovsky T. The Joyless Economy. An Inquiry into Human Satisfaction and Consumer Dissatisfaction. London: Oxford University Press, 1976. 310 р.
- Obraztsova O.I., Popovskaya E.V. An essay on the multidimensional statistical methods to characterize the entrepreneurial context in Russian regions. Sotsiologicheskie issledovaniya=Sociological Studies, 2017, no. 4, pp. 93–106 (in Russian).
- Escoufier Y. L’analyse conjointe de plusieurs matrices de données. In: M. Jolivet (Ed.) Biométrie et Temps. Paris: Société Française de Biométrie, 1980. Pp. 59–76.
- Lavit C., Escoufier Y., Sabatier R., Traissac P. The ACT (STATIS method). Computational Statistics & Data Analysis, 1994, v. 18, pp. 97–119. DOI: 10.1016/0167-9473(94)90134-1
- Rivadeneira F.J., Figueiredo A.M.S., Figueiredo F.O.S., Carvajal S.M. and Rivadeneira R.A. Analysis of Wellbeing in OECD Countries through STATIS Methodology. HOLOS, 2016, vol. 7, pp. 335–351.
- Nguyen L.H., Holmes S. Ten quick tips for effective dimensionality reduction. PLoS Comput Biol 15(6), 2019, pp. 1006907. DOI: 10.1371/journal.pcbi.1006907.
- Corrales D., Rodriguez O. Interstatis: The STATIS method for interval valued data. Rev. Mat, 2014, vol. 21(1), pp. 73–83.
- Plato K. Two years after the report of the Stiglitz-Sen-Fitoussi Commission: What’s new in statistical measurement of social welfare and sustainable development? Voprosy statistiki=Voprosy Statistiki, 2011, no. 11, pp. 3–11 (in Russian).
