To study about the relation between oxygen delivery and hemodynamics during cardiopulmonary bypass

Author: Reddy A.P., Sunitha R., Thangavel P., Ramkumar Dr.J., Miller S.G.
Journal: Cardiometry @cardiometry
Section: Original research
Article in issue: 27, 2023.
Free access
The study put forth the relation between oxygen delivery and hemodynamics during cardiopulmonary bypass. The study was performed on 26 patients of either sex have age > 10 years and who underwent elective open-heart surgery from June 2017 - May 2018 in Sri Ramachandra Medical College & Research Institute. The patients with valvular heart diseases associated with other cardiac lesions like Intra cardiac shunts (ASD, VSD etc.) and Coronary artery disease (CABG) are excluded in the study. It examined the relationships among VO2, hemodynamics & DO2 during clinical perfusion, namely throughout moderately hypothermic CPB using a non-pulsatile roller pump while managing the alpha-stat acid-base with adults. The results revealed a linear relationship between VO2 and DO2, demonstrating that higher levels of delivery can perfuse and collect additional vascular beds throughout the CPB. Under bodily tissue perfusion, higher deliveries are advised to be avoided. The oxygen demand decreases by 7% for every 1OC decline in patient temperature.
Heart disease, oxygen, patients, surgery
Short address: https://sciup.org/148326616
IDR: 148326616 | DOI: 10.18137/cardiometry.2023.27.200210
Text of the scientific article To study about the relation between oxygen delivery and hemodynamics during cardiopulmonary bypass
Ashwanth P Reddy, R. Sunitha, Periyasamy Thangavel, J. Ram-kumar, S. George Miller. To study about the relation between oxygen delivery and hemodynamics during cardiopulmonary bypass. Cardiometry; Issue No. 27; May 2023; p. 200-210; DOI: 10.18137/cardiometry.2023.27.200210; Available from:
Oxygen used by the body (VO2) is a standard metric of tissue perfusion adequacy throughout cardiopulmonary bypass (CPB)16 and a measure of metabolic activity15. Despite temperature’s impact on lowering metabolic activity during CPB, the research is divided on the key determinants of VO2 during CPB15,17. The relationships between ventilation (VO2) and oxygen delivery (DO2)16,18,19,20,21,22) and VO2 and hemodynamic variables during clinical CPB19,21,23 have been the subject of several investigations, both on animals and people, with varying results.
To study the relation between oxygen delivery and hemodynamics during cardiopulmonary bypass.
Materials and methods
Criteria for inclusion
-
• Patients of either sex
-
• Patient age > 10 years
-
• Patients who underwent valvular heart surgeries
(including Redo valvular heart surgeries)
Exclusion criteria
-
• Patients with valvular heart diseases associated with other cardiac lesions like Intra cardiac shunts (ASD, VSD etc.)
-
• Coronary artery disease (CABG).
Data collection
Arterial * venous blood samples were collected: a) 10 mins. following initiation of CPB (mean tem perature of 32oC)
-
b) During hypothermia (mean temperature of 30oC) c) During rewarming (mean temperature of 34oC)
Anesthesia and Operative technique:
Anesthetic techniques are standardized for all patients. General anesthesia is induced with midazolam, fentanyl, whereas relaxation was achieved with vecuronium. Intravenous anesthesia is maintained by fentanyl throughout the operation. All our study patients undergo routine valvular heart surgeries through a median sternotomy and minimal invasive technique.
Heparin 400 IU/kg is given intravenously. Activated clotting duration being above 480 seconds triggers the initiation of cardiopulmonary bypass. Extracorporeal circulation is done with Sorin inspire adult membrane oxygenator, Sarns 8000 perfusion pump as well as a Spictra AF arterial line filter. Non-pulsatile perfusion is kept at a rate of flow of around 2.2 – 2.4 l/ m2 /min.
Patients are randomized by the perfusionist, using a computer-generated random number chart for addition of 10% mannitol to the priming solution. 1
liter Plasmalyte A solution, 3 mg /kg 20% mannitol as well as 10,000 IU heparin help prime the study group’s bypass circuit. 1-liter Plasmalyte A solution and 10,000 IU heparin help prime the control group’s bypass circuit.
Each patient is brought down until a nasopharyngeal temperature of around 28˚C. Following aortic cross-clamping, myocardial protection attained with intermittent antegrade cold blood cardioplegia (given at 08-10˚C). After rewarming, the aortic cross-clamp is released. Patients are rewarmed to around 37˚C. Heparinization is reversed by injecting protamine sulphate (1-1.3 mg per each 100 IU dose of heparin). Stable hemodynamics is used to wean patients off CPB. Patients are moved to the Cardiothoracic ICU following surgery.
Statistical Analysis:
Kolmogorov-Smirnov and Shapiro-Wilk tests
p-value < 0.05 is significant.
p-value > 0.05 is non-significant.
Discussion
Hypothermia is the temperature of the body being lower than 35oC or a state wherein a homeothermic mammal’s body temperature is below normal.
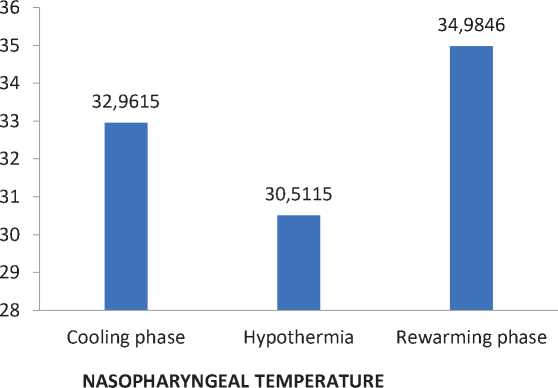
Nasopharyngeal temperature
|
Nasopharyngeal Temperature (ºC ) |
Cooling phase |
Hypothermia |
Rewarming phase |
|
Mean |
32.9615 |
30.5115 |
34.9846 |
|
Median |
31.9000 |
30.3000 |
34.8500 |
|
Standard deviation |
2.60938 |
2.30934 |
0.57667 |
|
Kolmogorov-Smirnova test (p-value) |
0.011 |
0.000 |
0.133 |
|
Shapiro-Wilk test (p-value) |
0.005 |
0.000 |
0.031 |
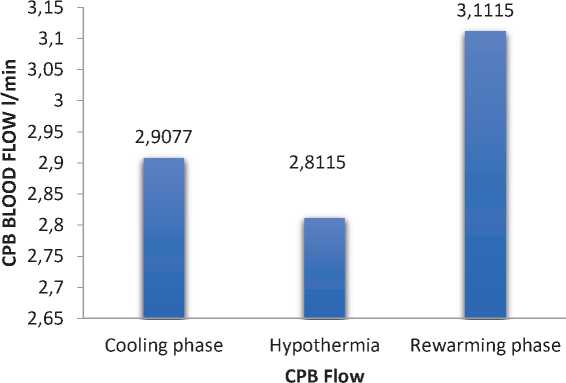
Cardiopulmonary bypass blood flow (CPB)
|
Cardiopulmonary bypass blood flow (CPB) |
Cooling phase (Mean temperature of 32.9615oC) |
Hypothermia (Mean temperature of 30.5115oC) |
Rewarming phase (mean temperature of 34.9846oC) |
|
Mean |
2.9077 |
2.8115 |
3.1115 |
|
Median |
2.9500 |
2.8000 |
3.1000 |
|
Standard deviation |
0.53361 |
0.37876 |
0.36696 |
|
Kolmogorov-Smirnova test (p-value) |
0.200 |
0.192 |
0.200 |
|
Shapiro-Wilk test (p-value) |
0.691 |
0.618 |
0.823 |
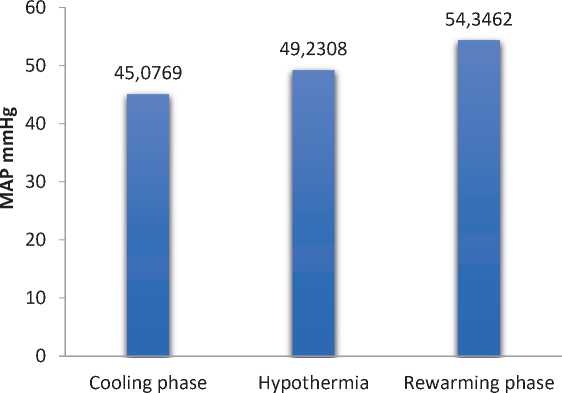
Mean arterial pressure (MAP)
|
Mean arterial pressure mmHg (MAP) |
Cooling phase (Mean temperature of 32.9615oC) |
Hypothermia (mean temperature of 30.5115oC) |
Rewarming phase (mean temperature of 34.9846oC) |
|
Mean |
45.0769 |
49.2308 |
54.3462 |
|
Median |
43.5000 |
46.000 |
51.5000 |
|
Standard deviation |
8.40439 |
11.19395 |
11.45406 |
|
Kolmogorov-Smirnova test (p-value) |
0.2 |
0.013 |
0.196 |
|
Shapiro-Wilk test (p-value) |
0.291 |
0.069 |
0.399 |
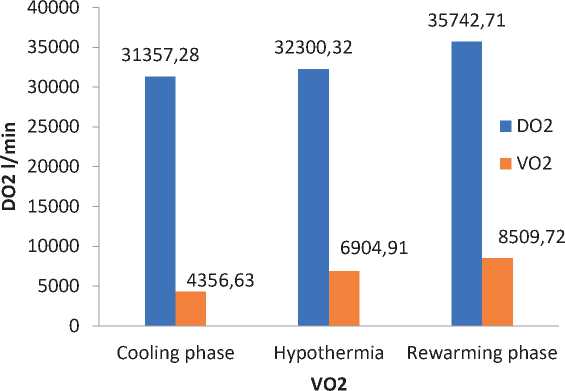
Oxygen delivery (DO2) and Oxygen consumption (VO2)
|
Cooling phase (mean temperature of 32.9615oC) |
Hypothermia (mean temperature of 30.5115oC) |
Rewarming phase (mean temperature of 34.9846oC) |
||||
|
DO2(l/min) |
VO2(l/min) |
DO2(l/min) |
VO2(l/min) |
DO2(l/min) |
VO2(l/min) |
|
|
Mean |
31357.28 |
4356.625 |
32300.3204 |
6904.912 |
35742.7075 |
8509.7171 |
|
Median |
30337.89 |
4224.580 |
31911.4250 |
7180.2450 |
36710.300 |
8256.1150 |
|
standard deviation |
7961.895 |
2503.319 |
5902.2588 |
2408.60283 |
5396.87619 |
2430.02405 |
|
Kolmogorov-Smirnova test (p-value) |
0.200 |
0.200 |
0.200 |
0.200 |
0.141 |
0.200 |
|
Shapiro-Wilk test (p-value) |
0.080 |
0.277 |
0.686 |
0.161 |
0.488 |
0.480 |
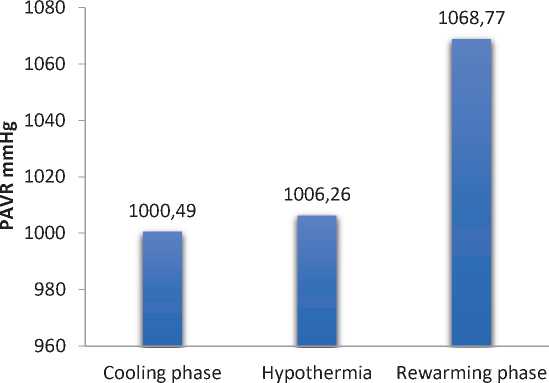
Peripheral arterial vascular resistance (mmHg)
|
Peripheral Arterial Vascular Resistance (mmHg) |
Cooling phase (mean temperature of 32.9615oC) |
Hypothermia (Mean temperature of 30.5115oC) |
Rewarming phase (mean temperature of 34.9846oC) |
|
Mean |
1000.4942 |
1006.2581 |
1068.7692 |
|
Median |
937.2350 |
884.2650 |
995.2350 |
|
Standard deviation |
586.10325 |
366.60336 |
431.82058 |
|
Kolmogorov-Smirnova test (p-value) |
0.000 |
0.062 |
0.200 |
|
Shapiro-Wilk test (p-value) |
0.000 |
0.351 |
0.737 |
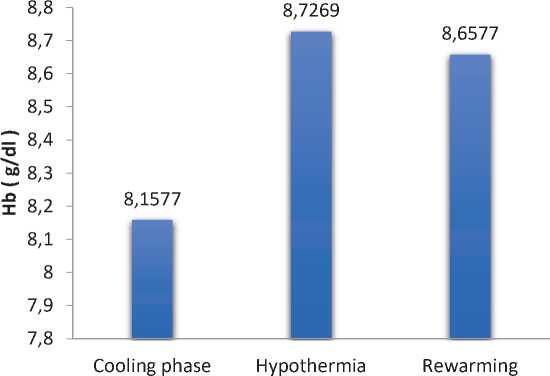
Hemoglobin (Hb)
|
Hemoglobin Hb (g/dl) |
Cooling phase (mean temperature of 32.9615oC) |
Hypothermia (Mean temperature of 30.5115oC) |
Rewarming phase (mean temperature of 34.9846oC) |
|
Mean |
8.1577 |
8.7269 |
8.6577 |
|
Median |
7.5500 |
8.6000 |
8.5500 |
|
Standard deviation |
1.48086 |
1.37712 |
1.21398 |
|
Kolmogorov-Smirnova test (p-value) |
0.022 |
0.200 |
0.200 |
|
Shapiro-Wilk test (p-value) |
0.022 |
0.054 |
0.150 |
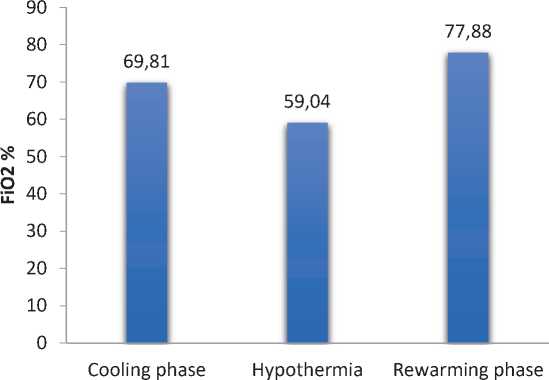
Fraction of inspired oxygen (FiO2 )
|
Fraction of Inspired Oxygen FiO2 (%) |
Cooling phase (Mean temperature of 32.9615oC) |
Hypothermia (Mean temperature of 30.5115oC) |
Rewarming phase (mean temperature of 34.9846oC) |
|
Mean |
69.8077 |
59.0385 |
77.8846 |
|
Median |
70.0000 |
60.0000 |
80.0000 |
|
Standard deviation |
9.43194 |
7.12377 |
4.28324 |
|
Kolmogorov-Smirnova test (p-value) |
0.023 |
0.042 |
0.000 |
|
Shapiro-Wilk test (p-value) |
0.025 |
0.015 |
0.000 |
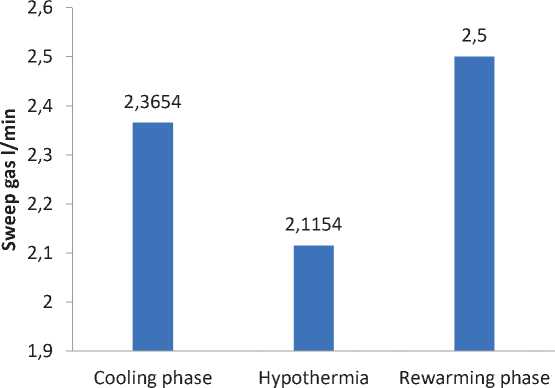
Sweep gas.
|
Sweep Gas (l/min) |
Cooling phase (mean temperature of 32.9615oc) |
Hypothermia (Mean temperature of 30.5115O) |
Rewarming phase (mean temperature of 34.9846oc) |
|
Mean |
2.3654 |
2.1154 |
2.5000 |
|
Median |
2.5000 |
2.0000 |
2.5000 |
|
Standard deviation |
0.50115 |
0.58835 |
0.44721 |
|
Kolmogorov-Smirnova test (p-value) |
0.002 |
0.001 |
0.003 |
|
Shapiro-Wilk test (p-value) |
0.029 |
0.60 |
0.001 |
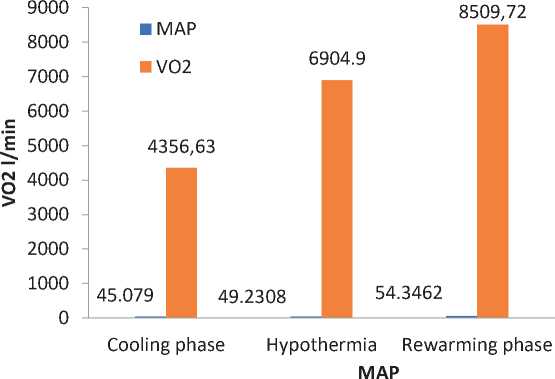
Mean arterial pressure (MAP) and oxygen consumption (VO2)
|
Cooling phase (Mean temperature of 32.9615OC) |
Hypothermia (Mean temperature of 30.5115OC) |
Rewarming phase (Mean temperature of 34.9846OC) |
||||
|
CPB BLOOD FLOW(l/min) |
VO2(l/min) |
CPB BLOOD FLOW(l/min) |
VO2(l/min) |
CPB BLOOD FLOW(l/min) |
VO2(l/min) |
|
|
Mean |
2.9077 |
4356.62 |
2.8115 |
6904.912 |
3.1115 |
8509.7171 |
|
Median |
2.9500 |
4224.580 |
2.8000 |
7180.24 |
3.1000 |
8256.115 |
|
Standard deviation |
0.53361 |
2503.319 |
0.37876 |
2408.60 |
0.36696 |
2430.024 |
|
Kolmogorov-Smirnova test (p-value) |
0.200 |
0.200 |
0.192 |
0.200 |
0.200 |
0.200 |
|
Shapiro-Wilk test (p-value) |
0.691 |
0.277 |
0.618 |
0.161 |
0.823 |
0.480 |
CPB BLOOD FLOW ( l/min )
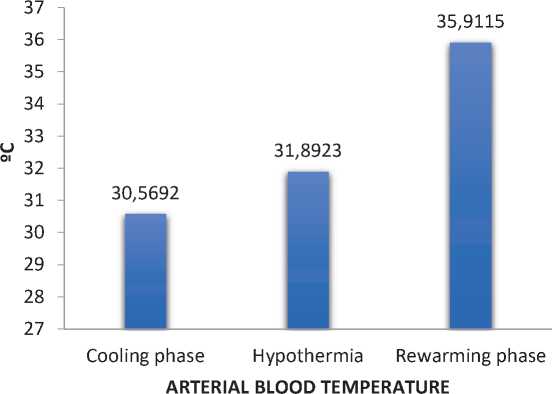
Arterial blood temperature
|
Arterial blood temperature (°C) |
Cooling phase (Mean temperature of 32.9615oc) |
Hypothermia (Mean temperature of 30.5115oc) |
Rewarming phase (mean temperature of 34.9846OC) |
|
Mean |
30.5962 |
31.8923 |
35.9115 |
|
Median |
31.1000 |
32.0000 |
35.7000 |
|
Standard deviation |
3.36711 |
2.98167 |
1.47141 |
|
Kolmogorov-Smirnova test (p-value) |
0.200 |
0.200 |
0.007 |
|
Shapiro-Wilk test (p-value) |
0.703 |
0.015 |
0.134 |
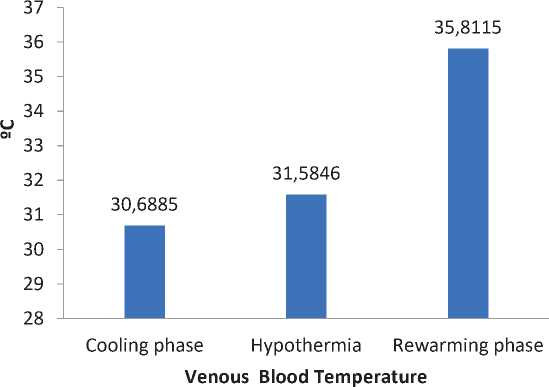
Venous blood temperature
|
Venous blood temperature (° C ) |
Cooling phase (Mean temperature of 32.9615OC) |
Hypothermia (Mean temperature of 30.5115OC) |
Rewarming phase (mean temperature of 34.9846OC) |
|
Mean |
30.6885 |
31.5846 |
35.8115 |
|
Median |
30.3500 |
32.1000 |
36.0000 |
|
standard deviation |
2.83695 |
2.27977 |
0.89233 |
|
Kolmogorov-Smirnova test (p-value) |
0.153 |
0.062 |
0.083 |
|
Shapiro-Wilk test (p-value) |
0.134 |
0.425 |
0.164 |
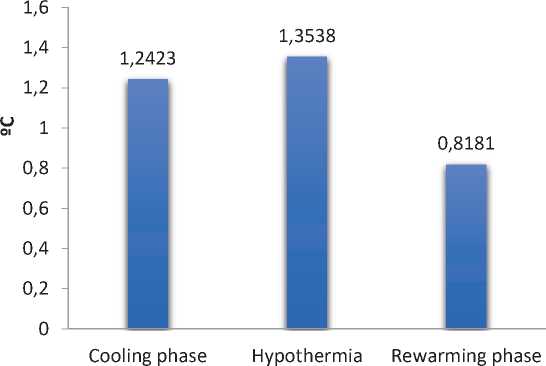
Arteriovenous blood temperature difference
|
Arteriovenous blood temperature difference (°C) |
Cooling phase (mean temperature of 32.9615OC) |
Hypothermia (Mean temperature of 30.5115OC) |
Rewarming phase (mean temperature of 34.9846OC) |
|
Mean |
1.2423 |
1.3538 |
0.8181 |
|
Median |
0.8000 |
0.9000 |
0.5000 |
|
Standard deviation |
1.10097 |
0.96922 |
0.85763 |
|
Kolmogorov-Smirnova test (p-value) |
0.083 |
0.002 |
0.000 |
|
Shapiro-Wilk test (p-value) |
0.000 |
0.001 |
0.000 |
|
9000 8000 7000 6000 5000 4000 3000 2000 1000 0 |
CPB FLOW |
|
VO2 4356,63 |
|
|
2,9077 |
Cooling phase
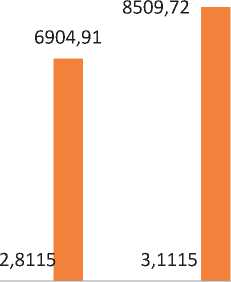
Hypothermia Rewarming phase
Arteriovenous Blood temperature difference
Physiology of hypothermia:
RATIONALE FOR THE USE OF HYPOTHERMIA:
-
• Hypothermia gives a degree of organ protection as well as safety margin throughout CPB.
-
• Hypothermia uses several mechanisms for its protective effect, one of which involves decreasing metabolic rate as well as oxygen consumption.
-
• Hypothermia aids in preserving stores of phosphates of high-energy & decreasing the release of excitatory neurotransmitters, which is vital in protecting the central nervous system.
-
• Hypothermia attenuates an excitotoxic cascade, which helps prevent the entry of calcium entry inside cells & restricts permeability of the membrane [10].
Our study aims to discover the relation between oxygen delivery and hemodynamics during cardiopulmonary bypass.
ABG parameters:
Includes venous oxygen content (Cvo2), Arterial oxygen content (Cao2), hemoglobin (Hb g/dl), Mixed venous oxygen saturation (Svo2) and venous oxygen content (Cvo2).
Applying cardiopulmonary bypass:
Acid–base control occurred after the regimen of alpha-stat. 1000-ml Plasmalyte solution as well as 150-ml Mannitol were used to prime the CPB circuit. Erythrocytes’ transfusion per CPB was studied at hematocrit <20%, combined with hypovolemia.
Statistical analysis for this study was done with the help of Kolmogorov-Smirnov, Shapiro- Wilk tests.
During the cooling phase (mean temperature of 32.9615OC) and hypothermic phase (mean temperature of 30.5115 OC) the cardiopulmonary bypass blood flow required was an average flow (mean of 2.9 l/min/ m2) whereas in rewarming phase (mean temperature of 34.9846OC) CPB blood flow requires a greater rate of blood flow (mean of 3.1 l/min/m2).
For every 10OC of temperature decrease in biologic systems, chemical processes’ rate of metabolism reduces with a factor of around two (Q10 factor)
The improvement I hypothermic CPB methods inspired the creation of devices that use heat-exchange for extracorporeal circuits which may rapidly heat (or cool) blood. During cooling, a huge temperature gradient might exist among the heat–exchanger unit & patient blood;
Mean arterial pressure at cooling phase (mean temperature of 32.9615 OC) and hypothermic phase (mean temperature of 30.5115OC) maintained at mean value of 49.2308mmHg. during rewarming phase (mean temperature of 34.9846OC) mean arterial pressure is of mean (54.3462mmHg) (i.e) increase in the cardiopulmonary bypass blood flow increases the mean arterial pressure simultaneously. Therefore, there is a linear relation between cardiopulmonary bypass rate of blood flow and the mean arterial pressure in all three phases (cooling, hypothermia and rewarming phase)
Oxygen delivery (DO2) refers to oxygen’s transfer rate from the lungs to the microcirculation and oxygen consumption (VO2) refers to oxygen’s removal rate from the blood for use by the tissues.
Oxygen content of venous and arterial blood was calculated, while cardiac output was measured during cardiac output monitor during each phase.
During cooling phase DO2 (mean 31357.28) and VO2 (mean 4356.625)
And hypothermia DO2 (mean 32300.3204) and VO2 (mean 6904.912)
And during rewarming phase DO2 (mean 35742.7075) and VO2 (mean 8509.717)
This study shows that DO2 (oxygen delivery) increases to keep up with the VO2 (oxygen consumption).
During rewarming phase (mean temperature of 34.9846OC) increase in CPB blood flow rate (mean 3.1115) increases both MAP (mean 54.3462) and PAVR (mean 1068.7692). Whereas, compared with cooling phase (mean temperature 32.9615OC) and hypothermia (mean temperature of 30.5115OC) minimal the CPB flow rate lower the MAP and PAVR (i.e) cooling phase (mean MAP- 45.0769, PAVR-1000.4942) and hypothermia (mean MAP-49.2308, PAVR- 1006.2581)
In hypothermic phase increase in Hb level, eventually it reduces the need of Fio2 and sweep gas but both Fio2 and sweep gas requires double the time during cooling and rewarming phase.
A direct linear relation was observed between oxygen consumption (VO2) and MAP, CPB blood flow rate only while rewarming. No relation was detected during cooling and hypothermia.
CONCLUSIONS
On commencement of cardiopulmonary bypass, a transient drop in the systemic pressure of blood is observed due to sudden decrease in blood viscosity resulting from hemodilution by the CPB priming solutions. As CPB continues there is a gradual increase in perfusion pressure due to increasing systemic vascular resistance.
Solubility of gases increases with decrease in patient temperature. The process of rewarming must be controlled to avoid overheating of blood, which may lead to microbubble formation due to reduced solubility of gases in blood as temperature increases, denaturing of proteins, cerebral injury.
Higher blood flow rate than the required can cause blood cell damage, impede the surgery by flooding the operative field, cause an excessive rise in central venous pressure.
References To study about the relation between oxygen delivery and hemodynamics during cardiopulmonary bypass
- Gravlee GP, Davis RF, Kurusz M, Utley JR, editors. Historical Development of Cardiopulmonary Bypass: Cardiopulmonary Bypass Principles and Practice. 2nd ed. Philadelphia: Lippincott Williams & Wilkins; 2000; 5.
- Cohn LH (May 2003). “Fifty years of open-heart surgery”. Circulation. 107 (17): 2168
- “John Kirklin Cardiac Surgery Pioneer Dead at Age 86.” (April 23, 2004) University of Alabama at Birmingham. press release
- Man survives 16 days without a heart united Press International. April 3, 2008
- http://www.thefreedictionary.com/arterial+blood
- “Arteriovenous oxygen difference”. Sports Medicine, Sports Science and Kinesiology. Archived from the original on 12 June 2011. Retrieved 30 April 2011.
- Kenneth D. McClatchey (2002). Clinical Laboratory Medicine. Philadelphia: Lippincott Williams & Wilkins. p. 370.
- “Understanding Pulse Oximetry: SpO2 Concepts”. Philips Medical Systems. Retrieved 19 August 2016.
- Christina T. mora( hypothermia,cardiac surgery and cardiopulmonary bypass ) Willis H Williams, Hakobg. Davtyan and milada Drazanova chapter 3, page number 40
- Gravlee GP, Davis RF, Kurusz M, Utley JR; 9:155
- Rees K, Beranek-Stanley M, Burke M, Ebrahim S. Hypothermia to reduce neurological damage following coronary artery bypass surgery. Cochrane Database Syst Rev. 2001;(Issue 1) Art. No.:CD002138.
- Grigore AM, Grocott HP, Mathew JP, Phillips-Bute B, Stanley TO, Butler A, et al. The rewarming rate and increased peak temperature alter neurocognitive outcome after cardiac surgery. Anesth Analg. 2002; 94: 4–10.
- Grocott HP, Mackensen GB, Grigore AM, Mathew J, Reves JG, Phillips-Bute B, et al. Postoperative hyperthermia is associated with cognitive dysfunction after coronary artery bypass graft surgery. Stroke. 2002; 33: 537–41.
- Thong WY, Strickler AG, Li S, Stewart EE, Collier CL, Vaughn WK, et al. Hyperthermia in the forty- eight hours after cardiopulmonary bypass. Anesth Analg. 2002; 95: 1489–95.
- Kirklin JW, Barratt-Boyes BG. Hypothermia, circulatory arrest, and cardiopulmonary bypass. In: Kirklin JW, Barratt-Boyes BG, eds. Cardiac surgery, 2nd ed. New York: Churchill Livingstone, 1993:61–127.
- Hickey RF, Hoar PF. Whole body oxygen consumption during low-flow hypothermic cardiopulmonary bypass J Thorac Cardiovasc Surg 1983;86:903–6
- Shapiro H, Stoner EK. Body temperature and oxygen uptake in man. Ann Phys Med 1966;8:250–5.
- Harris EA, Seelye ER, Squire AW. Oxygen consumption during cardiopulmonary bypass with moderate hypothermia in man. Brit J Anaesth 1971; 43: 1113–20.
- Fox LS, Blackstone EH, Kirklin JW, Stewart RW, Samuelson PN. Relationship of whole body oxygen consumption to perfusion flow rate during hypothermic cardiopulmonary bypass. J Thorac Cardiovasc Surg 1982; 83: 239– 48.
- Baraka A. The effect of perfusion flow on oxidative metabolism during cardiopulmonary bypass. Anesth Analg 1993; 76: 1191–4.
- Alston RP, Singh M, McLaren AD. Systemic oxygen uptake during hypothermic cardiopulmonary bypass. Effect of flow rate, flow character, and arterial pH. J Thorac Cardiovasc Surg 1989; 98: 757– 68.
- Lazenby WD, Ko W, Zelano JA, et al. Effect of temperature and flow rate on regional blood flow and metabolism during cardiopulmonary bypass. Ann Thorac Surg 1992; 53: 957– 64.
- Osipov VP, Khodas MJ, Dementjeva II, Pjatnitskaja GK. Arterial pressure: its role in perfusion and as a criterion of extracorporeal circulation adequacy. Artif Organs 1982; 6: 295–8.
