Tools for visualization of nonlinear stories in software development models

Author: Kovalev M.A., Chernodub V.A., Popova I.E., Cubarkov D.A.
Journal: Международный журнал гуманитарных и естественных наук @intjournal
Section: Технические науки
Article in issue: 7 (22), 2018.
Free access
The principle of nonlinearity is the most spread principle of designing and developing of IT project nowadays. It is recommended to use the cases of visualization non-linear stories at the models of development for the rise of efficiency of this method. The article considers the benefits of using these cases against traditional methods. Moreover, the article contains instruments for the rise of efficiency of development and further analysis of the labor activity.
Tools, nonlinearity, non-linear stories, development, it project, visualization
Short address: https://sciup.org/170190435
IDR: 170190435
Инструменты для визуализации нелинейных историй в моделях развития программного обеспечения
В настоящее время принцип нелинейности является наиболее распространенным принципом проектирования и разработки IT проекта. Для увеличения эффективности применения данного подхода рекомендуется использовать средства визуализации нелинейных историй в моделях разработки программного обеспечения. В статье рассматриваются преимущества использования таких средств перед традиционным методом ведения проектов, а также приводятся конкретные инструменты, при применении которых любой проект может увеличить эффективность разработки и дальнейшего анализа трудовой деятельности.
Text of the scientific article Tools for visualization of nonlinear stories in software development models
When the first program development projects had begun to appear, it become clear that people who is actually managing the projects doesn't know how to competently manage it. That’s why first projects were carrying out in a linear way. A major disadvantage of such model is waste of time, every participant forced to wait for end of work of his teammates. So, there is a question “How it is possible to get the most effective method of work distribution?” H. Richard Priesmeyer is one of those who first described non-linear model of management. Hereafter most of project managers have become to use this model for the running an organization of project with an eye to increase productivity and time efficiency.
The main principle of the non-linearity model is the division of the development process into independent tasks and their distribution among the team of specialists. Thus, the non-linear model allows workers to perform their tasks simultaneously having the least dependence on other teammates. Non-linear management is the most progressive and far-reaching model today.
Using non-linear models provides a lot of opportunities to solve big tasks, workers deal with. For example, if company has a big project, it should be split between all workers, but waiting for every worker is ineffective. Non-linear model provides splitting task into several small parts and manage timings for preforming it. This concept of work applies to deal with hard projects many times faster, than linear concept. But it works only for projects which difficulty don’t exceed concrete value. In a row with big projects there are some small projects, where linear model is more effective, than non-linear. Graph of comparing of efficiency of these methods for projects with different difficulty is submitted to Fig 1.
Comparing of efficiency of non-linear and linear models
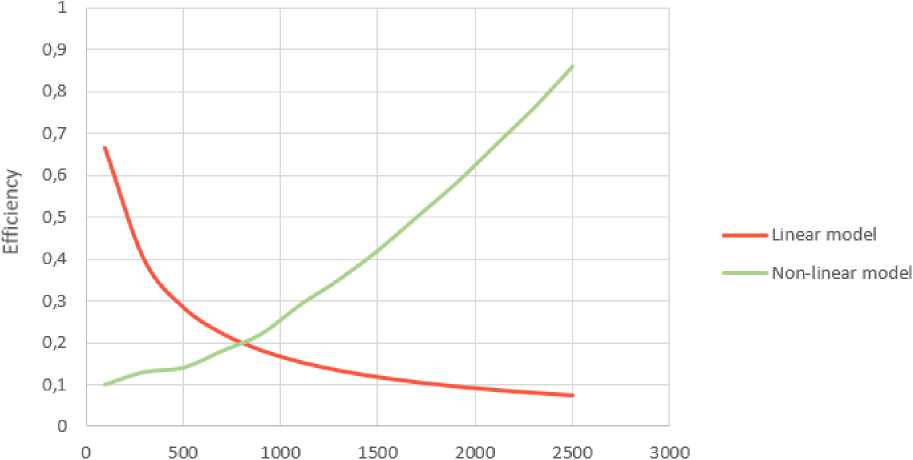
LOC (lines of code)
Figure 1. Comparing of efficiency depend on lines of code (difficulty)
In this case difficulty of project measures in lines of code (LOC). This is the middle mark of comparing of projects according to Function point metrics. Efficiency of performing measures in “frequency” – constant divided on time spent on task. Depends on practical research, non-linear model is more effective than linear model in a big part of cases.
Visualization process of non-linear development was depicted on paper initially and all stages of development were displayed on it with tables and diagrams drawn manually and then this information was announced on scheduled board meeting. But nowadays, due to computers, there are alternative methods for organization of project activity - services which visualize the project life cycle [1-5]. These services make it possible to increase efficiency, do the deep analyze of all the passed stages in the project and, eventually, reduce the time spent on software development substantially. Further, thanks to analyze, defects in the design of current project have become apparent and it is possible to eliminate them [6-7].
The most of modern software products for project management have a lot of advantages to use it in way of non-linear pro- ject handling. For example, user can export the plan into needful format or publish it on internet resource which is convenient for other party members. Utilities open the possibility to divide a project into several parts and allocate the responsibilities among participants without any difficulties. Also, project manager can view employment statistic of his subordinates anytime, so he has got all the advantages for productive organize of work process.
Nowadays there are a lot of tools which provide the opportunity to use non-linear model through the process of development and make an analysis of the completed tasks. So, there are a possibility to see potential non-compliances to the development plan or some of deficiencies in designing, maintaining of software in the further retrospective analysis. Thus, such means of project handling allow manager to understand his omissions and prevent them.
Modern visualization tools have userfriendly interface. Some stages may be highlighted for convenient orientation. Also, user can build tables, schedules, diagrams, etc. So, these services are useful for all types of companies, no matter if this a small development company or an international corporation.
The most of services are created on cross platform technologies so they might be using on the different operating systems. These services allow to create the bar charts using the Gantt method [8]. Also, there are functions for download and save files from FTP server, so the document can be viewed by the several users at the same time.
Overwhelming majority of projects uses a performance monitoring of every project participant because it increases the quality control of the team and project substantially [8-10]. Through these services a manager can tracking the employment of participants and execution speed of plan, so these allows to supervisor calculate the scope of work for every worker.
There are many examples of visualization tools – “Gantt Project”, “Project Libre”, “OpenProj” etc. They have nearly identical functional which is base for project management. But for the commercial project you would be better use “Microsoft Project”. Unlike other tools it is chargeable and has advanced features. Intel, Amazon and more than 20 billion companies are use “Microsoft Project” in their work.
Thus, it’s very helpful to use such tools in work with business or educational projects which have non-linear structure of development [11-12]. Using these tools will increase speed of development of any project because of effectively planning and reducing the number of weaknesses.
References Tools for visualization of nonlinear stories in software development models
- Evdokimov I.V. (2006) Matematicheskoe i programmnoe obespechenie identifikacii nelinejnyh dinamicheskih ob"ektov pri ispol'zovanii summy garmonicheskih signalov [Software for identification of nonlinear dynamical objects using sum of harmonic signals]. Bratskiy gosudarstvenniy universitet. - Bratsk, 2006. - p. 135.
- Evdokimov I.V. Kadrovoe obespechenie vnedreniya SCADA-sistem na predpriyatiyah [Staffing for the implementation of SCADA systems in enterprises]. Trudy Bratskogo gosudarstvennogo universiteta. Part: EHkonomika i upravlenie. 2005. T.1. pp. 116-119.
- Evdokimov I.V. Aspekty vnedreniya informacionnyh tekhnologij na predpriyatiyah g. Bratska [Aspects of implementing information technologies in enterprises of Bratsk]. Trudy Bratskogo gosudarstvennogo universiteta. Part: EHkonomika i upravlenie. 2006. T.1. pp. 144-148.
- Evdokimov I.V. Adaptaciya standartov programmnyh sredstv k proektam v oblasti informacionnyh tekhnologij [Adaptation of software standards to projects in the field of information technology]. Trudy Bratskogo gosudarstvennogo universiteta. Part: EHkonomika i upravlenie. 2010. T.2. pp. 97-101.
- Evdokimov I.V. Metodika issledovaniya sistem upravleniya predpriyatij dlya celej informatizacii [Methodology of research of enterprise management systems for informatization purposes]. Trudy Bratskogo gosudarstvennogo universiteta. Part: EHkonomika i upravlenie. 2007. T.1. pp. 248-288.
