Tourism development index of Russian regions

Author: Ovcharov Anton O., Kabirov Ildar S.
Journal: Сервис в России и за рубежом @service-rusjournal
Section: Актуальные вопросы государственного, муниципального и корпоративного управления в сфере услуг
Article in issue: 2 (111), 2024.
Free access
The purpose of the study is to develop an index that allows assessing the dynamics and uneven development of regional tourism. Tourism is influenced by various factors, the consideration of which requires quantitative assessments. In the article, such estimates were obtained through the construction and testing of the author’s generalizing indicator - the tourism development index of Russian regions. A brief review of modern research in the field of using the index method in analyzing the competitiveness of the tourism industry in different countries and the influence of climatic conditions on it is made. The practical part of the work is based on an extensive empirical base. For 2013-2022 statistical information reflecting the dynamics of regional tourism in the Russian Federation was collected. On this basis, groups of statistical indicators were formed that were used to construct the index. The methodology for its calculation consisted of standardizing the initial indicators measuring various aspects of tourism development and their subsequent aggregation into a single general indicator. The results of the author's index calculations in the context of federal districts and subjects of the Russian Federation allowed us to conclude that the distribution of tourism resources and infrastructure between Russian regions is uneven. Differences in index estimates for leading regions and outsider regions indicate a high concentration of tourist activity only in a limited circle of Russian regions. In addition, Russian regions were ranked according to the level of tourism development based on the calculated values of the author's index. It is concluded that the resulting rating is similar to the national tourism rating, but differs significantly from the sustainability of tourism and hospitality industry development ranking.
Index method, regional tourism, statistical indicators, rating
Short address: https://sciup.org/140305410
IDR: 140305410 | UDC: 338.48 | DOI: 10.5281/zenodo.12605923
Индекс туристского развития российских регионов
Цель исследования заключается в разработке индекса, позволяющего оценивать динамику и неравномерность развития регионального туризма. На туризм оказывают влияние различные факторы, учёт которых требует количественных оценок. В статье такие оценки получены благодаря построению и апробации авторского обобщающего показателя - индекса туристского развития российских регионов. Сделан краткий обзор современных исследований в области использования индексного метода при анализе конкурентоспособности туристской индустрии разных стран и влияния на нее климатических условий. Практическая часть работы основана на обширной эмпирической базе. За 2013-2022 гг. собрана статистическая информация, отражающая динамику регионального туризма в РФ. На этой основе сформированы группы статистических показателей, которые использовались для конструирования индекса. Методология его расчёта заключалась в нормировании исходных показателей, измеряющих различные аспекты развития туризма, и их последующем агрегировании в единый обобщающий показатель. Результаты расчётов авторского индекса в разрезе федеральных округов и субъектов РФ позволили сделать вывод о неравномерности распределения туристских ресурсов и инфраструктуры между российскими регионами. Различия в оценках индекса для регионов-лидеров и регионов-аутсайдеров свидетельствуют о высокой концентрации туристской активности лишь в ограниченном кругу российских регионов. Кроме того, на базе расчётных значений авторского индекса осуществлено ранжирование российских регионов по уровню развития туризма. Сделан вывод, что полученный рейтинг схож с национальным туристическим рейтингом, но существенно отличается от рэнкинга устойчивости развития туризма и индустрии гостеприимства.
Text of the scientific article Tourism development index of Russian regions
To view a copy of this license, visit
Modern tourism is a complex economic phenomenon, which is a system of interconnected elements (producers and consumers of tourism products, infrastructure facilities, natural resources, etc.). Tourists and the tourism industry are influenced by various factors, such as climate, economic development level of the territory, government policy and many others. Taking into account all possible factors is reflected in quantitative assessments, which can be presented in the form of both individual (particular) and general indicators (indices).
Statistical indicators always characterize the state, scale and dynamics of a tourist object, process or phenomenon. Based on them, it is possible to monitor a particular destination, identify problems and trends, and develop support measures. The set of such indicators may vary depending on the specific tasks facing theorists or practitioners. For example, we used special crisis indicators when analyzing the impact of instability factors on the tourism market [12]. These include such as an oversupply of available hotel rooms in the absence of adequate demand, the scale of disruptions in tourism services in major markets, the volume of early bookings for cruise ships at destination ports, etc.
In our opinion, a very useful quantitative tool that allows you to see a holistic picture of any socio-economic phenomenon, including tourism, is the index method. The methodology for developing indices is based on the selection of individual indicators characterizing a specific phenomenon, object or process, followed by combining these indicators into groups and subgroups. For each group, partial indices are first calculated, and then the final index. There are general principles and methods for constructing composite indexes [11]. The index method is based on aggregation techniques where the aggregation is carried out by extracting the main component using cluster analysis or averaging methods.
The index method can also be used in tourism research. However, it should be noted that in such studies sometimes the concept of “index” is not interpreted in the classical sense, i.e. not as a general indicator, but as a particular indicator. For example, there are so-called “infrastructure tourist indices” (Defert index, Schneider index, etc.) [10]. In statistical terms, they refer to relative intensity values, and not to indices. Thus, the Defert index represents the number of persons accommodated in collective accommodation facilities (CAF) per 1 km2 of territory. This indicator in some sense characterizes the “density of placement”, i.e. it quantifies a particular phenomenon associated with tourism. The index, in its meaning, should be a summary indicator that aggregates individual variables into a single whole.
Analogues of the TTCI may be calculated for individual countries or regions. In particular, this was done in relation to Spain [13], Cubes [6], Asia-Pacific region [1]. At the same time, some works criticize certain aspects of TTCI [2; 3]. The possibility of information duplication on tourism development and the imperfection of the index constructing methodology are noted. A solution to this problem is to use coefficients of determination as weights for particular indicators [4]. Another solution is to completely abandon the classical methodology and develop an alternative index. Thus, for a large number of countries, based on data over a long period of time, an index was constructed using a more complex method of principal components, and separately for inbound and outbound tourism [5].
It should be noted that a very popular area of research in tourism is the assessment, using -----------------------------------------1 137
the climatic conditions indices of various territories from the point of view of their suitability for tourism activities. For this purpose, various variations of tourist climate indices are being developed. They are actively used to analyze the current climatic attractiveness and future weather changes in relation to tourist areas in a variety of regions. For example, using the Camping Climate Index, the impact of weather changes on the occupancy of campsites is studied and, on this basis, optimal conditions are created for their seasonal occupancy [9].
In general, there is significant groundwork regarding the development and testing of various tourism indices. However, a small number of such indices are used in studies of the Russian tourism industry. Therefore, in the practical part of this article, we propose our own version of the tourism index – the tourism development index of Russian regions ( ITD ). We will demonstrate the empirical basis that was used to construct this index and the methodology for its construction. In addition, we will present the calculation results of our index in the context of Russian federal districts and regions. Finally, we will rank Russian regions by ITD level and compare the resulting rating with other national ratings of tourism development.
Data and methodology
To conduct the study, we compiled a database of indicators from the Russian Federal State Statistics Service (FSSS), the Ministry of Natural Resources of the Russian Federation and the Ministry of Emergency Situations of the Russian Federation, reflecting the dynamics of regional tourism in the Russian Federation from different angles. The sample included regions included in all federal districts. The period 2013-2022 was considered for calculations and subsequent analysis. As a result, it was possible to generate a data array of several thousand observations that illustrate the development trends of Russian regional tourism.
All FSSS’s data were divided into 6 groups of indicators directly or indirectly related to tou- rism. Each group was assigned its own weight – its value depended on how closely the group’s indicators were related to tourism. At the same time, the closeness of the connection was assessed based on the structure of the collective group “Tourism”, which has been used in our country for several years. For example, the group “Tourism organizers activities” has a high share, since most indicators characterize the types of activities (in particular, vouchers sales to tourists) included in this group. The “Use of Natural Resources” group has a low share – its indicators, such as, for example, the area of specially protected territories or environmental protection costs, are undoubtedly significant for tourism development, but they are not included in this group. We also note that in order to ensure statistical data comparability, indicators for which FSSS did not have information for any period were not considered. In other words, the requirement for complete information on all selected indicators and in the context of all selected regions had to be complied.
Table 1 shows the groups of indicators on the basis of which ITD is constructed, with the indicators general description. We did not decipher in detail the content of each indicator. We only note that the same approach was used for all – each indicator represented the specific weight (relative value of the structure - Xd ) of any direct or indirect indicator of tourism corresponding to a specific region, in the general (total) value of this indicator throughout Russia. For example, one of these indicators was the specific weight or share of persons accommodated in the CAF, located in a certain constituent subject of the Russian Federation, in the total number of persons who used the services of all Russian accommodation facilities. Another example is when one of the preservation indicators of natural tourism resources was calculated. It represented the expenditures share of a constituent subject of the Russian Federation on environmental protection in the total expenditures made for these purposes throughout the entire territory of Russia.
СЕТЕВОЙ
НАУЧНЫЙ
ЖУРНАЛ
Table 1 – Sample of indicators for constructing ITD
|
Group name |
Indicators description |
Indicators number |
Group share |
|
Tourism organizers activities |
Data on the number of companies engaged in tour operator and travel agency activities, as well as on the tours sale around the country to Russian citizens and foreigners |
5 |
0.3 |
|
CAF activities |
A comprehensive description of the CAF activities: number, room fund, accommodated persons, costs and income, etc. |
19 |
0.2 |
|
Transport and roads |
Data on passenger transport (composition and passenger turnover by mode of transport), density of railway tracks and paved roads, number of petrol stations |
8 |
0.15 |
|
Paid services in tourism |
The structure of paid services to the population provided by travel agencies, collective accommodation facilities, and cultural institutions; catering turnover |
6 |
0.15 |
|
Natural resources use |
Data on specially protected natural areas, environmental expenditures (amounts and indices of physical volume), freshwater use, share of neutralized pollutants |
7 |
0.1 |
|
Tourism safety |
Frequency of emergency situations, number of road accidents and persons killed and injured in road accidents, crime data, availability of doctors |
9 |
0.1 |
A formal description of any regional tourism development indicator used in subsequent calculations of our index is:
Xd i
x i n , ∑ x i i = 1
where х i is a direct or indirect indicator characterizing the tourism development in a particular region i , n is the number of regions.
The methodology for calculating ITD is based on combining interrelated indicators that measure various aspects of tourism development in the region into a single indicator. Such aggregation in practice is often carried out using factor analysis methods, in particular, using the principal component method. This method is actively used in constructing economic digitalization indices (see, for example, [8]). However, in our study we use a simpler method. Initially, normalization was carried out for each variable - translation of individual indicator values X ? into the values of a new indicator Xt , ranging from 0 (minimum level of tourism development for the region's sample) to 1 (maximum level). For this, the following formula was used:
X d - minX d X = ii .
maxX - minX ii
Normalized variables Xt were used to calculate partial regional development indices / ^ for each of our groups. The significance of an individual variable within a group was assumed to be equal. Therefore, equal shares with a value of 1 were applied, and then averaging was performed. At the same time, the significance of the groups, as already mentioned, was different – in this case, the shares α indicated in Table 1 were used. Partial indices were compiled into an integral index of tourism development ITD through the method of calculating the geometric mean, i.e. according to the formula:
ITD = k α I ⋅ α I ⋅ ... ⋅ α I , 1 X 12 X 2 k Xk , where k is the number of groups (in our case k = 6).
The choice of the method is due not only to its simplicity, but also it is more often used for relative indicators - in our case, transformed and normalized values of tourism indicators. In addition, with some degree of convention, we can say that, using the geometric average method, we used Fisher’s approach, that is well known in statistics, to construct an “ideal” index formula.
Results
Anticipating the display of calculation results ITD , it should be mentioned that in recent years Russian tourism has been affected by two shocks. The first is the impact of the COVID-19 pandemic, which, on the one hand, limited international tourist travel for some time, and on the other hand, acted as an incentive to intensify internal tourism in Russian regions and necessitated the need to solve many problems in this area. The second shock is the tightening of economic sanctions as a result of the outbreak of an armed conflict between Russia and Ukraine. Despite the different nature of this shock, the consequences for the tourism sector are similar to the consequences of the pandemic - today there is a limited opportunity for Russian citizens to travel abroad and wide potential for regional tourism development.
Thus, an unusual situation has now arisen when the unfavorable events of recent years have become an impetus for the active internal tourism development, which can be concentrated not only in large cities, but also in small regions. At the same time, the key problem is the uneven distribution of tourism infrastructure in the subjects of the Russian Federation and weak demand for tourism services in certain regions. This problem (in general, it can be described as disproportionality of tourism development in a regional context) is constantly discussed in various aspects in the works of many Russian scientists. For example, it was recorded in relation to the Vologda region [7]. The author concluded that the region’s tourism resources are poorly in demand by tourists; many infrastructure indicators and tourist activity indicators have lower values than in other regions.
Our simple statistical analysis also confirms these findings. We demonstrate it using a simple example in relation to only one federal district (Volga Federal District). Table 2 shows statistical information for two neighboring republics (Tatarstan and Mari El). We limited ourselves to only some indicators from the second group (see Table 1) related to the CAF activities in 2020-2022.
Table 2 – Indicators of the activities of the CAF in two regions in 2020-2022
|
Index |
Tatarstan |
Mari El |
||||
|
2020 |
2021 |
2022 |
2020 |
2021 |
2022 |
|
|
Number, units |
539 |
496 |
582 |
85 |
82 |
89 |
|
Room fund, units |
21829 |
22241 |
25323 |
2988 |
2932 |
3125 |
|
Placed persons, people |
2096003 |
2258117 |
2335071 |
126930 |
137063 |
141855 |
|
Income, thousand rubles |
7989219 |
13116260 |
17638877 |
349288 |
738033 |
1041135 |
|
Costs, thousand rubles |
9243449 |
10844113 |
11648501 |
272537 |
611378 |
838848 |
|
Employees number, people |
10322 |
11320 |
11843 |
946 |
1125 |
1214 |
This table shows a significant gap in the numerical values of any indicator. At the same time, we are aware that certain incomparability of data should be taken into account due to the different characteristics of the regions. Mari El is smaller than Tatarstan both in area and in population. Regions also differ in socio-economic indicators, such as gross regional product, standard of living, volume of industrial production, etc. However, the differences in such indicators are not as significant as in tourism indicators. Thus, our calculations based on FSSS data indicate that in
Tatarstan, compared to Mari El in 2022, there was an increase in population by 5.6 times, territorial area by 2.9 times, agricultural products by 5.5 times, consumer spending per capita – 1.8 times, etc. However, the gaps in CAF indicators and other tourism indicators are often larger. From Table 2 it follows, for example, that the CAF room fund of Tatarstan in 2022 exceeded the CAF room fund of Mari El by 8.1 times, and the CAF income was almost by 17 times.
The disproportionality problem in regional tourism development needs to be addressed, but first it should be clearly stated. And needs to be done not only using simple quantitative calculations for individual indicators, but also using more complex methods. Our index is obtained based on one of these methods. ITD, as already mentioned, is the result of aggregating private tourism indicators using a special statistical method. If we consider ITD simultaneously and separately, i.e. for any particular region at a particular point in time, then it would have no practical value. However, analysis of ITD changes and comparative assessments of our index values in the context of federal districts or subjects of the Russian Federation will make it possible to record the degree and dynamics of uneven regional tourism. In addition, this index can be used as a criterion for constructing a rating of Russian regions according to the level of the tourism industry development.
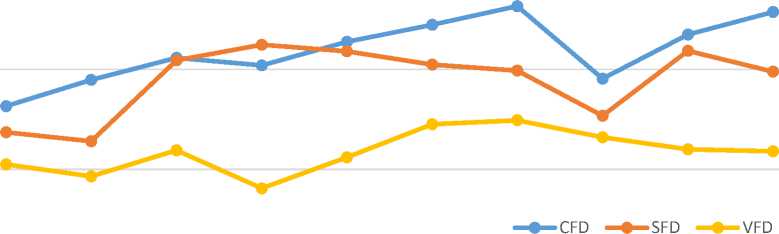
We obtained the results of ITD calculations based on the data and methodology described above at two levels. The first level is the level of federal districts. Fig. 1 shows the top three districts by the value of our index. The second level is the subjects of the Russian Federation level. Table 3 shows the ITD values for each federal district for the leading region and the outsider region.
0,9
0,8
Q H
0,7
2013 2014 2015 2016 2017 2018 2019 2020 2021 2022
Fig. 1 – ITD dynamics for three federal districts
0,6
Table 3 – ITD dynamics for regions of the Russian Federation
|
Federal District |
The subject of the Russian Federation |
2013 |
2014 |
2015 |
2016 |
2017 |
2018 |
2019 |
2020 |
2021 |
2022 |
|
Central |
Moscow |
0.731 |
0.760 |
0.728 |
0.789 |
0.812 |
0.846 |
0.887 |
0.788 |
0.812 |
0.849 |
|
Oryol Region |
0.144 |
0.182 |
0.190 |
0.182 |
0.143 |
0.150 |
0.173 |
0.179 |
0.172 |
0.203 |
|
|
Northwestern |
Saint Petersburg |
0.711 |
0.745 |
0.724 |
0.818 |
0.803 |
0.822 |
0.812 |
0.771 |
0.784 |
0.789 |
|
Komi Rep. |
0.107 |
0.096 |
0.116 |
0.105 |
0.090 |
0.110 |
0.102 |
0.118 |
0.134 |
0.142 |
|
|
Southern |
Krasnodar region |
0.707 |
0.705 |
0.719 |
0.728 |
0.753 |
0.747 |
0.779 |
0.806 |
0.795 |
0.781 |
|
Rep. of Kalmykia |
0.095 |
0.094 |
0.097 |
0.086 |
0.082 |
0.098 |
0.103 |
0.101 |
0.116 |
0.108 |
|
|
North Caucasus |
Stavropol region |
0.659 |
0.638 |
0.627 |
0.631 |
0.733 |
0.764 |
0.768 |
0.758 |
0.751 |
0.701 |
|
Rep. of Ingushetia |
0.085 |
0.098 |
0.101 |
0.106 |
0.089 |
0.092 |
0.095 |
0.099 |
0.085 |
0.109 |
|
|
Volga |
Rep. of Tatarstan |
0.707 |
0.694 |
0.688 |
0.663 |
0.711 |
0.732 |
0.731 |
0.744 |
0.701 |
0.738 |
|
Rep. of Mordovia |
0.112 |
0.130 |
0.143 |
0.127 |
0.182 |
0.194 |
0.175 |
0.169 |
0.183 |
0.190 |
|
|
Ural |
Sverdlovsk region |
0.608 |
0.615 |
0.631 |
0.628 |
0.644 |
0.652 |
0.664 |
0.658 |
0.642 |
0.695 |
|
Kurgan region |
0.102 |
0.093 |
0.096 |
0.111 |
0.131 |
0.096 |
0.124 |
0.120 |
0.125 |
0.142 |
|
|
Siberian |
Altai region |
0.725 |
0.699 |
0.718 |
0.715 |
0.711 |
0.708 |
0.735 |
0.733 |
0.711 |
0.723 |
|
Tyva Rep. |
0.084 |
0.081 |
0.094 |
0.107 |
0.117 |
0.105 |
0.114 |
0.115 |
0.138 |
0.092 |
|
|
Far Eastern |
Primorsky Krai |
0.726 |
0.694 |
0.685 |
0.697 |
0.713 |
0.741 |
0.730 |
0.724 |
0.778 |
0.751 |
|
Chukotka Aut. Okrug |
0.031 |
0.040 |
0.085 |
0.109 |
0.106 |
0.094 |
0.071 |
0.101 |
0.082 |
0.078 |
Note: The Rep. of Crimea was not included in the sample, since FSSS began publishing statistical data for this region in 2015
Table 4 – Ratings of Russian regions by tourism development level
|
The subject of the Russian Federation |
Place in the ranking |
||
|
ITD |
NTR |
RSTD |
|
|
Moscow |
1 |
1 |
4 |
|
Saint Petersburg |
2 |
4 |
1 |
|
Moscow region |
3 |
3 |
22 |
|
Krasnodar region |
4 |
3 |
2 |
|
Primorsky Krai |
5 |
7 |
56 |
|
Rep. of Tatarstan |
6 |
10 |
3 |
|
Altai region |
7 |
8 |
53 |
|
Stavropol region |
8 |
6 |
20 |
|
Sverdlovsk region |
9 |
16 |
6 |
|
Tyumen region |
10 |
15 |
5 |
|
Nizhny Novgorod Region |
11 |
13 |
25 |
|
Rep. of Bashkortostan |
12 |
14 |
33 |
|
Leningrad region |
13 |
18 |
33 |
|
Perm region |
14 |
22 |
12 |
|
Krasnoyarsk region |
15 |
21 |
26 |
|
Samara Region |
16 |
9 |
17 |
|
Rostov region |
17 |
19 |
21 |
|
Novosibirsk region |
18 |
11 |
30 |
|
Kaliningrad region |
19 |
17 |
6 |
|
Chelyabinsk region |
20 |
12 |
78 |
The results confirm the conclusions of many scientists about the unevenness of regional tourism. Today in the Russian Federation there has been a kind of “pool” of regions where the main tourist infrastructure is concentrated and there is a high demand for tourist services (Moscow, St. Petersburg, the Republic of Tatarstan, Krasnodar region, etc.). Most Russian regions have high barriers to the tourism industry entering a sustainable growth trajectory.
The final result of the study was a rating of Russian regions according to the tourism development level, based on the decrease in the estimated ITD for 2022 ( ITD rating). In Table 4 we showed our TOP 20 regions, and we did this in comparison with two other ratings. There are the National Tourism Rating ( NTR ) and the Ranking of
Sustainable Tourism Development and Hospitality Industry in the Subjects of the Russian Federation ( RSTD ).
From this table it follows that our rating is closer to NTR than to RSTD. This can be explained by the specific empirical basis of the latter. For our calculations, we took exclusively objective statistical indicators available in open databases. In addition to them, the Ranking used indicators that were not directly observable, many of which were associated with subjective assessments of experts or regional authorities.
Conclusion
This paper demonstrates the possibility of using the index method, which has proven itself in many socio-economic studies, in relation to the analysis of problems in the regional tourism development in the Russian Federation. Some attention is paid to the tourism indices development, in particular, they are used in studying the competitiveness of countries and regions and in reflecting the climatic conditions influence on the functioning of tourist areas. However, this method has not received widespread use in Russian theory and practice of tourism research.
The article presents a relatively simple but reliable methodology for constructing a tourism development index of Russian regions. The peculiarity of the methodology is that it uses public statistical reporting and does not require expert assessments or special surveys. Aggregation of individual indicators into a composite index made it possible to obtain general assessments characterizing the dynamics of the Russian tourism development in the regional aspect. Calculations based on the index demonstrated significant gaps in tourism infrastructure and tourism resources between leading regions and outsider regions. This is one of the arguments in favor of the fact that many regions require increased efforts to put their tourism industries on a path of sustainable growth.
References Tourism development index of Russian regions
- Augustin, J.-L. P. M., & Liaw, S.-Y. (2017). Tourism competitiveness index of the Asia-Pacific region through consistency analysis. Asia Pacific Journal of Tourism Research, 22(12), 1295-1307. doi: 10.1080/10941665.2017.1391855.
- Croes, R., & Kubickova, M. (2013). From potential to ability to compete: Towards a performance based tourism competitiveness index. Journal of Destination Marketing and Management, 2(3), 146-154. doi: 10.1016/j.jdmm.2013.07.002.
- Cvelbar, L. K., Dwyer, L., Koman, M., & Mihalič, T. (2016). Drivers of destination competitiveness in tourism: A global investigation. Journal of Travel Research, 55(8), 1041-1050. doi: 10.1177/0047287515617299.
- Fernández, J. A. S., Azevedo, P. S., Martín, J. M. M., & Martín, J. A. R. (2020). Determinants of tourism destination competitiveness in the countries most visited by international tourists: Proposal of a synthetic index. Tourism Management Perspectives, 33, 100582. doi: 10.1016/j.tmp.2019.100582.
- Khan, S. A. R., Qianli, D., SongBo, W., Zaman, K., & Zhang, Y. (2017). Travel and tourism competitiveness index: The impact of air transportation, railways transportation, travel and transport services on international inbound and outbound tourism. Journal of Air Transport Management, 58, 125-134. doi: 10.1016/j.jairtraman.2016.10.006.
- Kubickova, M., & Lee, S. H. (2018). Cuba today: An overview of tourism competitiveness. Tourism Planning & Development, 15(3), 239-259. doi: 10.1080/21568316.2017.1410496.
- Leonidova, E. G. (2022). Prioritety i ugrozy razvitiya regionalnogo turizma [Priorities and threats to the development of regional tourism]. Regionologiya [Regionology], 30(3), 624-646. doi: 10.15507/2413-1407.120.030.202203.624-646. (In Russ.).
- Lucendo-Monedero, A. L., Ruiz-Rodríguez, F., & González-Relaño, R. (2019). Measuring the digital divide at regional level. A spatial analysis of the inequalities in digital development of households and individuals in Europe. Telematics and Informatics, 41, 197-217. doi: 10.1016/j.tele.2019.
- Ma, S., Craig, C. A., & Feng, S. (2020). The Camping Climate Index (CCI): The development, validation, and application of a camping-sector tourism climate index. Tourism Management, 80, 104105. doi: 10.1016/j.tourman.2020.104105.
- Morozov, M. A., & Morozova, N. S. (2021). Regionalnye osobennosti razvitiya turistskoj infrastruktury i ih vliyanie na turizm [Regional features of the development of tourist infrastructure and their influence on tourism]. Regionologiya [Regionology], 29(3), 588-610. doi: 10.15507/2413-1407.116.029.202103.588-610. (In Russ.).
- OECD/European Union/EC-JRC. (2008). Handbook on constructing composite indicators: Methodology and user guide. Paris: OECD Publishing. doi: 10.1787/9789264043466-en.
- Sausmarez, N. (2007). Crisis management, tourism and sustainability: The role of indicators. Journal of Sustainable Tourism, 15(6), 700-714. doi: 10.2167/jost653.0.
- Torres-Delgado, A., & Palomeque, F. (2018). The ISOST index: A tool for studying sustainable tourism. Journal of Destination Marketing & Management, 8, 281-289. doi: 10.1016/j.jdmm.2017.05.005.
