Towards an Intelligent Electricity Data Management

Author: Amadou Diabagaté, Yazid Hambally Yacouba, Jean-Marc Owo, Adama Coulibaly
Journal: International Journal of Education and Management Engineering @ijeme
Article in issue: 4 vol.14, 2024.
Free access
The large volume of electricity consumption data calls for the aggregation of this data. The implementation of aggregation methods is therefore a major concern to which an answer is given by presenting a case of aggregation of electricity consumption data using the jump process. A data set made it possible to carry out simulations and to present the results obtained for the daily, monthly and annual aggregations. The principle of using the jump process for the approval of these data is highlighted. This work is a concrete presentation of a simulation for the aggregation of electricity consumption data in a network of wireless sensors that can constitute a network of smart meters. The approach of this work consists in using aggregation methods to reduce the flow of data exchanges in wireless sensor networks. In fact, this work highlights several interesting properties that justify the choice of the jump process including flexibility, modeling of rare events, management of uncertainties adaptability to non-stationary data management of fluctuations in demand, consideration of volatility effects and scalability. Many significant impacts are expected, including improving network stability, optimizing resource management, reducing operational costs, integrating renewable energies, and data-driven decision-making. The jump process also presents limitations including modeling complexity, model calibration, computational complexity, interpretability of results, uncertainty management.
Simulation, Data Aggregation, Smart Metering, Electricity Consumption, Jump Process
Short address: https://sciup.org/15019320
IDR: 15019320 | DOI: 10.5815/ijeme.2024.04.04
Text of the scientific article Towards an Intelligent Electricity Data Management
Data aggregation from smart meters is an important issue in the management of voluminous electricity consumption data. The aggregation of electricity consumption data in smart grids is essential for the exchange of data and for the processing of this data in the context of reducing the cost of storage and the energy load necessary for the operation of a network of smart meters powered by batteries. Rohit Gupta and Krishna Teerth Chaturvedi [1] explain the important role of smart grids for managing electricity and data between suppliers and consumers. This publication also compares data processing methods.
Smart meter networks can in certain isolated areas be assimilated to wireless sensor networks which are very often small in size and which have a limited processing capacity with a power supply based on batteries that generally have low autonomy. This power supply constraint exposes these sensor networks to numerous failures. Also, data aggregation can contribute to improving the resilience to failures of these smart grids. Similarly, the needs for mitigating bandwidth, energy and throughput constraints suffer from the ability of wireless networks to adapt to the topologies of computer networks whose data traffic is both dynamic and unpredictable. Zhiyi Chen and al. [2] present a review of challenges, opportunities and applications relating to the use of smart meters as well as the contribution of these meters to smart networks. S. R. Selva Jeevitha [3] discusses the need for storage of power signals in smart power grids and proposes a method of compressing the high frequency signal and reconstructing the original signal using the Hilbert transform.
The objective of this work is to present aggregation methods that facilitate the processing of electricity data at different scales of analysis while improving battery life. Soham Dutta and al. [4] expose the need to continuously cope with the occurrence of unpredictable and dangerous outages in distribution networks using smart meters. Shampa Banik and al. [5] give an overview of the contribution of smart grids in anomaly detection. Such a smart meter data management requires the storage and aggregation of data at the level of some smart meters whose selection criteria in a building or district are not addressed in this work. The contribution of this system lies in the facilitation of the interpretation of the data and the implementation of a good use of energy.
2. Background Study
There is a plurality of data aggregation techniques that aim to address data processing in computer systems and networks. This section presents a state of the art of aggregation methods as well as the solutions provided by each of them. Data aggregation techniques are implemented for several reasons including :
2.1. Data compression
2.2. Performance of data collection
2.3. Improving network performance
2.4. Securing data exchanges
3. Problem
4. Analysis of Mathematical Methods Comparable to the Jump Process for Data Aggregation
Lulu Wen and al [6] present an exhaustive study of techniques and potential methods for compressing data warehouses from smart meters. To improve storage and communication capabilities, Lee J and al. [7] propose a compression model based on the choice of existing models to determine the model that improves the quality of the reconstruction based on the compression rate and the analysis of the variation over time of the spectral properties of the data.
In order to transfer data from smart meters to the control center; Sung Tien-Wen and al. [8] propose a data aggregation point (PAD) placement scheme and present the corresponding algorithms to reduce the number of PADs and limit the impact on the communication quality. Ramesh Rajagopalan and Pramod K. Varshney [9] focus on data aggregation problems in energy-limited sensor networks and propose different algorithms with the aim of collecting data in a time-efficient way. based on performance metrics such as lifetime, latency, and data accuracy. Geetika Dhand and S.S. Tyagi [10] explain the importance of data collection and compare different hierarchical clustering approaches. Mohamed Saleem Haja Nazmudeen and al. [11] propose an architecture for management of communications to facilitate collection, storage and processing of smart meter data. Jagdish Chandra Pandey and Mala Kalra [12] show the interest of data compression and encryption in smart networks to securely communicate large amounts of data while reducing memory consumption and processing time execution.
This publication [13] explores data aggregation algorithms based on network topology as well as possible tradeoffs within these algorithms. The work of Hassan Harb and al. [14] consist of a local aggregation of data at a sensor node for periodic classification based on clustering while allowing the head cluster to eliminate redundant datasets generated by neighboring nodes through the use of three methods of data aggregation methods. These methods are based respectively on the set similarity functions, the unidirectional Anova model with statistical tests and the distance functions. Karthikeyan Vaidyanathan and al. [15] present a simulation highlighting energy reductions and end-to-end data transmission delay. They also offer hybrid aggregation while allowing sensor nodes to switch between aggregation techniques depending on network load. Mohammad Ghiasi and al. [16] propose mathematical models and simulation with the aim of contributing to sustainable low-carbon energy development using Internet of Things (IoT), Internet of Energy technologies (IoE) and intelligent systems. The study carried out by Adrian Lang and al. [17] highlights the importance of the location of data aggregation points in improving profitability and quality of service in smart meter networks.
In the study [18], Abbasian Dehkordi and al. review data aggregation techniques and protocols with the aim of presenting new approaches while describing their advantages and disadvantages. The article [19] highlights the deployment of several IoT nodes in the field of security and the need to make a trade-off between energy consumption and reliability by eliminating data redundancy up to a certain threshold. Guguloth Ravi and al. [19] proposes a reliable data aggregation scheme (CRDA: cluster based reliable data aggregation) for energy saving and which is applied to a cluster of IoT sensors in charge of data collection and aggregation. The authors then implement a data aggregation algorithm that calculates the degree of confidence of each IoT sensor to determine the cluster head. A neural network (ROL-DNN: reformative optimal–learning-based deep neural network) is also used to calculate routes between IoT sensors to ensure the reliability of data transport. Ashutosh Kumar Singh and Jatinder Kumar [20] propose a secure and privacy-preserving model for data aggregation and classification in a fog and cloud architecture. They also present a multidimensional data aggregation system that preserves privacy through query processing based on identity and time management [21].
Energy is one of the greatest challenges and one of the main pillars of economic growth. Technological developments in the field of communication and data exchange constitute a real opportunity for the development of the electricity sector. Similarly, several factors point to the need to implement new strategies, including the disparity in the progress of electrification between rural and urban areas, the lack of financial means, the increase in demand, the isolation and remoteness of certain residential areas.
Dramé and Cheikh [22] show that solving electricity access problems in West Africa requires the deployment of smart grids with Côte d'Ivoire as a case study. Indeed, this study recommends the realization of electrical infrastructures suitable for the development of smart grids such as renewable energy technologies, communication by power line, pricing based on smart meters and prepayment using mobile phones and other computer equipment. Sebastian Sterl and al. [23] explain that the reliability of electricity supply depends on the complementary use of hydroelectricity, solar and wind energy contrary to the trend based on fossil fuels. S.M. Kadri and al. [24] highlight poverty and technological weakness as obstacles to electrification in West Africa and present an overview of current approaches for distributed electricity production. Osama Majeed and al. [25] provide an overview of smart grids and their functionalities while explaining the contribution of these technologies in the evolution and strengthening of the electricity distribution system. Young and Jacob R. [26] introduce smart grids and report on the status of implementation in developing countries. In addition, Fernando Antonanzas-Torres and al. [27] take stock of electricity research and exploitation facilities in West Africa and list the development challenges of mini-grids, particularly solar home systems.
The jump process method, also known as the Markov jump method or the Markov chain Monte Carlo method, is an approach used for data aggregation that is based on probabilistic and statistical principles. This method is often used in the context of estimating unknown parameters or Bayesian inference. There are several comparable mathematical methods that can be used for data aggregation or to solve similar problems. Some of these methods include:
4.1. Least squares method:
4.2. Method of moments
4.3. Likelihood maximization method
4.4. Resampling method
4.5. Monte Carlo method
5. Justification for Choosing The Jump Process
This method is used to minimize the sum of the squares of the differences between observations and the values predicted by a model. It is often used to fit models to data and is widely used in linear and nonlinear regression. These publications discuss this method or use it in various contexts, covering areas such as computing, sensor networks, energy, and many others. Guy H. Orcutt and al. [28] explore the use of least squares to aggregate data, proposing methods for estimating model parameters. J. D. Kalbfleisch and al. [29] study limitations of Least Squares method in data aggregation process and proposes efficient least squares based algorithms to overcome these limitations. G. BELIAKOV [30] examines the use of least squares to provide great flexbility when modeling non-linear functions, but may fail to be monotone.
This method consists of solving a system of equations based on the statistical moments of the observed data. It is often used to estimate the parameters of probability distributions. Publications on the method of moments for data aggregation provide an in-depth understanding for data aggregation in various contexts, ranging from sensor networks to economics and geostatistics. Andrei Kazakov A and al. [31] examine the use of the method of moments for a more complete description of particle coagulation, providing practical examples and computational techniques. Daniele L. Marchisio and al. [32] explores the application of the method of moments for modeling simultaneous aggregation and breakage, with emphasis on applications in a commercial computational fluid dynamics. Hossein Azari Soufiani and al. [33] propose a class of efficient Generalized Method-of-Moments for Rank Aggregation. This research examines the theoretical and practical aspects of data aggregation using the method of moments.
This method involves maximizing the likelihood function, which measures the probability of the observed data based on the model parameters. It is commonly used to estimate the parameters of probabilistic models. The publications examine perspectives on the likelihood maximization method, ranging from its theoretical foundations to its practical applications in different areas of statistics and modeling. George Casella and Roger L. Berger [34] publish a book on statistical inference, which includes detailed chapters on the likelihood maximization method and its application in various contexts. Maximum Likelihood Estimation in Small Samples is a publication of SHENTON S. H. [35] that explores the challenges and solutions to maximum likelihood estimation in small samples, offering practical advice for overcoming potential problems. Grigorios Papageorgiou and al. [36] cover through this publication, the statistical analysis of missing data, implementing maximum likelihood estimation methods to handle missing values effectively.
This method involves generating additional samples from existing data, often using techniques like bootstrapping or permutation. It is used to estimate sampling distributions and to assess the uncertainty of estimates. These publications on the resampling method for data aggregation or for the smart grid show the use of this method in different contexts, including data aggregation and time series analysis in the smart grid domain. S. N. Lahiri [37] explores resampling methods suitable for dependent data, with emphasis on their use in temporal and spatial modeling. Jens-Peter Kreiss and al. [38] describe how the bootstrap method can be extended to a wide range of dependent variables in discrete time. Yogendra P. Chaubey [39] examines resampling methods for adjusting p-values in multiple statistical testing, with applications in data aggregation and statistical inference.
This method involves using random samples to estimate unknown quantities. It is used in a variety of contexts, including estimating integrals, simulating physical or financial systems, and performing sensitivity analyses. These publications on the Monte Carlo method for data aggregation or smart grids offer a diverse range of perspectives on the use of the Monte Carlo method in different contexts, including data aggregation and risk analysis in smart grids. Huu Tue Huynh and al. [40] provides practical examples of the application of stochastic simulation, including Monte Carlo methods, in the field of finance. These techniques can also be applied to smart grid modeling. Don L. McLeish [41] explores the applications of Monte Carlo simulation in finance, but its principles can also be adapted for risk analysis and operations optimization in smart grids. Sophie Donnet [42] examines applications of the Monte Carlo method in the pharmaceutical industry, but also offers insights into its potential use in other other areas, including smart grids.
The jump process method has several advantages over other methods for data aggregation or intelligent management of electricity consumption. The jump process method can be adapted to a wide variety of scenarios and data types, making it a flexible method for data aggregation in energy systems [43,44]. This method is particularly useful for modeling and managing rare or extreme events, such as power consumption spikes or network incidents, which can be crucial for the stability and reliability of power networks [45,46,47,48]. The jump process method allows uncertainties and variations in data to be effectively taken into account, which is essential in a dynamic environment such as power grids [49,50]. This method can also be used to model non-stationary data, which is often the case in power grids due to variability in demand and renewable energy sources [51,52,53] in one hand and to model and manage fluctuations in electricity demand, which is crucial to optimize resource utilization and avoid network overloads [54,55] on another hand. The jump process method is useful for modeling volatility effects in data, which can be important for the efficient planning and operation of power networks [56] and can be scaled to handle power systems of different sizes and complexity, making it an adaptable solution to the needs of different types of power networks [57,58,59,60].
Using the jump process for data aggregation and intelligent management of electricity consumption is likely to have several significant impacts. By effectively modeling rare events and fluctuations in demand, the jump process method can help improve the stability and reliability of power grids, thereby reducing the risk of overloads and outages. By taking into account uncertainties and variations in data, this method can help optimize the use of available energy resources, enabling more efficient planning and operation of power networks. More efficient management of electricity consumption and energy resources can lead to operational cost savings for electricity suppliers and network operators, while maintaining quality of service for consumers. This method can facilitate the integration of intermittent renewable energy sources, such as solar and wind, by enabling more precise and adaptable management of electricity production and demand. In addition, by providing more accurate models and more reliable forecasts, the jump process method can support more informed and informed decision-making for network operators, energy managers and policymakers policies.
Regarding the potential for scalability and application in real-world scenarios, the jump process method is well suited to be implemented in dynamic and complex environments such as power grids. Its use can be extended to different types of power networks, whether urban distribution networks or large-scale transmission networks. Additionally, with its flexibility and ability to effectively model rare events and uncertainties, this method can be applied in a variety of real-world scenarios, including demand planning, dynamic electricity pricing, and the management of smart networks. Ultimately, the impact of using the jump process will depend on how it is implemented and integrated into existing energy systems, as well as collaboration between different stakeholders in the energy sector.
6. Limitations and Future Work
Although the jump process method has several advantages for data aggregation and intelligent management of electricity consumption, it also has limitations and areas for future work to consider. The jump process can be complex to model, particularly when applied to large-scale energy systems. Accurately modeling rare events and data jumps can require considerable effort and specialized expertise. The Jump process method may require detailed, high-resolution data to be effectively implemented, which can pose challenges in terms of data collection, processing, and storage [47]. In addition, calibration of jump process models can be tricky, particularly when available data is limited or unreliable. Robust calibration and parameter estimation techniques are necessary to obtain accurate results [61,62]. Simulation and optimization algorithms also based on jump process can be computationally intensive, which may require significant computing resources, especially for large-scale applications [63,64]. Jump process models can be difficult to interpret, especially for non-specialist users. Additional efforts may be needed to make model results more accessible and understandable to stakeholders [65]. Although the jump process method takes into account uncertainties in the data, it can still be limited by the uncertainty inherent in the models themselves [66]. Robust uncertainty management techniques are necessary to make reliable decisions in dynamic and uncertain environments [67]. Validation and verification of jump process models can be difficult, especially in the absence of historical data or reference scenarios [68]. Robust validation and verification methodologies are needed to assess model reliability and accuracy [69].
To overcome these limitations and explore new areas of research, several future works can be considered such as the development of more efficient and adaptable modeling techniques for jump processes, using innovative approaches such as machine learning and optimization. It is also the case of the integration of data from different sources and different resolutions to improve the accuracy of jump process models and their ability to capture spatial and temporal variations of energy phenomena. Exploring new applications and use cases for the jump process method in the field of intelligent electricity consumption management, including distribution network optimization, dynamic electricity pricing electricity and demand planning is necessary. In the same framework, improving techniques for calibration, validation and verification of jump process models, developing robust approaches to assess the reliability and precision of results.
7. Fundamental Principle of Data Aggregation Methods of Our Electricity System Using the Jump Process
In our publication [70], we have already laid the foundations of our data aggregation method using the jump process.
Data aggregations are modeled using the jump process as follows:
n: the number of data records
Xn : electricity consumption between Tn-i and Tn at time t
1A(t) = { n ~ i’ n [, 1 1 is a binary function that allows us to observe a change of state in the system
( 0 other-wise
M : the finite number of events after which the counting process ends
The electricity consumption of a smart meter at a time t is defined by :
Z t =E ^=i X n 1 [T n-i ,T n [ (t) (1)
The cumulative electricity consumption of a smart meter up to time t is :
Y
t
=X
^=i
X
n
1
T
,
Yt is a jump process, since the Xn values of the smart metering system are different.
Below is the summary table of electricity consumption data aggregations :
Table 1. Summary table of electricity consumption data aggregations
|
Total electricity consumption at time t |
Total electricity consumption up to time t |
||
|
sN = S L, z k (3) |
R n = S ?=1 Y t k (4) |
||
|
Time t |
Z tk = £ M=i X k 1 [TUT k [ (t) (5) |
Time t |
Y
t
k = E^
i
X
n
i
Tn! |
|
Zone i |
Z f (i) = X^ i X f (i) 1[T,UT,H(t) (7) |
Zone i |
Y
t
k(i)=^=
i
Xk(i)1
T
i
|
|
Usage j |
Z^') = SM(D 1[T^„T„^(t) (9) |
Usage j |
Y?W =^Xk(jY1
Ti |
|
Zone i and Usage j |
ZKiJ) = flbXlKiJ) 1 [T n^ [ (t) (11) |
Zone i and Usage j |
Y
t
k(JJ)
=^=i
X
k
(iJ)1
T
*
|
8. Simulation on Daily, Monthly and Annual Aggregations 8.1. Simulation test performance context
The simulation data used is electricity data from 370 customers in Portugal over the period 2011 to 2014 [71]. The dataset does not contain any missing values. The values are in kW in steps of 15 min. To convert the values to kWh, the values must be divided by 4.
Each column represents a customer. Some customers were created after 2011. In these cases, the consumption was considered zero.
All time periods refer to Portuguese time. However all days have 96 measures (24*15). Every year, in March, day of time change (which has only 23 hours), the values between 1:00 and 2:00 are zero for all points. Each year, in October, day of time change (which counts 25 hours), the values between 1:00 and 2:00 accumulate the consumption of two hours.
As part of the implementation of the simulation tests, an application was developed in Java technology. The proposed solution retrieves simulation data classified in ascending order of arrival dates and at 15-minute time steps. Also, each line of the simulation data file individually presents all the consumption data for the 370 customers. The application implements programs for calculating and displaying the result of daily, monthly and annual aggregations of customer consumption.
-
8.2. Simulation on data aggregations at daily time step
Below is the flowchart of the program for calculating the daily consumption of all customers from the file containing the electricity data of 370 customers in Portugal over the period 2011 to 2014.
-
8.3. Simulation on data aggregations at monthly time step
Below is the flowchart of the program for calculating the monthly consumption of all customers from the file containing the electricity data of 370 customers in Portugal over the period 2011 to 2014.
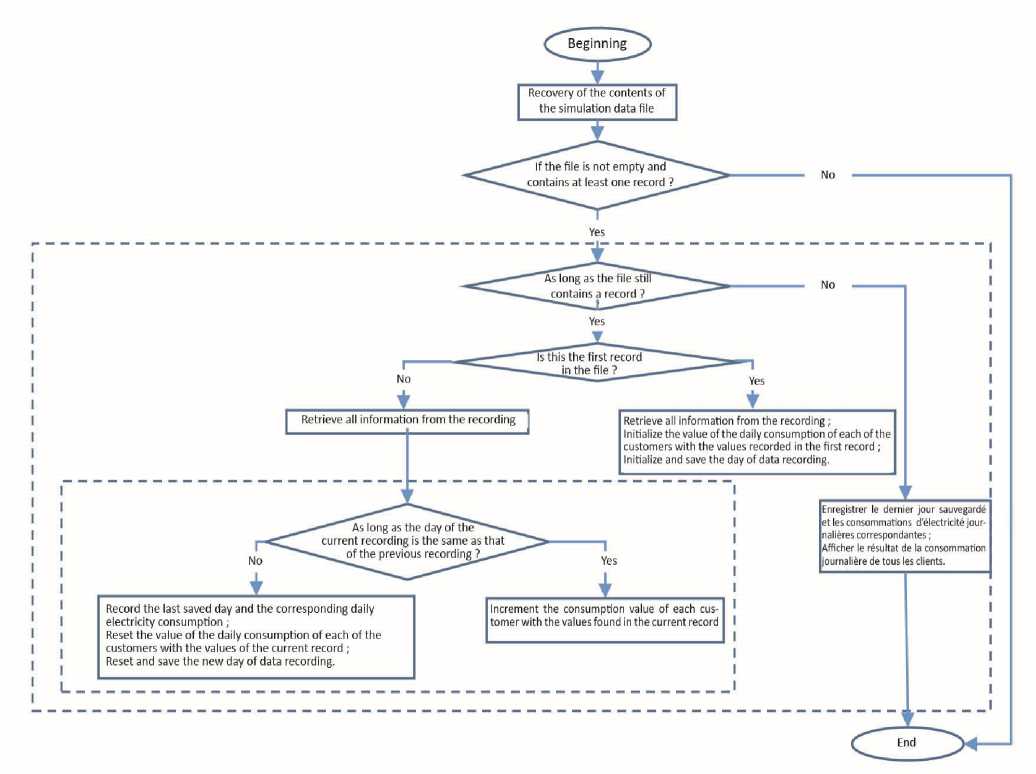
Fig. 1. Flowchart of the daily aggregation program
Below are the results of the daily data aggregation for clients MT_001, MT_210, MT_369, MT_370:
Table 2. Extraction of results from daily aggregations
|
Date |
MT_001 |
MT_210 |
MT_369 |
MT_370 |
|
11/02/2012 |
258.8832487349994 |
78294.5736439 |
73447.21407669998 |
0.0 |
|
12/02/2012 |
239.84771573499955 |
73067.1834659 |
67326.24633479999 |
0.0 |
|
13/02/2012 |
314.7208121989995 |
73312.6615005 |
77876.8328452 |
0.0 |
|
14/02/2012 |
953.0456852309993 |
74255.813954 |
81609.97067399997 |
0.0 |
|
15/02/2012 |
1507.6142131030008 |
72359.1731262 |
82350.43988269995 |
0.0 |
|
16/02/2012 |
1515.228426333001 |
71214.47028480005 |
81455.27859239995 |
0.0 |
|
17/02/2012 |
1512.6903553100005 |
75111.11111150001 |
81635.63049830002 |
0.0 |
|
18/02/2012 |
1365.4822334820003 |
75307.49354289999 |
74744.8680349 |
0.0 |
|
19/02/2012 |
1441.6243653450008 |
71772.60982039996 |
70006.59824080001 |
0.0 |
|
20/02/2012 |
1378.17258879 |
76356.58914859997 |
78653.22580640005 |
0.0 |
|
21/02/2012 |
1506.3451775120004 |
72720.93023260002 |
77706.01173049999 |
0.0 |
|
22/02/2012 |
1425.1269034440013 |
73832.04134329998 |
82166.42228779997 |
0.0 |
|
23/02/2012 |
1380.7106598840012 |
73170.5426374 |
82224.34017600001 |
0.0 |
|
24/02/2012 |
1439.0862943750014 |
74583.97933080002 |
82342.37536699999 |
0.0 |
|
25/02/2012 |
1661.1675125380016 |
76865.63307740001 |
76005.131965 |
0.0 |
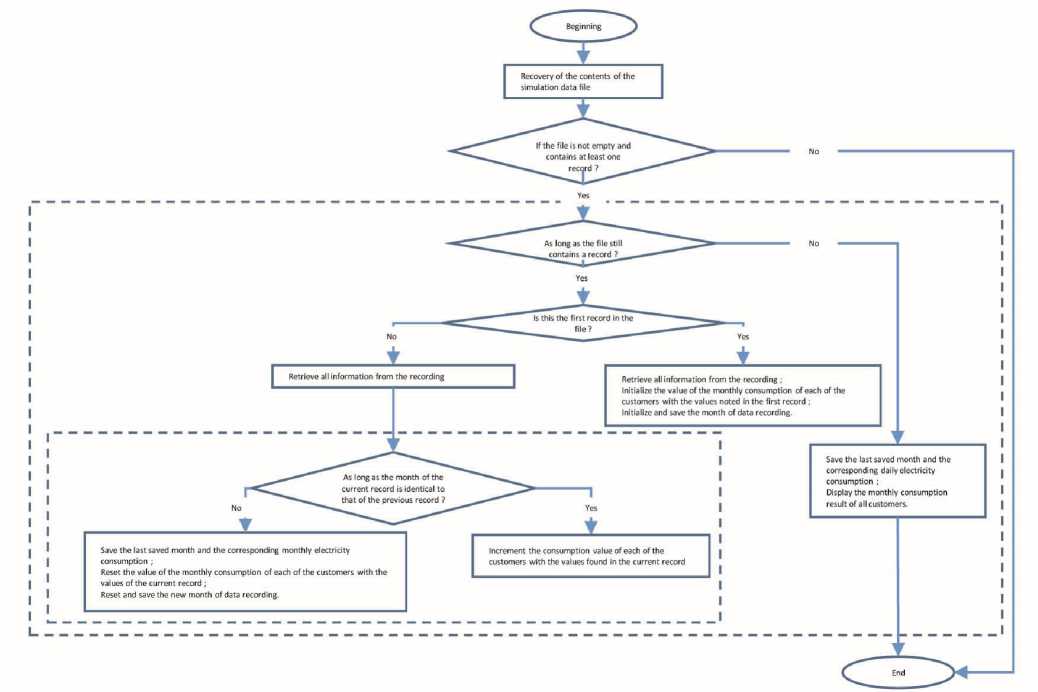
Fig. 2. Flowchart of the monthly aggregation program
Below are the results of the monthly data aggregation for customers MT_001, MT_012, MT_120, MT_370:
Table 3. Extraction of results from monthly aggregations
|
Date |
MT_001 |
MT_012 |
MT_120 |
MT_370 |
|
11/2013 |
46880.71066187712 |
430848.93616988073 |
0.0 |
45739286.486377515 |
|
12/2013 |
8558.375634601773 |
510874.46808152983 |
0.0 |
44630864.86484738 |
|
01/2014 |
7220.812182738947 |
542934.0425477294 |
61001.04766902019 |
39909351.35114564 |
|
02/2014 |
6106.598984786011 |
501002.1276565199 |
99151.91199586994 |
37458540.540709935 |
|
03/2014 |
7111.675127081943 |
435482.9787229292 |
108907.8051338704 |
45485783.78360502 |
|
04/2014 |
8361.675127014863 |
409714.8936139899 |
107146.67365128982 |
51986270.270297945 |
|
05/2014 |
14086.294416648509 |
386185.1063792802 |
112424.30591974994 |
56521513.513266765 |
|
06/2014 |
6431.472081279841 |
375808.5106365683 |
115553.69303312979 |
58213675.67543501 |
|
07/2014 |
6771.57360413186 |
396870.2127635096 |
142814.56259853975 |
62059459.45940002 |
-
8.4. Simulation on data aggregations at annual time step
Below is the flowchart of the program for calculating the annual consumption of all customers from the file containing the electricity data of 370 customers in Portugal over the period 2011 to 2014.
9. Criteria For Measuring the Performance of the Proposed Aggregation Methods
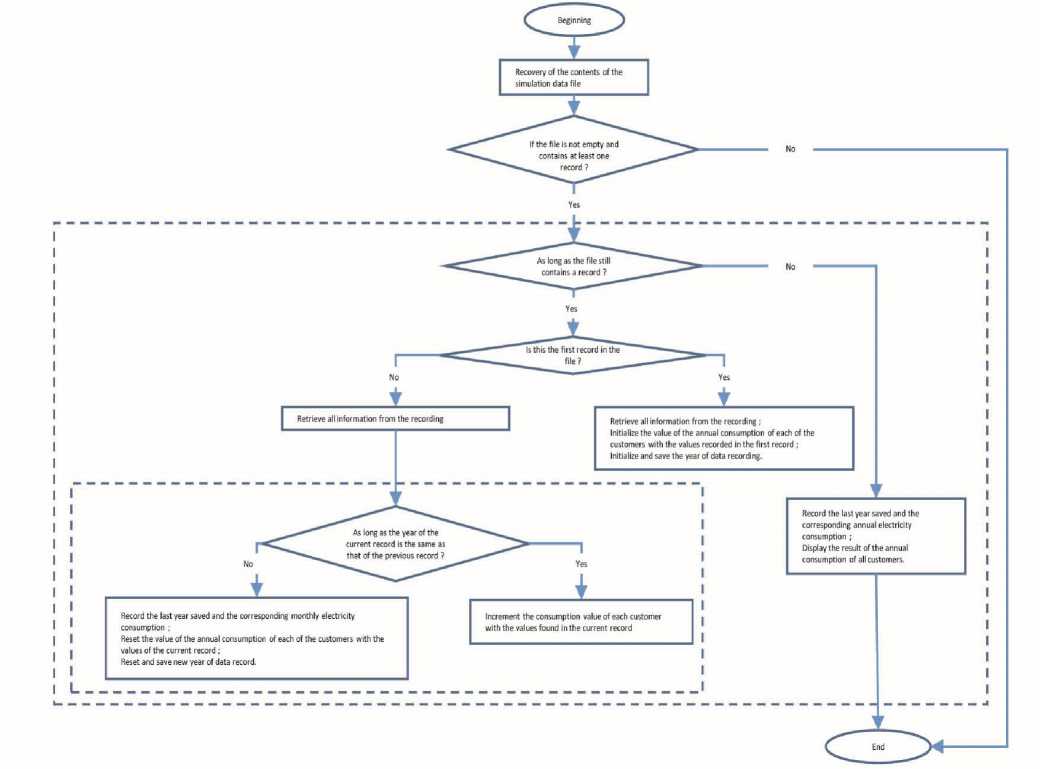
Fig. 3. Flowchart of the annual aggregation program
Below are the results of the annual data aggregation for customers MT_001, MT_021, MT_221, MT_370:
Table 4. Extraction of results from annual aggregations
|
Date |
MT_001 |
MT_021 |
MT_221 |
MT_370 |
|
2011 |
0.0 |
0.0 |
5972502.342553134 |
0.0 |
|
2012 |
193131.97969224004 |
5786534.031470969 |
5539887.558565675 |
0.0 |
|
2013 |
221593.90863678828 |
5731217.277515351 |
5364469.547108358 |
602657670.2696309 |
|
2014 |
142197.96954865512 |
5559989.528823792 |
5380239.458616321 |
620697837.8371063 |
|
2015 |
2.538071066 |
185.8638743 |
71.83758459 |
7135.135135 |
We have already shown [70] that the behavior of electricity consumption is also dependent on the characteristics of electrical devices connected to smart meters.
Let T n be the duration of consumption of device I in the interval [Tn-1, Tn [ and let Ci be the consumption per unit of time of this device.
The consumption of device I in the interval [Tn-1, Tn [ can then be represented by cn = Ci X Tn (13)
The total electricity consumption of smart mete к for M devices in the interval [Tn-1, Tn [ is:
ХП.=^ =1 СП’к = ^ =i C*xTn (14)
with СП'к the consumption read by meter к for device I in the interval [Tn-1, Tn[ and C ^ the consumption per unit of time of device I with respect to the characteristics of the smart meter к .
We then deduce that the characteristics of electrical devices influence electricity consumption and therefore the volume of data to be aggregated.
We have also presented the formulas for calculating the data aggregations of our electricity consumption management system and we can deduce that these aggregations depend on the following criteria:
n : the number of data records ;
Xn : electricity consumption between Tn-1 and Tn at time t ;
M : the finite number of events after which the counting process ends.
Therefore, we say that the performance of the data aggregation methods of our electricity system takes into account several factors and it is appropriate to make use of our aggregation methods according to the importance of the above performance criteria.
10. Conclusion
Several initiatives are underway around the world for energy management based on smart metering. A reality that the African continent will face after the development of energy infrastructure and the integration of alternative energy sources, including solar and wind power.
The solar potential of Africa is a source of motivation for the use of smart meters and the development of an information system that will allow the remote management of all the functions of the smart meter. The major challenge, however, lies in the implementation of an information system capable of meeting the expected objectives, especially in a context where cost reduction is sometimes a vital issue. Indeed, significant investments are necessary for the realization of decentralized centers of electricity production. The location of these centers must also take into account proximity to consumption areas to reduce technical losses. This work made it possible to define a framework for aggregating data from smart meters. The specificity of the data in such system has led to the implementation of data aggregation methods to facilitate the processing and analysis of these data.
The state of the art has made it possible to present other data aggregation methods and more specifically those related to energy data. According to the analysis of mathematical methods comparable to the jump process for data aggregation, it appears that these methods can be used individually or in combination with other techniques to solve different types of data aggregation or parameter estimation problems. Each has its own advantages and limitations, and the choice of the appropriate method will often depend on the specific nature of the problem to be solved and the data available.
In addition, the jump process method offers a robust and flexible approach for data aggregation and intelligent management of electricity consumption, especially in dynamic and uncertain environments such as power grids. It makes it possible to effectively model rare events, manage uncertainties and fluctuations in demand, and optimize the use of available energy resources.
The originality of this work lies in the presentation of a simulation relating to the processing of data from smart meters. This involves performing a simulation on data from smart meters through the aggregation of this data using the jump process. The lack of information on smart metering systems makes any comparative study difficult. Indeed, the implementation of these systems remains closed even if certain functionalities are well known to users.
The complexity of data management of smart metering systems is highlighted by the proposal of a global approach that includes a concrete case of implementation.
The limits of this work mainly reside in the absence of an experimental framework for implementing the proposed aggregation methods to verify their impacts in a network of smart sensors. The data set did not make it possible to present simulations on the aggregations by zone and by usage that are possible using the aggregation methods implemented. In general, the jump process method shows great potential for data aggregation and intelligent management of electricity consumption, further research is needed to overcome its limitations and maximize its benefits in real world scenarios.
In the continuation of our work, we will analyze the performance of our aggregation methods compared to other methods with regard to the reduction of energy consumption in wireless sensor networks.
However, the proposed new aggregation methods constitute new techniques eligible for reducing traffic and improving energy efficiency in wireless sensor networks.
References Towards an Intelligent Electricity Data Management
- Gupta, R.; Chaturvedi, K.T. Adaptive Energy Management of Big Data Analytics in Smart Grids. Energies 2023, 16, 6016. https://doi.org/10.3390/en16166016.
- Chen, Z.; Amani, A.M.; Yu, X.; Jalili, M. Control and Optimisation of Power Grids Using Smart Meter Data: A Review. Sensors 2023, 23, 2118. https://doi.org/10.3390/s23042118.
- S. R. Selva Jeevitha. Making ease of smart grid communication through compression of power system disturbance signals, 21 July 2023, PREPRINT (Version 1) available at Research Square [https://doi.org/10.21203/rs.3.rs-3172718/v1].
- Soham Dutta, Sourav Kumar Sahu, Millend Roy, Swarnali Dutta, A data driven fault detection approach with an ensemble classifier based smart meter in modern distribution system, Sustainable Energy, Grids and Networks, Volume 34, 2023, 101012, ISSN 2352-4677, https://doi.org/10.1016/j.segan.2023.101012.
- S. Banik, S. K. Saha, T. Banik and S. M. M. Hossain, "Anomaly Detection Techniques in Smart Grid Systems: A Review," 2023 IEEE World AI IoT Congress (AIIoT), Seattle, WA, USA, 2023, pp. 0331-0337, doi: 10.1109/AIIoT58121.2023.10174485.
- Lulu Wen, Kaile Zhou, Shanlin Yang, Lanlan Li, Compression of smart meter big data: A survey, Renewable and Sustainable Energy Reviews, Volume 91, 2018, Pages 59-69, ISSN 1364-0321, https://doi.org/10.1016/j.rser.2018.03.088.
- Lee J, Yoon S, Hwang E. Frequency Selective Auto-Encoder for Smart Meter Data Compression. Sensors. 2021; 21(4):1521. https://doi.org/10.3390/s21041521
- Sung, Tien-Wen et al. ‘Optimizing Data Aggregation Point Location with Grid-based Model for Smart Grids’. 1 Jan. 2022 : 3189 – 3201.
- Rajagopalan, Ramesh and Varshney, Pramod K., "Data aggregation techniques in sensor networks: A survey" (2006). Electrical Engineering and Computer Science - All Scholarship. 22. https://surface.syr.edu/eecs/22
- Geetika Dhand, S.S. Tyagi, Data Aggregation Techniques in WSN:Survey, Procedia Computer Science, Volume 92, 2016, Pages 378-384, ISSN 1877-0509, https://doi.org/10.1016/j.procs.2016.07.393.
- M. S. H. Nazmudeen, A. T. Wan and S. M. Buhari, "Improved throughput for Power Line Communication (PLC) for smart meters using fog computing based data aggregation approach," 2016 IEEE International Smart Cities Conference (ISC2), Trento, Italy, 2016, pp. 1-4, doi: 10.1109/ISC2.2016.7580841.
- Jagdish Chandra Pandey and Mala Kalra. An approach for secure data transmission in smart grids. Published Online:February 2, 2023pp 348-365https://doi.org/10.1504/IJICS.2023.128830.
- Pandey, Vaibhav, Amarjeet Kaur, and Narottam Chand. "A review on data aggregation techniques in wireless sensor network." Journal of Electronic and Electrical Engineering 1.2 (2010): 01-08.
- H. Harb, A. Makhoul, S. Tawbi and R. Couturier, "Comparison of Different Data Aggregation Techniques in Distributed Sensor Networks," in IEEE Access, vol. 5, pp. 4250-4263, 2017, doi: 10.1109/ACCESS.2017.2681207.
- Vaidyanathan, K., Sur, S., Narravula, S., & Sinha, P. (2004). Data aggregation techniques in sensor networks. Osu-cisrc-11/04-tr60, The Ohio State University.
- Ghiasi, M., et al.: Evolution of smart grids towards the Internet of energy: concept and essential components for deep decarbonisation. IET Smart Grid. 6(1), 86–102 (2023). https://doi.org/10.1049/stg2.12095.
- A. Lang, Y. Wang, C. Feng, E. Stai and G. Hug, "Data Aggregation Point Placement for Smart Meters in the Smart Grid," in IEEE Transactions on Smart Grid, vol. 13, no. 1, pp. 541-554, Jan. 2022, doi: 10.1109/TSG.2021.3119904.
- ABBASIAN DEHKORDI, Soroush, FARAJZADEH, Kamran, REZAZADEH, Javad, et al. A survey on data aggregation techniques in IoT sensor networks. Wireless Networks, 2020, vol. 26, p. 1243-1263.
- Guguloth Ravi, M. Swamy Das, Karthik Karmakonda, Reliable cluster based data aggregation scheme for IoT network using hybrid deep learning techniques, Measurement: Sensors, Volume 27, 2023, 100744, ISSN 2665-9174, https://doi.org/10.1016/j.measen.2023.100744.
- Singh, A.K., Kumar, J. A secure and privacy-preserving data aggregation and classification model for smart grid. Multimed Tools Appl 82, 22997–23015 (2023). https://doi.org/10.1007/s11042-023-14599-4.
- Singh, A.K., Kumar, J. A privacy-preserving multidimensional data aggregation scheme with secure query processing for smart grid. J Supercomput 79, 3750–3770 (2023). https://doi.org/10.1007/s11227-022-04794-9
- Dramé, Cheikh (2014) : Resolving West Africa's electricity dilemma through the pursuit of smart grid opportunities, 20th Biennial Conference of the International Telecommunications Society (ITS): "The Net and the Internet - Emerging Markets and Policies" , Rio de Janeiro, Brazil, 30th-03rd December, 2014, International Telecommunications Society (ITS), Calgary.
- Sebastian Sterl, Inne Vanderkelen, Celray James Chawanda, Daniel Russo, Robert J. Brecha, Ann van Griensven, Nicole P. M. van Lipzig and Wim Thiery. Smart renewable electricity portfolios in West Africa. Nat Sustain 3, 710–719 (2020). https://doi.org/10.1038/s41893-020-0539-0.
- S. M. Kadri, A. O. Bagré, M. B. Camara, B. Dakyo and Y. Coulibaly, "Electrical Power distribution status in West Africa: Assessment and Perspective Overview," 2019 8th International Conference on Renewable Energy Research and Applications (ICRERA), 2019, pp. 511-515, doi: 10.1109/ICRERA47325.2019.8997112.
- Osama Majeed Butt, Muhammad Zulqarnain, Tallal Majeed Butt. Recent advancement in smart grid technology: Future prospects in the electrical power network. Ain Shams Engineering Journal 12 (2021) 687–695.
- Young, Jacob R., "Smart grid technology in the developing world" (2017). Honors Projects. 68. https://digitalcommons.spu.edu/honorsprojects/68.
- Fernando Antonanzas-Torres, Javier Antonanzas and Julio Blanco-Fernandez. State-of-the-Art of Mini Grids for Rural Electrification in West Africa. Energies 2021, 14(4), 990; https://doi.org/10.3390/en14040990.
- Guy H. Orcutt, Harold W. Watts and John B. Edwards. Data Aggregation and Information Loss.The American Economic Review Vol. 58, No. 4 (Sep., 1968), pp. 773-787 (15 pages) Published By: American Economic Association
- Kalbfleisch, J.D. and Lawless, J.F. (1984), Least-squares estimation of transition probabilities from aggregate data. Can J Statistics, 12: 169-182. https://doi.org/10.2307/3314745
- G. BELIAKOV MONOTONE APPROXIMATION OF AGGREGATION OPERATORS USING LEAST SQUARES SPLINES. International Journal of Uncertainty, Fuzziness and Knowledge-Based Systems 2002 10:06, 659-676
- Andrei Kazakov, Michael Frenklach, Dynamic Modeling of Soot Particle Coagulation and Aggregation: Implementation With the Method of Moments and Application to High-Pressure Laminar Premixed Flames, Combustion and Flame, Volume 114, Issues 3–4, 1998, Pages 484-501, ISSN 0010-2180, https://doi.org/10.1016/S0010-2180(97)00322-2. (https://www.sciencedirect.com/science/article/pii/S0010218097003222)
- Daniele L. Marchisio, R. Dennis Vigil, Rodney O. Fox, Implementation of the quadrature method of moments in CFD codes for aggregation–breakage problems, Chemical Engineering Science, Volume 58, Issue 15, 2003, Pages 3337-3351, ISSN 0009-2509, https://doi.org/10.1016/S0009-2509(03)00211-2. (https://www.sciencedirect.com/science/article/pii/S0009250903002112)
- Azari Soufiani, H., Chen, W., Parkes, D. C., & Xia, L. (2013). Generalized method-of-moments for rank aggregation. Advances in Neural Information Processing Systems, 26.
- Casella, G., & Berger, R. L. (2021). Statistical inference. Cengage Learning.
- Shenton, S. H. (1977). Maximum likelihood estimation in small samples. Griffin Monograph.
- Papageorgiou, G., Grant, S. W., Takkenberg, J. J., & Mokhles, M. M. (2018). Statistical primer: how to deal with missing data in scientific research?. Interactive cardiovascular and thoracic surgery, 27(2), 153-158.
- Lahiri, S. N. (2013). Resampling methods for dependent data. Springer Science & Business Media.
- Jens-Peter Kreiss, Soumendra Nath Lahiri, 1 - Bootstrap Methods for Time Series, Editor(s): Tata Subba Rao, Suhasini Subba Rao, C.R. Rao, Handbook of Statistics, Elsevier, Volume 30, 2012, Pages 3-26, ISSN 0169-7161, ISBN 9780444538581, https://doi.org/10.1016/B978-0-444-53858-1.00001-6. (https://www.sciencedirect.com/science/article/pii/B9780444538581000016)
- Chaubey, Y. P. (1993). Resampling-based multiple testing: Examples and methods for p-value adjustment.
- Huynh, H. T., & Soumare, I. (2011). Stochastic simulation and applications in finance with MATLAB programs. John Wiley & Sons.
- McLeish, D. L. (2004). Monte carlo simulation and finance.
- Donnet, S. (2012). Monte Carlo Simulation for the Pharmaceutical Industry: Concepts, Algorithms, and Case Studies by Mark Chang.
- Zhang, H., Chen, Z., Ao, W., & Shi, P. (2023). Improved Dynamic Event-Triggered Robust Control for Flexible Robotic Arm Systems with Semi-Markov Jump Process. Sensors, 23(12), 5523.
- Elliott, R. J., Chan, L., & Siu, T. K. (2006). Risk measures for derivatives with Markov-modulated pure jump processes. Asia-Pacific Financial Markets, 13, 129-149.
- Segall, A., & Kailath, T. (1975). The modeling of randomly modulated jump processes. IEEE Transactions on information theory, 21(2), 135-143.
- Daly, E., & Porporato, A. (2010). Effect of different jump distributions on the dynamics of jump processes. Physical Review E, 81(6), 061133.
- Li, Y., Jin, D., Wang, Z., Hui, P., Zeng, L., & Chen, S. (2013). A Markov jump process model for urban vehicular mobility: Modeling and applications. IEEE Transactions on Mobile Computing, 13(9), 1911-1926.
- Aït-Sahalia, Y., Cacho-Diaz, J., & Laeven, R. J. (2015). Modeling financial contagion using mutually exciting jump processes. Journal of Financial Economics, 117(3), 585-606.
- Wu, M. C., & Yen, S. H. (2007). Pricing real growth options when the underlying assets have jump diffusion processes: the case of R&D investments. R&D Management, 37(3), 269-276.
- Deng, L., & Zhu, Y. (2012). Uncertain optimal control with jump. ICIC Express Letters, Part B: Applications, 3(2), 419-424.
- Fouladi, S. H., & Hajiramezanali, E. (2019). Non-Linear Non-Stationary Heteroscedasticity Volatility for Tracking of Jump Processes. arXiv preprint arXiv:1902.04499.
- Schnaubelt, M. (2019). A comparison of machine learning model validation schemes for non-stationary time series data (No. 11/2019). FAU Discussion Papers in Economics.
- Toth, B., Lillo, F., & Farmer, J. D. (2010). Segmentation algorithm for non-stationary compound Poisson processes: With an application to inventory time series of market members in a financial market. The European Physical Journal B, 78, 235-243
- Shirai, K., & Amano, Y. (2020). Mathematical modeling and risk management of production systems with jump process via stochastic analysis. International Journal of Innovative Computing, Information and Control, 16(1), 153-171.
- Su, P., & Liu, S. (2015). Dual sourcing in managing operational and disruption risks in contract manufacturing. International Journal of Production Research, 53(1), 291-306.
- Andersen, T. G., Bollerslev, T., & Diebold, F. X. (2003). Some like it smooth, and some like it rough: Untangling continuous and jump components in measuring, modeling, and forecasting asset return volatility. Modeling, and Forecasting Asset Return Volatility (September 2003).
- Perez, I., & Kypraios, T. (2019). Scalable Bayesian inference for population Markov jump processes. arXiv preprint arXiv:1904.08356.
- Meyer, R., Schloss, L., Brewer, J., Lambertson, R., Kinney, W., Sanchez, J., & Rinerson, D. (2008, November). Oxide dual-layer memory element for scalable non-volatile cross-point memory technology. In 2008 9th Annual Non-Volatile Memory Technology Symposium (NVMTS) (pp. 1-5). IEEE.
- Yan, J., & Rotskoff, G. M. (2022). Physics-informed graph neural networks enhance scalability of variational nonequilibrium optimal control. The Journal of Chemical Physics, 157(7).
- Elliott, L., & Teh, Y. (2012). Scalable imputation of genetic data with a discrete fragmentation-coagulation process. Advances in neural information processing systems, 25.
- Gonzalez, J., Moriarty, J., & Palczewski, J. (2017). Bayesian calibration and number of jump components in electricity spot price models. Energy Economics, 65, 375-388.
- Tankov, P. (2003). Financial modelling with jump processes. CRC press.
- Golightly, A., & Sherlock, C. (2019). Efficient sampling of conditioned Markov jump processes. Statistics and Computing, 29, 1149-1163.
- Rao, V., & Teg, Y. W. (2013). Fast MCMC sampling for markov jump processes and extensions. Journal of Machine Learning Research, 14(11).
- Mark, M., Chehrazi, N., Liu, H., & Weber, T. A. (2022). Optimal recovery of unsecured debt via interpretable reinforcement learning. Machine Learning with Applications, 8, 100280.
- Wu, M. C., & Yen, S. H. (2007). Pricing real growth options when the underlying assets have jump diffusion processes: the case of R&D investments. R&D Management, 37(3), 269-276
- Deng, L., & Zhu, Y. (2012). Uncertain optimal control with jump. ICIC Express Letters, Part B: Applications, 3(2), 419-424.
- Lee, K., Halder, A., & Bhattacharya, R. (2015). Performance and robustness analysis of stochastic jump linear systems using wasserstein metric. Automatica, 51, 341-347.
- Ntinas, V., Rubio, A., & Sirakoulis, G. C. (2020). Probabilistic resistive switching device modeling based on Markov jump processes. IEEE access, 9, 983-988.
- Yazid Hambally Yacouba, Amadou Diabagaté, Michel Babri and Adama Coulibaly, “Design, Aggregation and Analysis of Power Consumption Data using the Jump Process” International Journal of Advanced Computer Science and Applications(IJACSA),12(5), 2021. http://dx.doi.org/10.14569/IJACSA.2021.0120567.
- Artur Trindade, artur.trindade '@' elergone.pt, Elergone, NORTE-07-0202-FEDER-038564 Data type: TS, Smart Meter Data Portal, 370 Client Electricity Loads 2011 - 2014, https://smda.github.io/smart-meter-data-portal.
