Trends of social expenditures in the north of Russia

Author: Styrov Maxim Mikhailovich
Journal: Economic and Social Changes: Facts, Trends, Forecast @volnc-esc-en
Section: Social development
Article in issue: 2 (20) т.5, 2012.
Free access
The article reveals the features of social expenditures in the North of Russia. It contains the analysis of the main sources of funding such as regional and municipal budgets and off-budget funds. The following trends are revealed: heightened social costs caused by high life-support expenses, increasing of social expenditures, reinforcement of social policy due to the raise in pensions, smoothing of spatial and structural differences.
Budget, public health, culture, education, region, north, social security, social policy, social expenditures, finances
Short address: https://sciup.org/147223334
IDR: 147223334 | UDC: 332.14+336.53
Text of the scientific article Trends of social expenditures in the north of Russia
The article reveals the features of social expenditures in the North of Russia. It contains the analysis of the main sources of funding such as regional and municipal budgets and off-budget funds. The following trends are revealed: heightened social costs caused by high life-support expenses, increasing of social expenditures, reinforcement of social policy due to the raise in pensions, smoothing of spatial and structural differences.
Budget, public health, culture, education, region, the North, social security, social policy, social expenditures, finances.
Maxim M.
STYROV
Ph.D. in Economics, Scientific Associate of the Institute of Socio-Economic and
Energy Problems of the North Komi scientific centre of the Ural RAS department
Economic development and rise in the standard and quality of living in Russia are largely determined by the functioning of social sphere. In turn, the social conditions depend directly on the level of funding. Despite the decentralization and the slight increase in financial resources allocated for social needs, their volume is still insufficient to ensure normal living conditions. This problem is particularly acute in the North of our country due to the factors of price rise, negative consequences of market reforming and the financial and economic crisis.
The sources of social financing
Social sphere is considered in this article as a set of the following social systems: education, public health (including physical education and sports), culture and social policy.
We don’t consider such components of the social sphere as incomes and expenses of the population, municipal or urban engineering and environmental protection.
In turn, social policy includes the expenditures related to the same section of the budget classifications in the budget accounting: pension provision, social security, social support and social services for the population, family and childhood protection, applied researches in this field.
The regional system of social expenditure includes centralized and decentralized sources (fig. 1). Centralized sources involve the funds that are at disposal of the state and local authorities; they function according to the regulations that are obligatory for the whole country and for all the economic subjects, and they are formed at the expense of tax revenues and insurance fees. Decentralized sources are characterized, firstly, by the formation and expenditure at the microlevel, and, secondly, by voluntary expenditure, without the forced and the same order for everybody.
In general, the responsibility between centralized sources of social financing is divided as follows.
The regional social expenditures of nationwide importance are financed from the federal budget. They include the expenditures on fundamental researches in the relevant fields, higher and postgraduate education, the protection of important cultural heritage, the activity of federal law enforcement and supervisory authorities, delivery of some types of medical care (provided by the federal health organizations, including high-tech medical care, as well as some high-cost preventive areas), financial support for the disabled persons, war veterans, heroic persons and some other categories, etc.
Regional budgets finance the expenditures on primary and secondary vocational education, youth policy, some types of specialized medical care, cultural policy and regional cultural events, social protection of the poor, some social benefits for labour veterans, home front workers, rehabilitated persons and some other categories, etc.
Local budgets are responsible for financing of preschool and general education, emergency medical services and primary health care in the case of socially significant diseases, local cultural institutions and other similar areas1.
Figure 1. The main sources of social expenditure in the region
Centralized sources

Consolidated regional budgets
regional
local

SOCIAL SPHERE OF THE REGION
EDUCATION
HEALTH
CULTURE
SOCIAL POLICY
Population
Enterprises and institutions

Decentralized sources
Extra-budgetary funds are responsible for the following areas: the Social Insurance Fund finances temporary and professional disability allowances, social protection of motherhood and childhood, rehabilitation and sanatorium treatment; the Pension Fund finances pension benefits for the elderly and some other categories of people; the Mandatory Health Insurance Fund finances basic types of health care (primary and specialized health care, with the exception of high-tech medical care) within the governmental program of state guarantees.
Decentralized sources include funds of the population, enterprises, institutions and nonprofit organizations.
Population funds are the citizens’ expenses on the paid educational, health and cultural services. The funds of enterprises and institutions include the charges for education, medical treatment, voluntary health insurance, leisure and recreation of their employees and their family members, as well as co-financing of temporary disability allowances and financial assistance in difficult situations. Non-profit organizations, both domestic and foreign, finance the social sphere in the form of grants; they include charitable foundations, social and religious groups, trade unions, etc.
The expenditure of centralized sources on social services and the population’s payments are registered by official statistics [1, 3, 10]. The voluntary investments of enterprises, institutions and non-profit organizations in the social sector are not fixed. According to expert assessment of their value in education [11], it is possible to get a rough idea of the relationship between centralized and decentralized sources in the total amount of social expenditures. It is 80:20. This proportion indicates that the budgetary system retains the leading role in the country’s social expenditure.
The structure of financing sources
Extra-budgetary funds are the most important part in the structure of centralized sources of social expenditure financing in the northern regions. They amount to 51% of total assets. The share of local budgets in social expenditure is 29%. The regional budgets take last place; they amounted to 20% (fig. 2)2.
The structure of social expenditure is different in various areas: extra-budgetary funds are the most important source in the financing of social policy (almost 80%). Local budgets play a key role in other spheres. The share of regional budgets is significant in all areas.
The share of local budgets is significant in social expenditure in the North of Russia as opposed to the rest of the territory (29% vs. 17%), but the share of extra-budgetary funds is lower by 10% (51% vs. 61%). The shares of the regional budgets are roughly equal (tab. 1) .
The increased share of local budgets can be explained by the fact that there are high educational, health care and cultural expenditures in the northern regions, especially in the regions that have large budget revenues due to their natural resource rents (the Magadan Oblast, the Sakhalin Oblast, the Nenets Autonomous Okrug, the Khanty-Mansi Autonomous Okrug, the Yamalo-Nenets Autonomous Okrug, Yakutia). Their social expenditures are twice as more as the average social expenditure in Russia. These spheres are financed mostly by local budgets; this fact leads to a significant increase in the share of the latter.
The main reasons of high costs of the regional social systems, mentioned above, include low population density, severe climate conditions, undeveloped infrastructure, as well as the additional “resource” revenues that are allocated to improve living conditions of the population. For example, under the condition that the average share of local budgets in the financing of social policy varies from 2 to 5%, it amounts to 25% in the Yamalo-Nenets Autonomous Okrug; this fact indicates a significant budget investment to the social support for the local population.
Figure 2. The structure of centralized sources of social expenditure financing in the northern regions of Russia in 2010, % [1, 10]
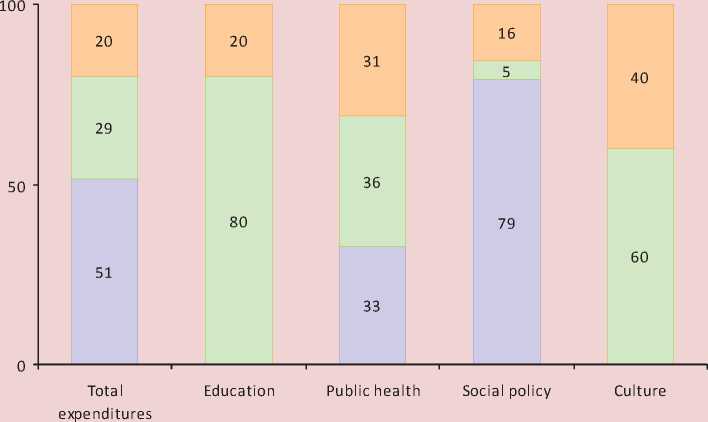
Extra-budgetaryfunds c Local budgets □ Regional budgets
Table 1. The structure of financing sources of social expenditure in the northern regions of Russia in 2010, % [1, 10]
|
Region |
Extra-budgetary funds |
Local budgets |
Regional budgets |
|
Russian Federation, total |
61 |
17 |
22 |
|
Northern regions, total |
51 |
29 |
20 |
|
Including: |
|||
|
Republic of Karelia |
63 |
18 |
20 |
|
Republic of Komi |
65 |
18 |
18 |
|
Arkhangelsk Oblast |
66 |
16 |
19 |
|
Nenets AO |
33 |
42 |
25 |
|
Murmansk Oblast |
60 |
23 |
17 |
|
Khanty–Mansi AO |
43 |
35 |
23 |
|
Yamalo-Nenets AO |
37 |
50 |
14 |
|
Yakutia |
47 |
30 |
24 |
|
Kamchatka Krai |
49 |
30 |
21 |
|
Magadan Oblast |
50 |
26 |
25 |
|
Sakhalin Oblast |
47 |
31 |
22 |
|
Chukotka АО |
46 |
29 |
26 |
The level of extra-budgetary funds’ per capita expenditure, especially the expenditure of the Pension Fund, is much closer to the average value in Russia, which deviates upward from it by only 30 – 50%, and thereby it leads to a relative decrease in the share of extra-budgetary funds in the financing of social expenditure in the North of Russia. Average weighted rate of the pensions in the northern regions is only 37% higher than the average level in the country, while there are twofold differences in other areas of social expenditures, and the difference in the average value of monthly salary is more than 1.5-fold.
For example, the scale of pension in the Chukotka Autonomous Okrug is only 80% above the national average level, whereas the specific social costs are three times as many than the average Russian social expenditures and wages are higher by 2.2-fold [4].
The following figures allow us to get a quantitative understanding of the northern price rise factors, mentioned above (tab. 2) .
Average weighted rate of the northern and regional wage allowances shows that there is a 1.5-fold price rise of living in the North of Russia, which is lower in the lived-in regions, and it is 2-fold and more in the remote regions. The population density in the North is eight times lower than in Russia. It is enough high only in the Murmansk Oblast, the Sakhalin Oblast and the Republic of Karelia. Average annual air temperature is lower in most northern regions than in Russia3. The level of road network (Engel’s coefficient) is close to the average values only in the Republic of Karelia, the Republic of Komi, the Arkhangelsk Oblast, the Murmansk Oblast and the Sakhalin Oblast; other northern regions are provided with the roads poorly. Finally, the revenue of consolidated regional budgets also show a huge gap between the North and the rest parts of the country – up to 5 times or more, the average gap is more than doubled.
The structure of expenditure according to their directions
The share of social policy is the main direction (58%) in the structure of social expenditure of the northern regions (tab. 3). Then there are approximately equal directions – educational expenditure (22%) and health expenditure (18%). Cultural expenditure takes the last place; it amounts to 3%. The dominant position of social policy is determined by a large amount of pension expenses, which accounts for about 40% of total social expenditure.
The northern regions in Russia are characterized by a significant lower share of social policy expenses as opposed to the rest of the territory (58% vs. 68%), but the shares of social, health and cultural expenditures are higher. The main reason for this is an above-mentioned difference in the financing of various directions of social expenditure in the North as compared with average level of social financing in Russia: it is lower in the field of social policy because of a relatively weak increase in the size of pensions and it is higher in other spheres due to the northern price rise and the additional investment at the expense of their resource rent. Therefore, regions with a high level of budget revenues (Kamchatka Krai, the Magadan Oblast, the Sakhalin Oblast, the Khanty-Mansi Autonomous Okrug, Yamalo-Nenets Autonomous Okrug, the Nenets Autonomous Okrug, Yakutia) are significantly different from other regions that have increased share of social, health and cultural expenditures.
The structure of social expenditure has changed greatly over the last decade. The main changes include the sharp increase in the share of social policy (20%) with the simultaneous decrease in the share of other social expenditures. The reason for this structural shift is an outstripping increase in social payments over these years; especially it is the growth of pensions, the share of whose has increased from 19% up to 40% in the total social expenditure in the North over this period. The amount of the Pension Fund’s per capita expenditure has increased by almost 17-fold over this period in the northern regions, while there is only 6-fold increase in other social expenditures.
This trend isn’t a prerogative of the northern regions. It was caused by the policy in Russia, which had allowed our government to increase the level of pensions, that was extremely low previously. The correlation of pensions with the living wage of pensioners grew from 76% up to 127%,
Table 2. Price rise factors in the northern regions of Russia in 2010, % [4, 7, 9]
|
Region |
Price rise coefficient* |
Population density, pers./km2 |
Average annual air temperature, 0 С |
Engel’s coefficient**, railways |
Engel’s coefficient, highways |
Regional consolidated budget revenue per capita, thsd. rub. |
|
Russian Federation, total |
1.2 |
8.4 |
-1.5 |
17.3 |
13.5 |
46 |
|
Northern regions, total |
2.1 |
1.0 |
-3.7 |
8.1 |
5.4 |
94 |
|
Including: |
||||||
|
Republic of Karelia |
1.8 |
3.6 |
1.7 |
65.1 |
19.6 |
49 |
|
Republic of Komi |
1.9 |
2.2 |
-2.0 |
27.9 |
9.5 |
55 |
|
Arkhangelsk Oblast |
1.8 |
2.9 |
0.0 |
17.7 |
10.6 |
51 |
|
Nenets AO |
2.3 |
0.2 |
-3.6 |
0.0 |
2.2 |
266 |
|
Murmansk Oblast |
2.2 |
5.5 |
-0.6 |
25.6 |
8.1 |
65 |
|
Khanty–Mansi AO |
2.0 |
2.9 |
-2.4 |
11.8 |
3.7 |
110 |
|
Yamalo-Nenets AO |
2.3 |
0.7 |
-7.2 |
7.3 |
2.2 |
204 |
|
Yakutia |
2.3 |
0.3 |
-11.1 |
3.6 |
4.8 |
110 |
|
Kamchatka Krai |
2.4 |
0.7 |
-0.9 |
0.0 |
4.3 |
139 |
|
Magadan Oblast |
2.5 |
0.3 |
-8.8 |
0.0 |
8.1 |
133 |
|
Sakhalin Oblast |
2.0 |
5.7 |
1.1 |
38.5 |
5.9 |
109 |
|
Chukotka АО |
3.0 |
0.1 |
-10.3 |
0.0 |
3.0 |
267 |
Table 3. The structure of social expenditure in the northern regions of Russia according to their directions in 2000 and 2010, % [1, 10]
|
Region |
Education |
Public Health |
Social Policy |
Culture |
||||
|
2000 |
2010 |
2000 |
2010 |
2000 |
2010 |
2000 |
2010 |
|
|
Russian Federation, total |
20 |
16 |
23 |
15 |
54 |
67 |
3 |
2 |
|
Northern regions, total |
27 |
22 |
30 |
18 |
38 |
58 |
5 |
3 |
|
Including: |
||||||||
|
Republic of Karelia |
22 |
13 |
19 |
15 |
55 |
70 |
3 |
2 |
|
Republic of Komi |
21 |
17 |
30 |
15 |
47 |
67 |
2 |
2 |
|
Arkhangelsk Oblast |
18 |
14 |
20 |
13 |
60 |
72 |
2 |
1 |
|
Nenets AO |
36 |
38 |
26 |
15 |
31 |
37 |
7 |
10 |
|
Murmansk Oblast |
22 |
19 |
27 |
14 |
49 |
65 |
2 |
2 |
|
Khanty–MansiAO |
29 |
24 |
38 |
23 |
26 |
50 |
7 |
3 |
|
Yamalo-NenetsAO |
27 |
28 |
29 |
19 |
38 |
47 |
6 |
6 |
|
Yakutia |
35 |
27 |
25 |
16 |
35 |
53 |
5 |
4 |
|
Kamchatka Krai |
30 |
23 |
22 |
17 |
45 |
56 |
3 |
3 |
|
Magadan Oblast |
25 |
20 |
28 |
23 |
42 |
53 |
5 |
4 |
|
Sakhalin Oblast |
21 |
21 |
25 |
22 |
51 |
53 |
3 |
3 |
|
Chukotka АО |
30 |
30 |
30 |
20 |
36 |
45 |
4 |
6 |
the correlation of pensions with average size of gross wages and salaries increased from 31% up to 35% [5, 8].
But the increasing degree in the share of social policy in the northern regions was more significant than the average growth rate in Russia (20% vs. 13%), which was the result of the senility of the age structure of the population. It was expressed clearly in the Khanty-Mansi
Autonomous Okrug and the Yamalo-Nenets Autonomous Okrug, where the increase in the number of pensioners amounted to more than 50% per 1000 people over the last decade; it varied from 10% to 30% in other northern regions (average rate in Russia – 6%) [4].
It should be noted that the increased growth of pension spending didn’t provoke the decrease in educational, health and cultural expendi- tures; their share in the GDP remained virtually unchanged. That is, these fields were developed evenly; they kept pace with the economy. But the pension spending was a major priority of the social development in Russia during that period; they led to such a sharp social policy growth in the structure of expenditure.
In addition to the sharp increase in the share of social policy in the structure of social expenditure in the North, there was a change of priorities: the share of health expenditure was decreased more (by 12%) than educational expenditure (5%) due to a cut of the extremely high health expenditure in the well-off regions. As a result, public health let the educational expenditure to take the second place in the structure of budgetary social expenditures and it moved to the third position.
It should be noted that cultural expenditures, despite their low share, lost their positions in the list of priorities: their share declined from 5 to 3%. All these changes conciliated significantly the structure of social expenditure in the North and national average social expenditure.
Spatial structure
The share of the northern regions in the total budget financing of social expenditure in our country is about 9% (tab. 4) , while their share in the population size is significantly lower – 5.5%.
This disparity is explained by the differences in the level of spending per capita due to the price rise in the northern regions. Currently, there is a convergence of these figures: the share of the North in the social expenditure of our country was 12% at the constant proportion of the population ten years ago. These figures illustrate a strong trend of the rapprochement between the northern regions and other Federal subjects of Russia in the amount of social expenditure. There is a steady picture in comparison with the share of the gross regional product: the contribution of the North to the total GRP of Russia (13.4%) is roughly equivalent to its share in social expenditure.
The share of the North in the nationwide financing indicators of social expenditure is unequal according to different sources. The least share of them is in extra-budgetary funds
Table 4. The spatial structure of financial sources of social expenditure in the northern regions of Russia in 2010, % [1, 10]
|
Region |
Total |
Including the sources |
||
|
Regional budgets |
Local budgets |
Extra-budgetary funds |
||
|
Russian Federation, total |
100 |
100 |
100 |
100 |
|
Northern regions, total |
9 |
8 |
15 |
7 |
|
Including: |
||||
|
Republic of Karelia |
7 |
5 |
4 |
9 |
|
Republic of Komi |
10 |
7 |
6 |
12 |
|
Arkhangelsk Oblast |
13 |
9 |
7 |
16 |
|
Nenets AO |
1 |
2 |
2 |
1 |
|
Murmansk Oblast |
9 |
7 |
7 |
11 |
|
Khanty–Mansi AO |
22 |
26 |
27 |
19 |
|
Yamalo-Nenets AO |
10 |
12 |
17 |
7 |
|
Yakutia |
13 |
14 |
14 |
12 |
|
Kamchatka Krai |
5 |
5 |
5 |
5 |
|
Magadan Oblast |
3 |
3 |
2 |
2 |
|
Sakhalin Oblast |
7 |
8 |
8 |
6 |
|
Chukotka АО |
1 |
2 |
1 |
1 |
(7%) due to the relative similarity of the pension expenditure per capita. The share of the North is more in the regional budgets (8%). And this share is higher in the context of local budgets (15%) that is caused by the preferential concentration of the additional revenue and expenditure the export-oriented regions just in this section of the budgetary system.
The internal spatial structure of social expenditure in the northern regions is characterized by a moderate concentration of them: the individual share of three regions (the Khanty-Mansi Autonomous Okrug, Yakutia and the Arkhangelsk Oblast) is more than 10%, their total share is about 50%. The shares of most other regions are in the range from 5 to 10%. And there are insignificant shares of such sparsely populated areas as the Chukotka Autonomous Okrug and the Nenets Autonomous Okrug (1%), as well as the Magadan Oblast (2.5%).
There was a strong decline in the shares of the main resource regions in the dynamics of the last 10 years, which wasn’t associated with the relevant change in the population size: 10.2% in the Khanty-Mansi Autonomous Okrug, 2% in the Yamalo-Nenets Autonomous Okrug and 1.4% in Yakutia, while there was an increase in the shares of the Arkhangelsk Oblast (4.2%), the Murmansk and Sakhalin Oblasts (2.2%), the Republic of Karelia (2%) and Kamchatka Krai (1.6%). This phenomenon should be assessed as positive, because it indicates the smoothing of extremely high levels of social security differentiation in the northern regions that existed before through fiscal centralization and income redistribution.
Significant increase in the share of social expenditure of the North in the gross domestic product is an important trend in recent times. This share has increased by 3% over the past decade, and it has reached the level of 15% (fig. 3) ; the main growth was during the last three years. The principle reason is a significant increase in budget social expenditure, especially in the spending for pensions. This trend was particularly intensified during the recent financial crisis, when the government
Figure 3. The share of social expenditure the in GRP of the regions in Russia for the period from 2000 to 2009, %* [1, 2, 10]
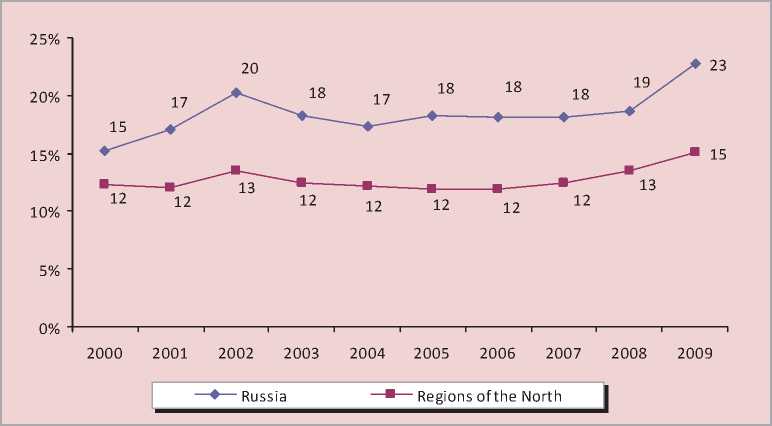
* The amount of social expenditure and the GDP in Russia is calculated here as the sum of the regional ones for the purpose of correct comparison.
of the country, despite the economic downturn, announced a complete fulfillment of social obligations. And there were the priority growth rates of social expenditure in 2010, when the positive economic growth was being restored. All these facts testify the efficient increase in the importance of social services among the priorities of the state’s development.
The share of social expenditure in the GRP is considerably lower in the northern regions, than in Russia on average – 15% versus 23%. This difference doesn’t arise because of the lower financing of social services in the North, but it is due to the extremely high GRP per capita in the main oil-producing regions: in the Nenets Autonomous Okrug (the share of social expenditure is only 5% of GRP), the Khanty–Mansi Autonomous Okrug (8%), the the Yamalo-Nenets Autonomous Okrug (9%) and the Sakhalin Oblast (12%). The share of social expenditure in the GRP is significantly higher in other regions of the North; it is 30 – 40% or more there due to the strong price rise of life support in the northern regions and the need for increased budgetary expenditure.
It should be also noted that the increase in the share of social expenditure in the in GRP of the northern regions in Russia was lower than in Russia on average – 2.8% vs. 7.5%. It’s caused by the fact that the smoothing process of the inter-territorial differences left its mark on the upward trend in social expenditure.
In general, the increase in the share of social expenditure in the in GRP is assessed as positive, because it symbolizes the beginning overcoming of the critical state of the social sphere. It is expected that this share will fix at this level and it will continue to grow slowly for some time in the next few years if there are no deep economic shocks. The reasons for such assumptions are the appeals and intentions to close the gap between the developed countries in terms of the financing of social services, especially of education and health care [6].
However, it should be noted that the possibility to increase the social burden on the budget system is limited. For example, in 2011 the improvement of the financial security in the social sphere provoked a sharp increase in taxes on business that seriously affected small-scale enterprises, the amount of wage allocations of whose was raised by 2.5 times. Such drastic measures can provoke long-term adverse consequences for the development of the real sector of the economy. Therefore, the task of further increasing the share of social expenditure in the GRP is preferable to be solved through the development of alternative, non-budgetary financing instruments, for example, such as voluntary insurance.
The characteristic feature of budget financing of social expenditure in the North is a significant excess of average funding per capita over the same showings of other regions.
There was a 1.7-fold gap in 2010; it amounted to 106 thousand rubles per person vs. 63 thousand rubles per person in other regions of Russia. This difference in per capita funding level is natural. It can be explained by three main reasons that include, firstly, the increasing costs of living in the North; secondly, high-income budgets of resource regions that allow them to allocate the additional funds for social support; thirdly, clearly defined ethnicity that requires the priority allocation of funds to study, preserve and develop the culture of indigenous peoples and provide their social support.
The level of per capita financing among the northern regions is very plural, so they can be divided into three main groups:
-
1. The developed regions , which located in the European part of Russia. They are the Arkhangelsk Oblast, the Murmansk Oblast, the Republic of Karelia and the Republic of Komi, which have insignificant difference in per capita financing as compared with other regions of the country; it is less than 1.5-fold. It can be explained by the natural northern high cost of living as compared with the central and southern territories.
-
2. The less-developed resource regions , which located in the Eastern part of Russia. They are the Magadan Oblast, the Sakhalin Oblast, the Khanty-Mansi Autonomous Okrug, the Yamalo-Nenets Autonomous Okrug, Yakutia and Kamchatka Krai. There is a 2-fold gap between these regions and the rest part of Russia in per capita financing due to the better economic position and the higher northern costs because of severe economic conditions.
-
3. The underpopulated Nenets and Chukotka Autonomous Okrugs, where the financing of specific social areas is three or more times greater than in the rest regions of Russia due to the weak development of the territories.
There are unequal differences in the financing of the various expenditure directions. This gap reaches its maximum value (2.3-fold) in the cultural allocations (fig. 4) due to the pro- tection programs of native minorities in the North, federal historical monuments protection, functioning of the specialized museum complexes, memorializing the victims of political repressions, as well as the increased attention of the regional authorities to the preservation and enhancement of cultural potential in order to develop tourism as a way to diversify the economy.
The differences in educational and health expenditures are about two times lower. This is a normal northern price rise. The level of per capita financing of the social policy in the North is close to the average per capita financing in Russia (the gap is less than 1.5-fold) due to a relatively weak increase in the level of pensions in the North in comparison with educational, health and cultural expenditures.
Figure 4. The gap between the North and other regions of Russia in per capita financing of social expenditures in 2000 – 2010, -fold [1, 10]
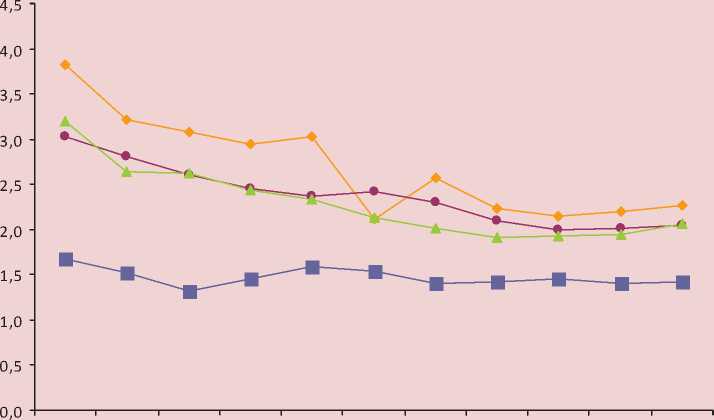

♦ Culture —•— Education — ▲ — Public hea lth Socia l pol icy
As it has been already mentioned, the social development of the Russian North is characterized by the significant reduction in the gap between the northern and other regions of Russia in the level of per capita financing of social expenditures.
If there was a 2.4-fold gap ten years ago, it has been reduced almost by half down to 1.7-fold today. This change didn’t involve any random shock; it was developed sequentially throughout period under our study (see fig. 4).
The main reason for this process was a strong reduction in the gap between the northern territories and such regions as Yakutia, the Nenets, Khanty-Mansi and Yamalo-Nenets Autonomous Okrugs, which have high tax allocations due to the sale of natural resources – oil, gas, diamonds, gold.
The degree of the gap between oil and gas producing regions and other northern regions decreased from 4.5-fold down to 3-fold and from 3-fold down to 2-fold in Yakutia. The reason for that change was the increase in the alignment of budgetary security of the regions in the country on the basis of income redistribution. It is noteworthy that the crisis of 2008, which significantly reduced the export regional earnings, wasn’t the main factor of that change; it just accelerated and fixed it. As well as a sharp increase in the flow of “rental” income during the period of favorable market conditions in 2004 – 2007 did not provoke a significant increase in inter-regional differentiation.
It is important that the process of convergence between the financing levels of the northern regions and the main territories of the country was fixed in each type of social expenditures, which proved its deep character that was not associated with short-term advances.
If the gap between the financing levels of “rich” regions was being decreased, the dynamics was multidirectional and flat in other regions. In particular, the superiority over the average level in Russia increased slightly in Kamchatka Krai (from 1.8 to 2-fold), the
Sakhalin Oblast (from 1.6 to 1.8-fold), the Arkhangelsk Oblast (from 1.2 to 1.4-fold). There was a slight increase in the Republic of Karelia and the Murmansk Oblast. On the contrary, there was a decrease of the gap in the Republic of Komi (from 1.7 to 1.4-fold) and the Magadan Oblast (from 2.2 to 2-fold). The Chukotka Autonomous Okrug was characterized by the peculiar dynamics; the superiority over the average Russian level of per capita social financing increased there firstly from 3.3 to 6.3-fold, but then it dropped down to the previous values. Such fact could be likely explained by political circumstances, such as the change of governors.
In general, the process of reducing the spatial differentiation is evaluated as positive, because it indicates the effective policy of the Government of Russia, aimed at the decrease in spatial disparities in the socio-economic development of the regions in our country.
In 2010, when the oil and gas regions recovered their revenues, they began to predominate over the rest regions. It is difficult to determine if this trend will be sustainable and long- or short-term. The choice of a path is in the hands of the Russian Government. However, the policy in this sphere will influence over the reduction or, on the contrary, the increased differentiation of the population according to the quality of life.
Thus, we can summarize the main features and trends in the financing of social systems in the northern regions of Russia at the modern stage of economic development:
-
♦ the prevailing role of centralized sources such as regional and local budgets and extrabudgetary funds is remained in the financing of social systems;
-
♦ there is a significant improvement in the financial of social expenditure in the northern regions and in the whole country, which is indicated itself in the increasing share of social issues in the GRP;
-
♦ the share ofper capita social expenditure in the North is higher than the average level in
other regions of Russia (from 1.5 to 3-fold) due to the “northern” price rise factors such as peripheral character, low population density, severe climatic conditions, as well as high budget security of the resource regions;
-
♦ there is a sustainable decrease in the gap between the northern and other regions of our country in terms of per capita financing of social expenditure due to the slower growth of expenditure in the rich regions (the Khanty-Mansi Autonomous Okrug, the Yamalo-Nenets Autonomous Okrug, the Nenets Autonomous Okrug, the Republic of Komi and Yakutia) because of the increased degree of budget security alignment;
-
♦ there is a positive smoothing of the financing levels of social systems among the northern regions due to the decrease in the predominance of rich regions, as well as because of the fact that such less-developed territories as the Republic of Karelia, the Arkhangelsk and Murmansk Oblasts began to be closer to the average level of financing;
-
♦ pension provision has become a priority of social development in recent years, so it has been possible to improve the living standards of retirees without decrease in financing of other social expenditures;
-
♦ the share of social policy costs is being increased in the structure of social expenditure in the North, as well as across the country, while the other types of social expenditures are being reduced due to the advanced growth of pensions; educational expenditure is becoming more important than the public health spending; in general, the structure of social expenditures in the northern regions is becoming closer to the average level of national social expenditure;
-
♦ price rice of pensions in the northern regions is lower than the relevant differences in wage rates and per capita social expenditure, which requires a separate study.
Based on the identified trends, is necessary to study in further research, devoted to social expenditures in the North of Russia, such problems as the origin reasons for regional convergence in terms of budgetary provision; it is important to consider the impact of financial security on the natural developmental quotients in the social sphere; it is reasonable to reveal the mechanisms of budget expenditure and the possibility to improve them and to predict the basic functioning parameters of the regional social systems.
References Trends of social expenditures in the north of Russia
- The information of the Federal Treasury of Russia on budgetary execution. Available at: http://www.roskazna.ru/reports/cb.html
- National accounts of Russia in 2003-2010: Stat. coll. Rosstat. M., 2011. P. 256.
- Paid service for the population in Russia. 2009: Stat. coll. Rosstat. M., 2009.
- Regions of Russia. Social and economic indexes. 2011: Stat. coll. Rosstat. М., 2011.
- Russian statistical year-book. 2010: Stat. coll. Rosstat. М, 2010. P. 181.
- Russian education -emergency calls. Available at: http://www.opec.ru/1359314.html
- Building climatology. Building code 23-01-99.
- Economic and social situation in Russia for 2010. Available at: http://www.gks.ru/doc_2010/social/doc12.rar
- About the size and calculating procedure of insurance tariff on obligatory medical insurance of the unemployed population. The federal law from 30.11.2011 N 354-FZ.
- Rosstat’s central statistical database. Available at: http://www.gks.ru/dbscripts/Cbsd/DBInet.cgi
- Educational economics: results of monitoring, 2009. Newsletter. М.: HSE, 2010.
