Trigeminy electrocardiogram spectral characteristics study

Author: Proskurin S.G.
Journal: Cardiometry @cardiometry
Section: Original research
Article in issue: 27, 2023.
Free access
This paper presents the results of a study in which the method of ECG decomposition in the time domain (DMTD) was applied, followed by a spectral analysis. A digital signal with trigeminy of the first lead of a standard electrocardiograph was processed. Using digital filtering in time domain, the electrocardiogram (ECG) was cleared of noise, what results the reduction of spurious components by 10-20%. To represent and classify the frequency characteristics throughout the entire processed cardiac signal, the QRS complexes were removed, P and T waves were left unchanged. Due to considerable influence on the spectral analysis sharp peaks of the ECG signal with small characteristic times of the leading and trailing edges, the obtained result differs considerably from the sum of the harmonic components of the smooth part of the signal. The spectral processing reveals peaks at multiple frequencies, 1.6 Hz, 3.2 Hz, 4.7 Hz, corresponding to a smooth function of P and T waves before the appearance of extra systoles. Based on the obtained data, the frequencies corresponding to the peaks of the cardiogram with a stable sinus rhythm were identified. The acquired data represent regular harmonics, which allow adequate quantitative ECG analysis.
Digital ecg processing, allorhythmia, trigeminy, spectral analysis, ecg harmonic’s characteristics
Short address: https://sciup.org/148326625
IDR: 148326625 | DOI: 10.18137/cardiometry.2023.27.7679
Text of the scientific article Trigeminy electrocardiogram spectral characteristics study
Sergey G. Proskurin. Trigeminy electrocardiogram spectral characteristics study. Cardiometry; Issue No. 27; May 2023; p. 76-79; DOI: 10.18137/cardiometry.2023.27.7679; Available from:
Allorhythmia is the alternation of a stable sinus heart rhythm and extrasystole in a certain sequence. Bigeminy is usually distinguished – when, after a normal atrioventricular pulse (QRS complex) and contraction of the ventricles, follows an extrasystole. Extrasystole is an irregular ECG signal due to ectopic focusing of an electrical pulse in the His bundle.
There are several characteristic signs of the main irregular contractions of heart ventricles: reentry signals, increased automatism of ectopic nodes, and a reperfusion trigger. Trigeminy – appears as one or two stable QRS complexes, followed by one or even two extrasystoles, Fig. 1.
Ectopic nodal (displaced) automatism indicates foci of subpulmonary valvular pacemaker cells that have a sufficient level to excite an action potential. The stable sinus rhythm of the pacemaker cells and the QRS complex raises it to the required repolarization threshold, which leads to an irregular ectopic pulse. This process is the main cause of the arrhythmia due to an excess of neurotransmitters and a deficiency of certain electrolytes, particularly low potassium levels.
Sometimes extrasystoles appear daily, but irregularly, late in the evening, at night, early in the morning. With such irregularity and with normal daytime cardiac studies on the ECG signals, they may not be observed. Then Holter monitoring can be applied for 12 or 24 hours, but this is more long and more complex diagnosis.
This paper a method for studying the regular part of the first lead of the electrocardiogram, with the subsequent appearance of extrasystoles is described. The previously described method of decomposition of the EGC signal (lead I) in the time domain (DMTD) into two signals is used, followed by processing in the spectral region of a smoothly varying signal with P and T waves [1]. QRS complexes and extrasystoles should be processed separately using different technique.
The basis of the electrocardiography methods is the registration of bioelectric potentials on the surface of the skin of the body that occur during the work of the heart. Usually, a standard twelve-signal electrocardiograph is used for this. It captures the difference in electrical potentials from the surface of the body that arise in different parts of the heart at the moments of its contraction and relaxation. In the latest modern
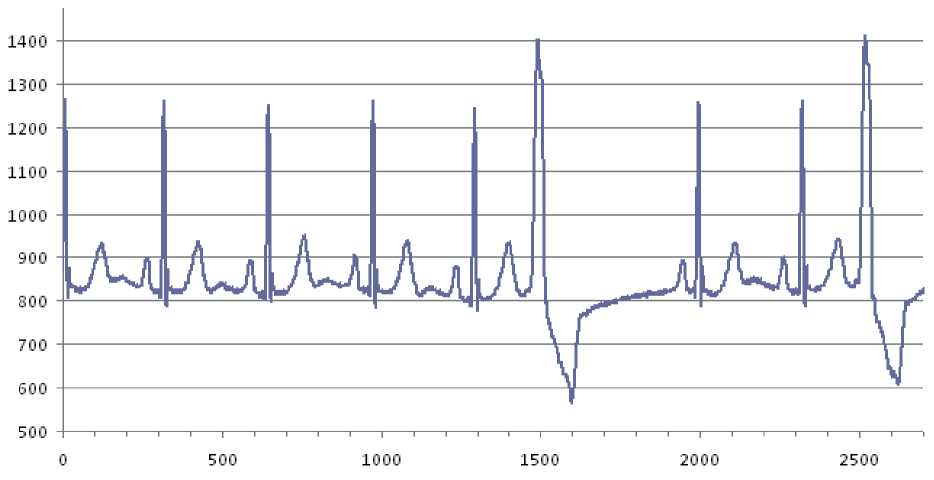
Figure 1. Time dependence of the signal with trigeminy of the first lead of the standard ECG system. The first half of the signal is quite regular, the second part has pronounced extrasystoles. The X and Y axes represent time series (counts) and ECG amplitude (a.u.), respectively.
ECG systems, this information is recorded and further processed digitally.
The current stage of development of information technologies is characterized by the wide use of systems that use various algorithms for digital processing, analyzing and interpreting signals [1, 2], in particular, electrocardiograms (ECGs). The classical approach in electrocardiography consists of various methods for analyzing digitized time series of amplitude of cardiosignals: standard ECG measurement – measuring heart rate, depolarization variance, repolarization variance, etc. However, the existing methods of analysis in the time and spectral domain are not always sufficient to describe all the features of the ECG signals and do not allow to fully reveal there characteristic features [3].
The key problems of the analysis of cardiac signals are not only the detection of complexes and the analysis of their shape, but also the identification of characteristic dependences in the spectrum. In this regard, the use of standard spectral analysis with preliminary application of the method of decomposition of a rapidly changing part (QRS complexes) and a smoothly varying signal (P, T, U waves), which can be represented as a smooth function [4-8], opens up new possibilities.
Materials and methods
For processing and further analysis, a digitized signal of the first lead of a standard electrocardiographic
76 | Cardiometry | Issue 27. May 2023
system was used, containing various noises. The original cardio signal is shown in Fig. 1 as a solid blue line.
The initial data of the ECG signal contains random noise and power-suppy influence, which naturally affect the results of the spectral analysis in the form of high-frequency noise. In the digital representation of the time series of the I-lead, noise is filtered by standard digital algorithms, power-suppy interference, as a rule, is absent. Power-suppy influence and 1/ f noise are effectively removed at the first stage of recording by analog filtering. To minimize the noise component, primary processing in the time domain was implemented – smoothing using Lagrange polynomials [1, 2].
Primary filtering in the frequency domain adversely affects further processing results. After the initial processing of the signal in the time domain, a spectral analysis is performed using the fast Fourier transform to identify the frequency characteristics:
N - 1 - jn-n - k
X ( k ) =— ^x(n)e N
N n= 00
1 N - 1
= £ x ( n )
N n = 0
2 n- n - k . . 2 n- n - k cos - j Sin
NN where 0 < k < N -1, N - number of complex values.
The results of the spectral analysis are shown in Fig. 2.
Note that even after filtering, the resulting signal spectrum consists of more than fifteen harmonics, Fig. 4. Determining the functional dependencies be-
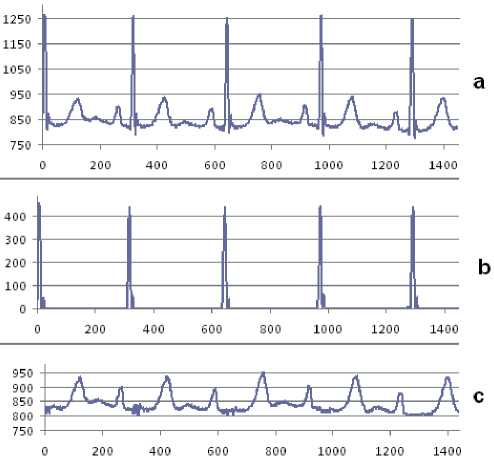
Figure 2. An example of the method of decomposition of the ECG signal in the time domain (DMTD), the initial part of the cardio signal with trigeminy is shown (see Fig. 1.) a – the original ECG signal, b – the signal with QRS complexes, c – the signal after applying DMTD with P and T waves . The X and Y axes represent time series (counts) and ECG amplitude (a.u.), respectively.
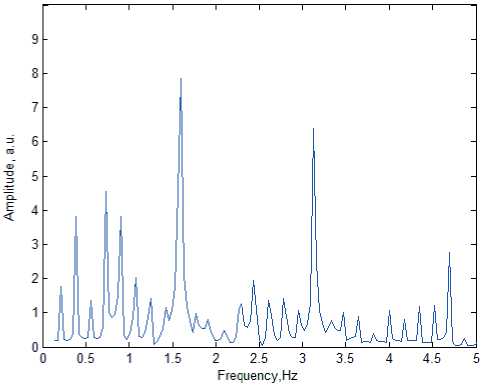
Figure 3. Spectra of the smooth function of the ECG signal after the application of DMTD. Pronounced multiple harmonics are observed at frequencies of 1.6 Hz; 3.2 Hz; 4.7 Hz.
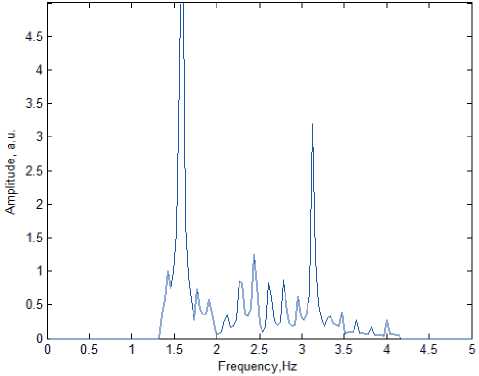
Figure 4. The ECG signal Spectra after applying DMTD and digital filtering of the low and high frequencies. Harmonics are observed at frequencies of 1.6 Hz, 3.2 Hz.
tween the peaks of the cardiogram and the frequencies with such a number of peaks is very difficult. The spectral analysis assumes the presence of periodic but smooth functions. Old analog ECG signals recorded on graph paper, the R peak is approximated by a triangle, since it is somewhat stretched.
The original digitized data show that that peak corresponding to ventricular contraction (QRS complex) is most closely approximated by a δ function with an amplitude 3-5 times greater than that of the P (atrial contraction) and T (ventricular relaxation) waves. This represents the considerable influence on the spectral analysis results. Temporal representation of the ECG signal as two functions, a periodically appearing δ-function and a smooth P and T waves, leads to obtaining spectra with adequately interpreted harmonic components. Smoothing can be done using Lagrange polynomial, r ( λk ), satisfying the fooling conditions [2]:
r (X k) = f (X k), r '(X k) = f'(X k),..., r(mk-1)(X k) = f(mk-1)(X k) (k = 1,2,...., s; m1 + m 2 +.... + ms = m), where f(λ) – a function that is defined on the matrix spectrum;
λ( k ) – zeros of the minimal polynomial ψ(λ) of the matrix;
mk – polynomial degree.
This approach gives the best result of the spectral analysis [1, 3-6]. The signal with a smoothed δ-func-tion and interpolated by the Lagrange polynomial is shown in Fig. 2c. The results of the spectral analysis and the processed signal are shown in Fig. 3 and 4, respectively.
Results and discussion
Using a digital band pass filter [10, 11], the frequencies corresponding to the low and high frequencies of the spectrum were cut out. The result of its application is the apparent disappearance of the peak R, however, the Q and S peaks cannot remain and not change their shape. This result is quite clear, since the R wave is characterized by a large amplitude over a short period of time, which can be interpreted as the result of the superposition of low frequency harmonics and high amplitude, Fig. 2b.
The interpolated signal was Fourier transformed to identify frequencies that characterize the sequential depolarization of the left ventricle with a pronounced extrasystole, presumably due to early ectopic focusing in the His bundle.
On the power spectra, Fig. 3, there are three distinct peaks, with frequencies w1, w2, w3. Calculations of the correspondence of these frequencies to a certain time dependence in this case were not successful. Although the ratio of the amplitudes of the peaks in the spectrum, as a rule, correspond to the ratio of the amplitudes of the peaks of the cardiogram with a regular sinus rhythm [1, 2].
The result suggests that the pulses responsible for ventricular depolarization generated in the atrioventricular node may have a different nature and not be directly related to each other. However, P and T waves should correspond to one harmonic each. Therefore these processes can be roughly described by harmonic components. The frequencies obtained during the quantitative analysis are approximately multiples of two and three.
There are three pronounced harmonics in the spectrum of the received signal: w1 = 1.6 Hz, w2 = 3.2 Hz, w3 = 4.7 Hz. Previously obtained results for an ECG with a regular sinus rhythm corresponded to two frequencies and two harmonics in the spectrum w1, which presumably, correspond to the P wave, and w2 – to the T wave. Also, the ratio of the amplitudes of the P and T waves on the original signal and the results of the spectral analysis were equal too, which may also indicate the adequacy of the initial results. The frequencies of harmonics in the spectrum of a regular ECG signal were approximately a multiple of 2. A similar ratio was obtained earlier for non-mus-cular motility of actin and myosin for the one-celled protista [9]. Why a similar result appears for a human myocard remains as an important question for further research. It can be assumed that the multiple frequencies w1 and w2 correspond to the Q and S waves, which correspond to small characteristic time, what shows the frequencies in the spectral domain.
In the case of an ECG with trigemenia, which is clearly expressed only in the second part of the signal, Fig. 1, and during a standard examination, it may not be observed at all. Spectral analysis of the first part of the signal after applying DMTD with a regular rhythm shows three peaks in the spectrum, which suggests the presence of allorhythmia (bihemenia or trigemenia) when diagnosed at another time.
The results obtained correspond to the adequacy criteria with a sufficiently large coefficient of determination:
r = i -^^ > 0,95.
G tss
The sample variance in this case is determined by the standard formula:
n g2 = — ^ (У - YT)2
n - 1
Calculations of the F -test also confirmed the adequacy of the model to the results obtained as the discrete data.
In addition, the time dependences were restored using the inverse Fourier transform, a method similar to that carried out earlier [9]. The dependences obtained in this way, with good accuracy ( R 2 = 0.92), correspond to the original data, both in amplitude and in phase, Fig. 5.
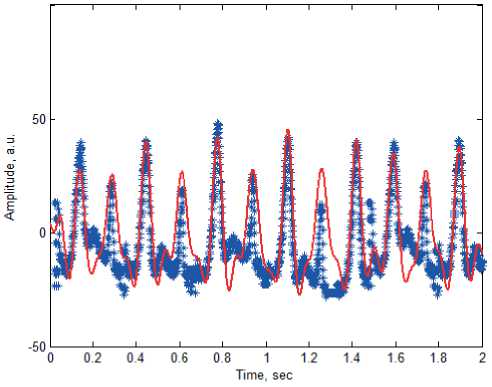
Figure 5. Time dependence of the initial part of the signal of the first lead of a standard ECG system with trigeminy; blue asterisks – are the original signal; red line – is the simulation result.
After obtaining the frequencies corresponding to the P and T waves, the problem was to find functional dependencies between the peaks in the spectral analysis and the ECG waves. Digital filtering was used to solve the problem. In this case, the bandpass filter included frequencies from 0.2 Hz to 5 Hz. Its use made it possible to completely remove the R wave (actually a sharp surge). The result obtained is explained by the fact that the contraction of the heart muscle occurs quite sharply. The R wave is characterized by a short time and a sharp change in the potential difference, depolarization. Since the process cannot be described by a single sinusoidal wave, and, consequently, the peak is characterized by many spectral components of large amplitude with a wide frequency spectrum. When applying a band pass filter to frequencies from w1 to w2, it was found that this region corresponds to the Q and S waves, Fig. 4. The peaks are small and relatively irregular in shape, this explains that the harmonic components lie in this areas.
Note that, after digital processing, the number of harmonic components of the standard ECG signal of the system decreased from 20 to 11. Nine harmonics were considered as parasitic, two frequencies corresponding to the P and T waves were experimentally identified, and two spectral regions corresponding to the RQS complex, which can be combined into a table, similarly as described earlier [1].
Conclusion
This paper describes the results of a spectral analysis of the first lead of a standard digital ECG system of a signal with trigemenia. After applying the signal decomposition method in time domain (DMTD), the cardiogram was filtered of various noises. As a result of digital spectral analysis after that, spectra were obtained that contained eleven peaks, which is approximately nine less than with standard processing.
Smoothing δ-function (the QRS complex) with subsequent interpolation by the Lagrange polynomial significantly reduces the number of spectral components, and made it possible to identify the frequencies w1 = 1.6 Hz, w2 = 3.2 Hz, w3 = 4.7 Hz, corresponding to the first part of the signal without extrasystoles. The remaining frequencies were classified using a bandpass filter and assigned to different regions of the ECG spectrum. Thus, studying the regular part of the cardiogram, without a pronounced allorhythmia, it is possible to identify signs of the possible appearance of extrasystoles at the examination in later time.
Future work will be related to the detailed identification of the spectral components of the regular part of the cardiogram with possible manifestations of bi-geminy, trigeminy, quadrigeminy, as well as the determination of the relationship between diseases of the cardiovascular system and the values of the frequencies of the harmonic components of the signal. An important step in the study of the late part of the cardiogram with pronounced extrasystoles (Fig. 1) will be the use of wavelet analysis [12, 13]. The use of DMTD and the removal of QRS complexes (δ-functions) does not allow the use of spectral analysis, since 10-15 irregular components again appear in the spectrum.
References Trigeminy electrocardiogram spectral characteristics study
- Chereshnev VO, Proskurin SG. Electrocardiography spectral characteristics study using digital fourier transform. Modern high technologies. 2019;8:89-93.
- Chereshnev VO, Proskurin SG. Electrocardiogram frequency characteristics study by processing and analysis of the signal in time domain and spectral domain. Cardiometry. 2020;17:30-3.
- Akselrod S, Gordon D, Ubel FA. Power spectrum analysis of heart rate fluctuation: A quantitative probe of beat-to-beat cardiovascular control. Science. Journal of Electrocardiology. 1981;213(4504):220-2.
- Ryan SM, Goldberger AL, Ruthazer R. Spectral analysis of heart rate dynamics in elderly persons with postprandial hypotension. The American Journal of Cardiology. 1992;69(3):201-5.
- Mashin VA. Factor analysis of the heart rate spectrum. Biophysics. April 2011;56(2):286-97.
- Rudenko M, Zernov V, Voronova O. Fundamental Research on the Mechanism of Cardiovascular System Hemodynamics Self-Regulation and Determination of the Norm-Pathology Boundary for the Basic Hemodynamic Parameters and Analysis of the Compensation Mechanism as a Method of Revealing the Underlying Causes of the Disease. Heart Rhythm. 2012;9(11):1909.
- Soorma N, Singh J, Tiwari M. Feature Extraction of ECG Signal Using HHT Algorithm. Int. J. of Engineering Trends and Technology, 2014;8(8):454-60.
- Murthy VK, Grove TM, Harvey GA, et al. Clinical usefulness of ECG frequency spectrum analysis. Proc. Ann. Symp. Comput. Appl. Med. Care. 1978:610-2.
- Proskurin SG, Avsievich TI. Spectral analysis of self-oscillating motility in an isolated plasmodial strand of Physarum polycephalum. Biophysics. 2014;59(6):928-34.
- Avdeeva DK, Kazakov VY, Natalinova NM, Ivanov ML, Yuzhakova MA, Turushev NV. The simulation results of the high-pass and low-pass filter effect on the quality of micropotential recordings on the electrocardiogram. European Journal of Physical and Health Education. 2014;6:1-10.
- Fedotov AA. Selection of Parameters of Bandpass Filtering of the ECG Signal for Heart Rhythm Mon-itoring Systems. Biomedical Engineering. 2016;50:114-8.
- Forogran MA, Kogevin AV. Statistical comparison of wavelet transforms. Vestnik TSTU. 2017;1:61-71.
- Dubrovin VI, Shchedrina TA. Automated system for analyzing electrocardiograms based on wavelet technologies. Artificial intelligence. 2010;4:190-4.
