Two Approaches Based on Genetic Algorithm to Generate Short Iris Codes

Author: Hamed Ghodrati, Mohammad Javad Dehghani, Habibolah Danyali
Journal: International Journal of Intelligent Systems and Applications(IJISA) @ijisa
Article in issue: 8 vol.4, 2012.
Free access
This paper has the following contributions in iris recognition compass: first, novel parameters selection for Gabor filters to extract the iris features. Second, due to iris textures randomness and assigning the Gabor parameters by pre-knowledgeable values, traditionally, a large Gabor filter bank has been used to prevent losing the discriminative information. It leads to perform extracting and matching the features heavily and on the other hand, the generated feature vectors are lengthened as required for extra storage space. We have proposed and compared two different approaches based on Genetic Algorithm to reduce the system complexity: optimizing the Gabor parameters and feature selection. Third, proposing a novel encoding strategy based on the texture variations to generate compact iris codes. The experimental results show that generated iris codes by optimizing the Gabor parameters approach is more distinctive and compact than ones based on feature selection approach.
Iris recognition, Feature Selection, Feature Extraction, Gabor-wavelet, Optimization, Genetic Algorithm
Short address: https://sciup.org/15010297
IDR: 15010297
Text of the scientific article Two Approaches Based on Genetic Algorithm to Generate Short Iris Codes
Published Online July 2012 in MECS
In recent years, we witnessed the more interest in replacing the traditional human identification methods with biometric technology. In traditional methods (e.g. ID cards and passwords), the identification tools can be easily stolen, shared or forgotten. Biometric technology involves in the use of unique characteristics for automatic identification or verification. These characteristics can be grouped into broad categories: behavioral and physiological. At present, iris is the most accurate and reliable one among the biometric traits.
The iris is a ring shaped region between pupil and sclera, which controls the amount of entering light into the eye through the pupil. It contains rich textures due to interlacing tissues such as freckles, coronas, stripes, furrows, rings, crypts, etc. These patterns are randomly formed during the first year of life, and will be invariable thereafter. Based on these observations, Flom and Safir [1] reported that the iris exhibits the sufficient distinctiveness and stability in order to use as a biometric signal. Statistical analysis of the iris textures by Daugman [2],[3] confirms the favorable uniqueness as the complexity of phase information spans about 249 degrees of freedom. Furthermore, iris is a visible internal organ and therefore it is possible to capture the iris image in a noninvasive way. The reliability and conveniency of the iris recognition is a response to the high demands for security.
A general framework of the iris recognition contains four main steps: image acquisition, preprocessing, feature extraction and feature matching. This paper deals with the feature extraction step. Up to now, many approaches have been proposed to represent the iris patterns. Gabor-wavelet [2],[3], Laplacian pyramid [4], zero-crossing of 1D dyadic wavelet transforms [5], Hilbert transform [6], 2D wavelet transform [7]-[9], Discrete Cosine Transform [10], 2D discrete Fourier transform [11], contourlet transform [12] and ordinal measures [13], are well-known methods which based on mapping to the transform domain to represent the iris patterns. Some authors directly used the structural iris patterns to generate the iris feature vectors. Segmenting the blobs of interest (BOI) by zero-crossing wavelet [14], local histogram equalization and a quotient thresholding [15], extracting iris speckles [16] and shape analysis techniques for near infrared (NIR) and visible light (VL) images and fusing them [17], are the handful of structural iris representation. The implemented systems by all of the above methods have shown the encouraging experimental results. However, only the Daugman's approach [2],[3] has been tested on the large-scale iris database, which still exhibits high accuracy. Daugman generated the iris codes by 2D Gabor-wavelet and then quantized the phase of each response filter into a pair of bits so that each iris code contains 2048 bits. Since Daugman's method has been commercialized by Iridian [18], the details of this algorithm have not been explained. Nevertheless, Daugman Gabor filtering has been a paradigm as many researchers described the iris patterns like Daugman's with some modifications. Among these endeavors, it seems some issues are open to further investigations. In the Daugman-like algorithms, Gabor parameters are devoted by the straightforward values, which they may not be optimum due to the randomness of the iris textures. In order to prevent losing the information in these methods, the Gabor filter bank is enlarged by using the different values for each parameter. As a result, extracting and matching the features would be slowly done while the generated feature vectors are lengthened as required for extra storage space. To solve this problem, two approaches have been addressed in this paper: optimizing the iris representation and feature selection. Former works on the fact that the iris textures periodically scatter with the central frequency in some dominant directions. Thus finding these optimum values guarantees the generated iris codes fulfill the expected discrimination. The latter describes when the applied filter bank is large, not all extracted features are effective. Therefore, this approach searches for the relevant features in a feature pool. Which one is better is what we intend to explore in this paper. Another issue, which is required to consider, is to encode each coefficient of a filtered image into two bits using Daugman phase quantization. Therefore, the length of generated codes is twice longer than the feature vectors. We have proposed a novel encoding strategy based on the local variations of iris textures to equalize the length of iris codes and iris features. These deliberations can be effective in many applications particularly when the speed is needful, such as a passenger control in airports, and when the memory is limited such as cell phones.
The rest of this paper is organized as follows. Next section provides a literature review of applying Gabor filter to the iris images. The principles of the proposed iris codes generation are presented in section III. The optimized Gabor wavelet and the feature selection approaches are discussed in section IV and V, respectively. Experimental results of the implemented system are shown in section VI and finally section VII concludes the paper.
-
II. Review of Iris Gabor Filtering
At first, the segmented iris region is normalized to a fixed rectangular block through Daugman rubber sheet Model [2] ,[3]. Gabor filtering has been known as a multi-resolution analytical tool, which provides good spatial-frequency decomposition in various orientations within image textures. From the point of view of the texture analysis, iris textures jointly contain scale
(frequency) and orientation information. Therefore, invoking to the Gabor filtering is reasonable to represent the iris patterns. The 2D Gabor filter can be applied to the normalized image in two manners. First, a 2D Gabor filter is locally applied to the normalized image and the features are globally extracted. In these methods, at first, the normalized image is divided into some image blocks, whether overlapped or not. Then Gabor filter bank is applied to each image block (local applying) and obtained only one coefficient (global extraction) for each filtered image block [2] ,[3] ,[19] [26]. In the second approach, a Gabor filter bank is globally applied to the normalized image and the features are locally extracted. The scholars, who adopted this method, convolved the whole normalized image with a bank of Gabor filters (global applying), whether the filter size is the same as the iris plane or not. Then filtered image is partitioned into some sub-blocks and features are extracted from each block (local extraction). The proposed systems in [27] -[31] are based on the second approach. The effects of the noise factors such as eyelids, eyelashes and reflections in obtained features, can be more reduced using the first approach. Therefore, in this paper, the features are extracted by the first approach of the Gabor filtering.
The complex 2D Gabor filter is a Gaussian kernel function modulated by a sinusoidal plane wave with the aim of localizing the frequency of a sinusoidal function. To decompose the iris image by Gabor-wavelet, Daugman proposed the following equation in polar coordinate:
H ( P0, Ф0 ) = I ( Po, Ф0 )* G ( Po, Ф0 ) =
JJ I ( P , Ф ) e -™( Ф о - ф ) e -(P o - P ) 2/ a 2 -( Ф о - ф ) 2/ в 2 p d p d ф
РФ
where * stands for convolution, a and в are the multi-scale 2D wavelet size parameters, to is the wavelet frequency and ( P , ф 0 ) is the center of each normalized iris patch (i.e. image block), I ( P , ф ) . Note that P is selected from interval [0,1] and ф changes in angular range [0,2 n ]. The rationale behind dividing the iris plane to some image blocks is to control the redundancy through sampling points ( P , ф ) . As mentioned earlier, Daugman have not detailed his algorithm and just mentioned a and в spanning an eight-fold range from 0.15 to 1.2 mm while co-vary in inverse proportion to to . The obtained coefficient, H ( P , ф ) , is a complex value. We use Cartesian form of 2D Gabor-wavelet as defined:
H ( x 0 , У 0 ) = I ( x 0 , У 0 ) * G ( x 0 , У 0 ) =
, - 0 .5 ( ( x 0 - x ) 2/ a 2 + ( y 0 - У ) 2/ в 2 )
III (x, y ) e e ' dx dy xy
where:
x ' = ( x 0 - x ) cos 9 + ( y 0 - y ) sin 9
In this form x e [ 1, M ] , y e [ 1, N ] where M and N are the number of rows and columns of rectangular normalized iris, respectively. 9 is the orientation which has been introduced by ф in (1) so that seems the polar form has less parameters than Cartesian form.
-
III. Proposed Iris Code Generation
-
A. Gabor parameters selection
Selecting the Gabor parameters is pivotal in describing the iris patterns. The Gaussian term in (2) is effective as long as its power be equal or greater than -4 (exp (a) ≈ 0 when a< -4). As a result, we have:
(x -x0)2/a2 +(y -y0)2/в <8 (3)
This equation is an ellipse with axes2-V2aand2V2P in the center (x 0,y 0 ) . So:
-2'Па <(x - x0 )< 2p2a-2^P <(y - y о )< 2V2P
Further inspecting the iris textures indicates the iris patterns spread in radial direction periodically [24], thus main variations are achieved in angular direction corresponding to horizontal direction in the normalized image. Let T = — be the period of the aforementioned variations which to = 2nf . We suppose that there are p resonances in horizontal direction for each image block. The mathematical expression of the above hypothesis is pT = 4>j2p +1. In our experiments, we observed that the symmetric filter has a significant effect on the accuracy. Therefore, the size of filter, which is the same as the image block size, will be an odd number i.e. n = 2k +1 = pT which each image block has size n by n. Therefore, we have:
P 2 2
2 p n to = —— =
n
2 p n 4^2 p + 1
Consequently, Daugman has implicitly indicated that the scale parameters, a and P , have inverse proportion to to and hence; he called this type of filtering "wavelet". The aspect ratio у = a exhibits ellipticity, which varies
P in shape from a circle (at y = 1 ) to a line (at y = 0 ). Daugman supposed y = 1 while we intend to optimize this parameter with the other parameters in the next section. Due to undetermined structure of the iris patterns, using the filters with single scale is a risk as leads to lose the information. We use a Gabor filter bank including 16 filters in four scales P, 2P,3P, 4P, and four orientations ato п n 3^. For each horizontal ,4,2, 4
scale, P , corresponding vertical scale, a , is gotten based on the aspect ratio while the corresponding frequency is obtained by (6). The real part of Gabor filter is not strictly band-pass (unlike the imaginary part). This challenge leads to appear the iris codes with significant numbers of one or zero when the illumination varies. To prevent this, like Daugman [2], we truncate the dc component. This is done by subtracting the sum of the real part of the Gabor filter coefficients to each coefficient and so the dc component is set to zero.
-
B. Feature encoding
Preferably, in order to decrease the burdens of storing the templates, some authors convert the real-valued feature vectors to binary streams, namely iris codes. The most popular encoding strategy is Daugman phase quantization. It appropriates one bit to each real and imaginary part of each coefficient, H ( x 0, y 0 ) , based on their sign. Therefore, the length of the iris code is twice as the feature vector dimension. As mentioned earlier, iris textures variations are remarkable in the horizontal direction in the normalized image. In light of the observations, we proposed a novel encoding method as follows:
C „ = 1
N z { H p. + x
0, otherwise
( x 0 , y 0 ) } > Z { H p , q ( x 0 , y 0 )} | (7)
For p = 1,2,..., P and q = 1,2,..., Q - т ; where P and Q are the number of the image blocks in the vertical and horizontal direction, respectively. The Z { • } can be considered either amplitude or phase so that their effectiveness will be evaluated based on the experiments. In addition X is a positive constant which controls the comparison length. We choose it large enough to limit the effects of the blurred images on the performance when the image acquisition system has poor focusing. However, when the captured images are not too smooth, the value of X is selected small. In addition, when the whole of the normalized image is used for recognition, the value of т is set to zero and running the (7) periodically, otherwise the value of T is equal to X . With this new encoding method, the length of binary iris codes is limited to the number of features.
-
IV. Optimized Gabor Filtering
The Gabor parameters are assigned by pre-knowledgeable values. To cover the whole solution space, various values are used for them. This allocation imposes computational complexity to the system through enlarging the filter bank. To avoid this, optimizing the Gabor parameters is an alternative for effective iris representation. Notably, on one hand, iris textures variations have a narrow bandwidth with a dominant central frequency [19] and on the other hand, as our experiments show, the orientation information is more distinctive than the frequency information. Optimizing the Gabor parameters makes an opportunity to find the dominant frequency and orientations with minimum filter bank size as well as improving the accuracy. In this study, the orientations, scales, resonance value p and aspect ratioγ , are optimized by genetic algorithm (GA). Selecting the objective function is a challenging work in the optimization applications. Chou et al. [28] used discrimination index as objective function for optimization of Gabor parameters by GA. The discrimination index is a metric to evaluate the intra-class (authentic) and inter-class (imposter) distributions, which is defined below.
d = J µ a - µ i I (8)
σ a 2 + σ i 2
Note that µ and σ are mean and standard deviation of each distribution while 'a' and 'i' subscripts indicate authentic (intra-class) and imposter (inter-class) distribution, respectively. Each biometric system works in two modes: identification and verification. In the identification mode, the signature of each individual is compared against all templates of database (one-to-all) and will be eventually assigned to the most similar class. Correct Recognition Rate (CRR) is used to evaluate the identification mode, which is the ratio of the number of correct classifications to the total test samples. The verification mode involves matching the obtained signature against the claimed class by the user (one-to-one) and the request is accepted when the similarity value is larger than a specified threshold. The Hamming distance (HD) is used as dissimilarity metric in our experiments. The performance of verification mode is determined by Equal Error Rate (EER), which refers to error percentage when False Accept Rate (FAR) equals to False Reject Rate (FRR). Tsai et.al [29] adopted particle swarm optimization (PSO) to minimize the EER as objective function for optimizing the Gabor parameters. EER is a counting-based parameter; in other words, EER supposes same worth to an authentic user when he/she is rejected whether the HD is little larger than separation threshold or too larger (in similar way, imposter user when he/she is accepted whether the HD little smaller than separation threshold or too smaller). In contrast, discrimination index (d) is affected by too far HD whether for authentic or imposter person. Besides, we observed that using only the EER as an objective function leads occasionally to have low CRR while EER has been become minimum. To take the advantages of these three parameters, the fitness function is introduced as follows:
f = EER (%) - CRR - 5 µ a - µ i (9)
In fact, we present multi objectives by a single objective function. This configuration of GA optimization problem is so-called multi objective GA (MOGA) in the literature. GA minimizes the fitness function. However, one can convert the minimization problem to maximization problem by using the negative form of fitness function. By taking into consideration this point, two last terms in right side of (9) have negative sign. We prefer that the objective functions to be in the same range. So, the EER is represented in terms of percentage in the last equation. Furthermore, since the value of µ a - µ i rarely greater than 0.2 even at accurate recognition rate, so the last term of (9) is weighted by five. In order to find the optimum Gabor parameters by MOGA, a part of data is used as training set.
-
V. Feature Selection
-
A. Feature Selection Problem
Applying a large filter bank to represent the iris patterns, on one hand, increases the system complexity and on the other hand, causes to appear the features, which have no effect or poor effect on the performance (i.e. useless features). In addition, it leads to generate the features which correlated with the other independent features (i.e. redundant features). Hollingsworth et al. [32] enumerated the main sources of error in the iris biometric. They proved the existence of fragile bits in an iris code empirically and theoretically. They remarked that some inconsistent bits arise from the complex coefficients, which are close to axes of the complex plane. By considering these points, one can use the feature selection approach to remove the irrelevant features and saving the relevant features to hold up the discrimination power. Feature selection is taken into account as a post-processing sub-step for feature extraction step. Although this sub-step speeds up the matching step and decreases the storage space requirements, it does not have any effects on the feature extraction routines. The optimized Gabor wavelet, which was introduced in the previous section, can provide a small filter bank. Hence, the extracted feature vectors are shortened. Nevertheless, the number of Gabor parameters should not be less than a minimum value. Therefore, the length of feature vectors will be confined in the first approach. Although the feature selection approach is not able to improve the feature extraction, unlike optimized Gabor-wavelet approach, it can provide a possibility to search the shortest feature vector. Another issue in this area, is generalization, in content that how the learning algorithm is stable in meeting the unseen test data. In other words, when the selected features which satisfied the minimum training error (empirical risk), are applied to the test data, would not conduce large generalization error (i.e. having no overfitting). The feature selection problem is described as selecting m prominent features from the M original features. There are 2M subsets for selecting, whereas it is obvious this exhaustive search is impractical in many applications. The selection is accomplished in two ways: one can put a constraint so that the m is fixed and trying to find a subset that delivers best accuracy; or searching for a subset, which makes best tradeoff between complexity and accuracy. The methods for selecting the relevant features can be grouped in two categories: filter methods and wrapper methods [33]. The filter methods are open-loop processing based on the inherent statistical relations between the features without any criteria for performance evaluation. As an instance of filter approach, one can point to Principle Components Analysis (PCA) as an orthogonal tool for feature projection and reduction. In PCAs, at first, the covariance matrix is constructed by using all feature vectors of training set irrespective of their class labels. Each eigenvalue of obtained covariance matrix represents a portion of variation in the data [34]and the reduction is achieved by finding m first large eigenvalues. In the papers [35]-[42], reducing the iris feature dimension was done by the methods based on the filter approach. In the wrapper methods, an induction process is carried out for each selected subset and evaluation result is fed back to the system for the next selections. Wrapper methods due to iterative structure (i.e. made by inductive feedback), compared to the filter methods, are very computationally complex. However, the filter methods do not guarantee that overfitting problem is not occurred. The wrapper approach is efficient when the dimension of original feature vector, M, is large. Genetic Algorithm (GA) is a popular optimization technique as one of its applications is the feature selection. In this paper, GA is adopted for feature selection in wrapper style and the details of this methodology are presented in the next sub-section.
B. GA Feature Selection
In order to select the prominent features, we require two sets; including training and test sets. In the training mode, the algorithm generates various combinations of features to measure their performance. Clearly, each feature can be labeled as relevant or irrelevant. Therefore, we deal with a reciprocal problem. Accordingly, binary GA is exploited as feature selection algorithm in this paper. The length of each chromosome is the same as the length of the original feature vector, M, and each gene is set to '1' for selected features and '0' for eliminated features. The proposed fitness function to find the optimum feature subset is defined as follow.
be minimized to reach the minimum classification error. M is the number of total features and m is the number of selected features in each chromosome. The complexity criterion is based on the numbers of selected features, m . Having less m means shorter feature vector (i.e. lower computational complexity) and so it is desirable to minimize the m . A Pareto optimal set is a set of solutions that are non-dominated with respect to each other [43]. Although the adding more features does not necessarily improve discrimination performance [44], the accuracy depends on complexity to some extent. In our application, non-dominated solutions are related to decide about having high accuracy or short feature subsets. To this end, we make a tradeoff between complexity and accuracy by adopting the weighted sum approach. The Pareto optimal solution set is evaluated by converting the multi objective optimization problem to a single objective optimization problem. Notably, it requires to be normalized the objective functions if their ranges are known. In many applications, it is not possible to determine the range of the objective functions. In our problem, the range of m is between 0 to M but the range of f cannot be determined. In these cases, the objective functions are put in a range close together like the introduced fitness for optimizing the Gabor wavelet. This theory is considered in (10) through dividing m by M . Likewise, wi denotes the weights and must have £ w, = 1 to make the decision. The weights values have impact on the evaluation of Pareto optimal set. According to the minimum description length principle (MDLP), a simple model is better than a complex model [44]. MDLP is interpreted as preferring to have shorter feature vector even though the classification error is increased in training mode. According to these concerns, the important question is how much this reduction costs. This problem is analytically investigated as follows. Let F i and f i be the final performance and accuracy of i th solution, respectively. Suppose that the code length of one of the solution is m and the other one is m -1. The final performances of these solutions are obtained as following:
m
2 M
m - 1
2 M J
By subtracting the first equation from the second one, we have:
F 1 - F 2 = w 1
f ‘ - f ’ )+ w 2 MT
F = w ff + w 2
m
M
We suppose that reducing one bit from the code length leads to improve the final performance while it is possible to sacrifice the accuracy. Therefore F < F and by considering the last equation, we have:
In this equation, F is final performance and f is accuracy criterion, which is obtained from (9) and must w2 wM
Where w 2 is maximum allowable error (accepted wM risk) for reducing one-bit form the code length. The tradeoff between accuracy and complexity is based on the weights. The priority of accuracy is more than the complexity and we therefore suppose w1 larger than w2 to reduce the above accepted risk. It is worth mentioning that GA does not guarantee to find the best solution for a problem. However, the obtained solution is close to the optimum solution in an acceptable time. The authors of [45],[46] used GA for feature selection in their iris recognition systems.
-
VI. Experimental Results
In this section, the performance of the proposed Gabor wavelet is determined. Then the efficiency of two approaches, which used for decreasing the system complexity, is also compared.
In our implementations, two public iris databases are used: CASIA-IrisV3-Interval database [47] and UBIRIS V1 database [48]. CASIA-IrisV3-Interval database contains 2655 iris images from 396 different classes of 249 subjects. The iris samples were collected under NIR lighting. Each 8-bit gray-scale iris image is saved as JPG format with resolution of 320×280 pixels. UBIRIS V1 database contains 1877 iris images, which were collected under VL lighting in two sessions. In the first session, 1214 images are captured from 241 individuals while in the second session; only 132 individuals have been participated to capture 663 images. The 24-bit RGB color iris images are saved as JPG format with resolution of 800×600 pixels. We find out that using the red band of the RGB image rather than converting it to gray-scale, provides better contrast. In addition, we resize each iris image of this database to 400×300 pixels. Therefore, before applying the iris images from UBIRIS database to the system, the red band information is picked out while its size is downsampled by 2.
(a)
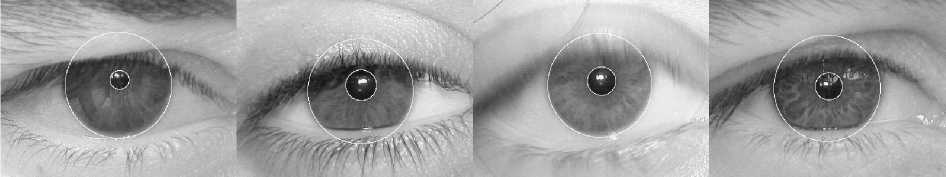
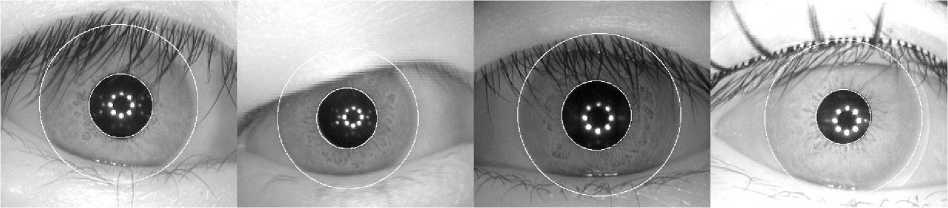
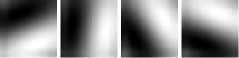
Fig. 1. Some localization results for samples from (a) CASIA database (b) UBIRIS database
The iris region is detected by fitting two circles for inner and outer boundaries. Hough transform is used for finding the circle parameters (i.e. radius and center) based on extracted edges. Figure 1 shows the localization results on two databases. Then, iris region is transformed from Cartesian to polar coordinate system by Daugman rubber sheet. The normalized image size will be M xN = 64 x 512. We do not intend to involve ourselves in removing the noise factors such as eyelashes and eyelids from the iris region, and only try to follow an effective approach to represent the iris patterns for future applications. To our knowledge, the right upper quarter of iris plane is mostly robust to occlusion by eyelashes and eyelids. Therefore, this part of the normalized image is used for feature extraction as region of interest (ROI). Enhancement is a pragmatic approach to eliminate the unpleasant factors, which are accompanied the iris images during acquisition, such as the spiky noises and non-uniform illuminations. For this sake, the histogram of the ROI image is equalized and then a 2D wiener filter is applied to the resulting image. After all, the enhanced ROI is divided to 128 image blocks with size 9x9 as P=4 and Q=32. Therefore, some of the image blocks have overlapping with each other. The proposed Gabor filter bank (without any optimizations) is applied to the each image block and in the sequel, 2048 coefficients are obtained. The database includes three templates for each class to be matched against the probe images and the average HDs of them is considered. Thus, we have to use the iris classes, which contain at least four images, three for enrollment and the others for recognition. Likewise, in some images due to serious eyelid occlusion, the ROI image does not exhibit noticeable biometric signals. Keeping these two aspects in mind, we select out these images. Thus, for CASIA database, 2125 iris images from 295
classes, and for UBIRIS database, 1179 iris images from 107 classes for second session, are remained to from 237 classes for first session and 517 iris images use them in our experiments.
TABLE 1. Recognition results of applying the Gabor-wavelet with non-optimum parameters
|
CASIA |
UBIRIS (Session I) |
UBIRIS (Session II) |
|||||||
|
encode1 |
encode2 |
encode3 |
encode1 |
encode2 |
encode3 |
encode1 |
encode2 |
encode3 |
|
|
CRR (%) |
99.76 |
99.68 |
99.36 |
99.57 |
98.29 |
98.08 |
98.98 |
98.47 |
94.39 |
|
EER (%) |
0.71 |
0.24 |
0.57 |
0.60 |
1.28 |
1.28 |
2.56 |
1.64 |
3.06 |
|
d |
5.62 |
5.21 |
4.73 |
5.20 |
4.36 |
3.96 |
3.87 |
3.78 |
3.20 |
|
Code Length |
4096 |
1984 |
1984 |
4096 |
1856 |
1856 |
4096 |
1856 |
1856 |
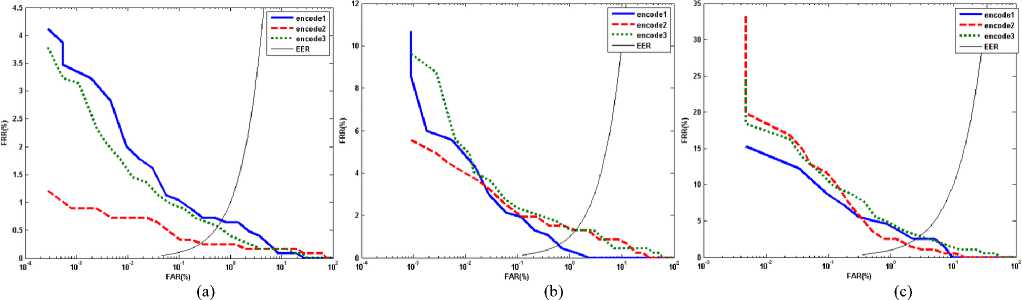
Fig. 2. ROC curve for three encoding methods on the database (a) CASIA (b) UBIRIS session I (c) UBIRIS session II
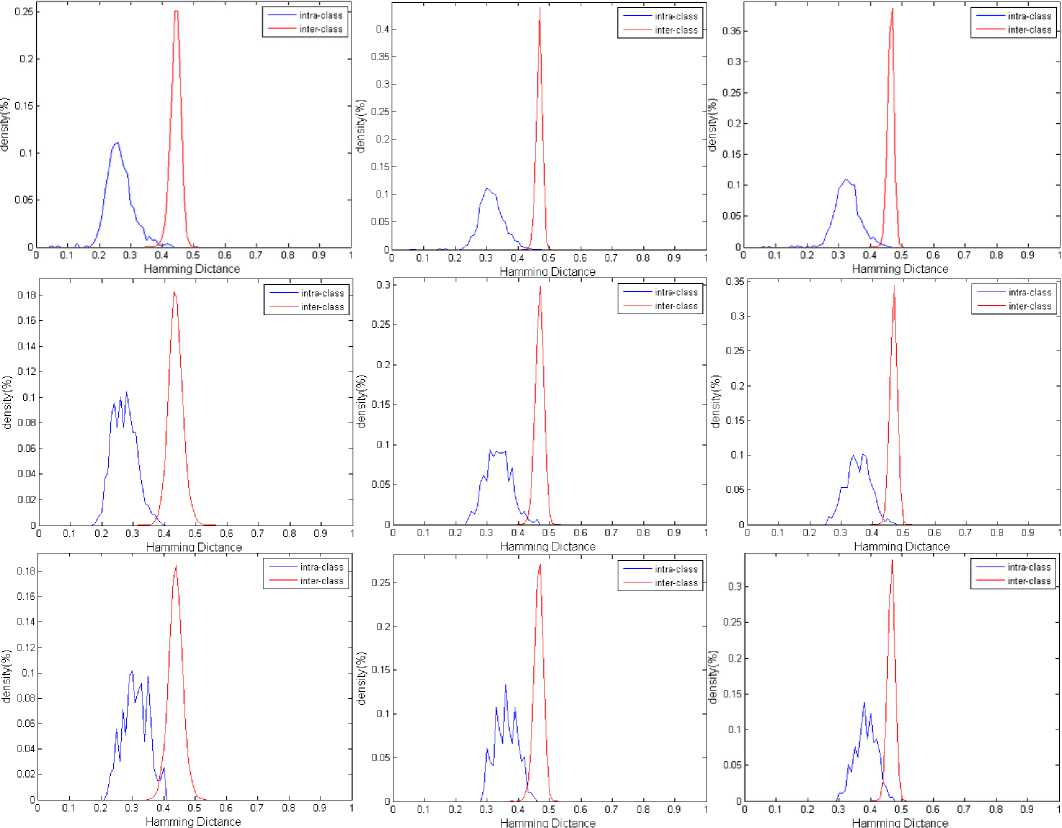
Fig. 3. Density distribution of intra- and inter-class for encode1 to encode3 from left to right in each row on the CASIA (upper row), UBIRIS session I (middle row) and UBIRIS session II (down row) databases.
Comparatively, the iris codes are generated by encoding the feature vectors via Daugman phase quantization and the proposed encoding method, which is based on quantizing the variations of the amplitude or phase (see (7) in section III). Hereinafter, phase quantization method will be termed "encode1", amplitude variations quantization will be termed "encode2" and phase variations quantization will be termed "encode3". The parameter of X in (7) is chosen 1 and 3 for the images of CASIA and UBIRIR database, respectively. We consider larger value for X in the images of UBIRIS database because some images are blurred due to moving or bad focusing especially in the second session. To align the probe images, the rotated iris images are synthetically obtained by horizontal shifting of normalized iris in a range between -15 ̊to +15 ̊ by steps 2.5 degrees. They are matched against each class and the minimum HD within them is regarded as final HD between the probe image and each class. The results of applying the Gabor-wavelet with non-optimum parameters for three encoding methods are provided in Table 1. Receiver operating characteristic (ROC) curve (i.e. FAR versus FRR) and the density distributions of intra- and inter-class are shown in Figures 2 and 3, respectively for three encoding methods on the each database. The results on the UBIRIS database show some degradation in the performance due to the various noise contributions especially in the second session. The non-ideal images of the UBIRIS database is distorted by the occlusion of eyelids/eyelashes, motion blurring and defocus blurring which were captured in unconstrained environment. The evaluations of the obtained results thus far have shown that for the proposed encoding method, using the amplitude variations (i.e. encode2) is more discriminant than phase variations (i.e. encode3). Therefore, we only consider the amplitude variations for proposed encoding in the later evaluations.
-
A. Evaluation of optimized Gabor-wavelet
The efficiency of the proposed optimization of Gabor-wavelet is testified in this sub-section. For each database, the training set contains 30 iris classes, which are randomly selected. For UBIRIS database, training set contains the images from the first session and the optimized Gabor parameters are tested on both sessions. Each generation contains 100 individuals, the parents are selected by tournament function, and the crossover fraction is 0.7 while mutation rate is determined by the variables bounds. To accelerate the convergence, the range of the aspect ratio у and the resonance value p are limited to [ 0.5,1 ] and [ 1.5,3.5 ] , respectively. The recognition results of feature extraction by the proposed optimized Gabor-wavelet are brought in the Tables 2 and 3 for CASIA and UBIRIS databases, respectively. As can be seen in these tables, Gabor filter banks are presented in various combinations of scales (frequencies) and orientations. Interestingly, the Gabor filter bank with four orientations and only one scale (i.e. four filters) provides best tradeoff between accuracy and complexity. In some cases, increasing the number of Gabor parameters, improves the accuracy, however, in the other cases this result is reversed. This breakthrough can be interpreted by the existence of major frequency in the iris textures, which is adequate for effective representation. Sometimes, the secondary frequencies cope to this end even better whereas that brings complexity to the system. In addition, based on the obtained results, one can conclude the orientations information is discriminant than the frequencies information. The optimized Gabor filter banks with four orientations and one scale for each encoding method and database are shown in Figure 4. Furthermore, in facing the noisy images requires to the iris codes with larger length for better recognition. The reason of degrading in recognition results by encode2 for the images of UBIRIS database, is to generate shorter iris codes than phase quantization ones, not for the intrinsic property of proposed encoding.
aim
(a)
□□□□
^J^^
(b)
r ГГТ
(c)
2Г1L12
(d)
Fig. 4. Optimized Gabor filter bank for databases: (a), (b): CASIA and (c), (d): UBIRIS, which (a), (c) as to encode1 and (b), (d) as to encode2. In each illustrated filter bank, top and bottom row shows the real and imaginary part, respectively.
-
B. Evaluation of Feature Selection Approach
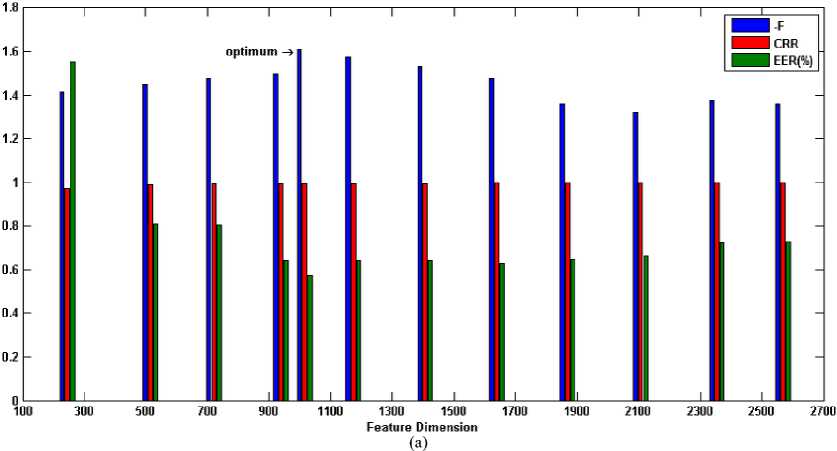
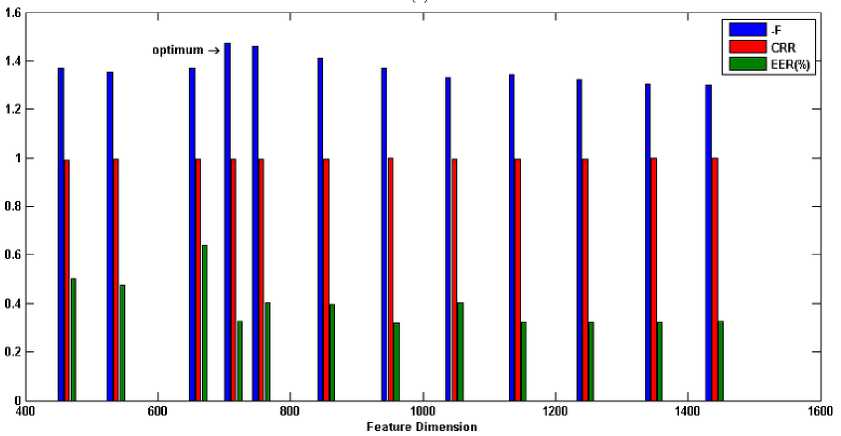
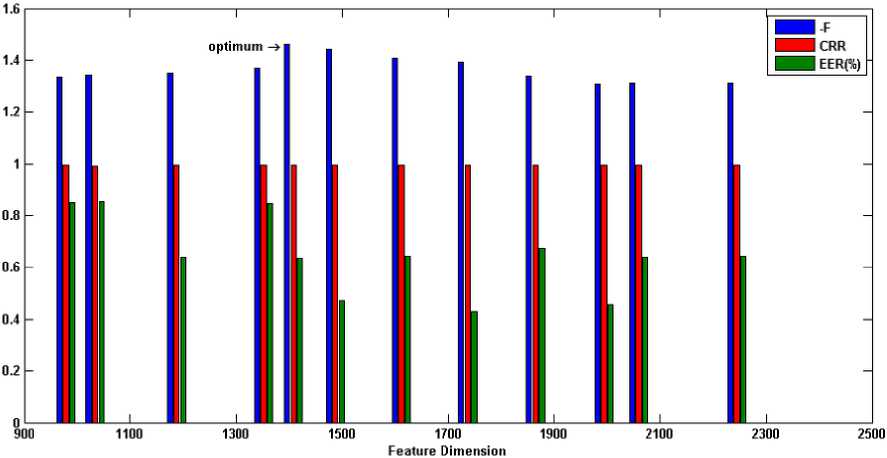
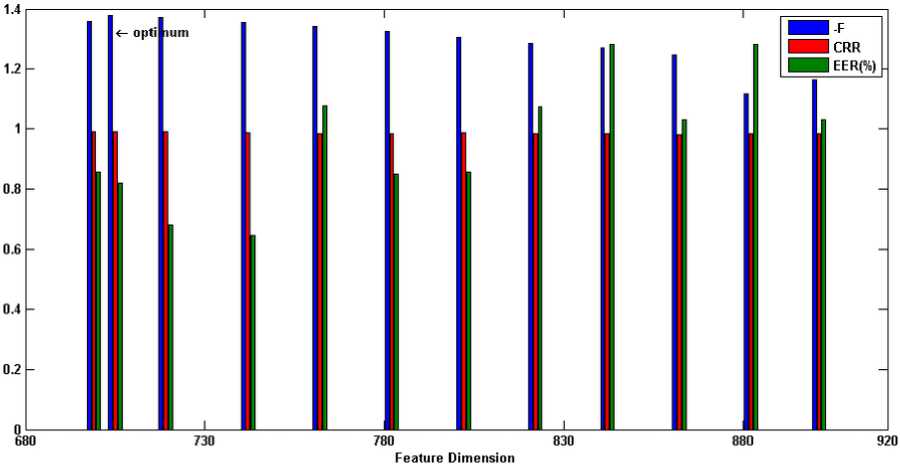
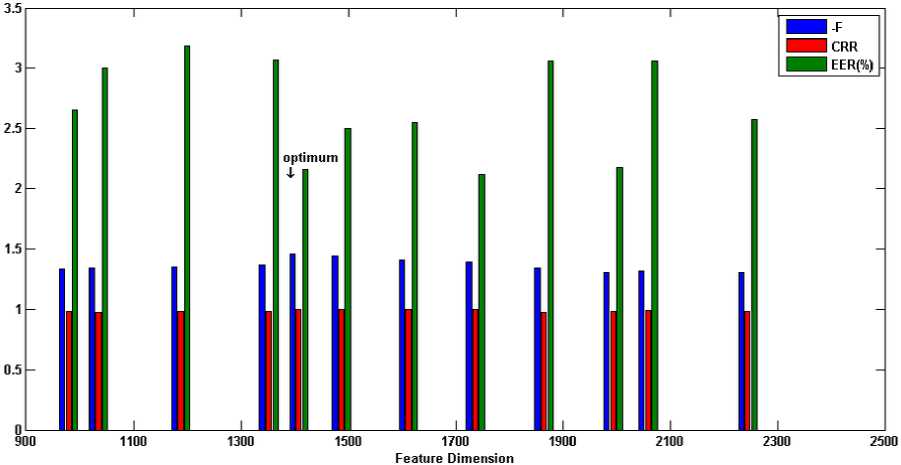
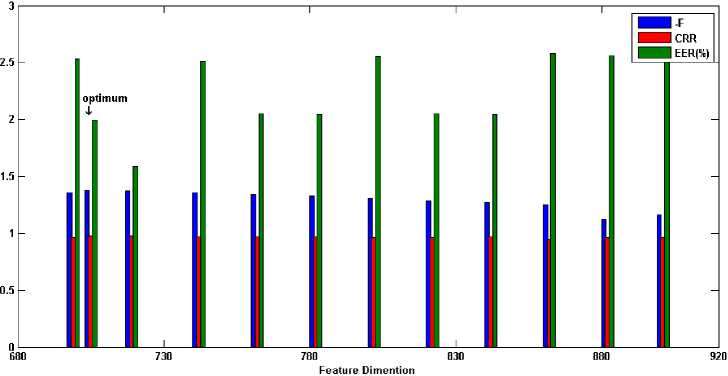
Binary MOGA is exploited in this sub-section to find the optimum feature subset through various generations. Each generation contains 100 individuals with crossover fraction 0.7 and mutation rate 0.2 which the parents are selected by tournament function. For introduced fitness function (section V), the weights values are chosen by giving the higher priority to accuracy than the complexity as w1=0.8 and w2=0.2. In our implementations for feature selection approach, the training set contains those 30 iris classes, which were used in the previous sub-section for optimization of Gabor-wavelet. Then, the optimum feature subset will be used for all classes. The recognition results on the training set and all classes for the optimum selected features are listed in Table 4. In order to evaluate the optimum feature subset and inspecting the generalization error, the recognition results for different dimensions of selected feature subsets are shown in Figure 5. CRR is brought in the range of 0 to 1 for better comprehension. Additionally, the obtained fitness in the training mode is shown for each feature dimension in the negative form to represent conveniently. As can be seen from this bars in this figure, although some feature subsets are not optimum, they show better recognition results for all classes (for example, see the eighth bin of Figure 5(c)). This drawback arises from some factors: 1) Finding the best values for the weights is a challenging work. 2) For training set, it is possible to obtain impressive recognition results by a feature subset with a lower dimension. However, while this feature subset is generalized to all classes as optimum feature subset, the promising discrimination is not achieved due to lack of features. For this reason, in selecting the weights, we let the accuracy takes more portion than the complexity. 3) GA does not ensure to find the optimum feature subset. However, one can suppose that the most of selected features are relevant features. 4) Due to time limitations, a stopping criterion is satisfied when the predetermined iterations are completed (200 generations in our experiments). Therefore, one may have been omitted some relevant features from obtained optimum feature subset.
(b)
(c)
(d)
(e)
TABLE 2 Recognition results for optimized Gabor-wavelet on the CASIA
|
Training set |
All classes |
Code Length |
Optimized Parameters |
||||||
|
CRR(%) |
EER(%) |
d |
CRR(%) |
EER(%) |
d |
||||
|
encode1 |
four orientations & one scale (β) |
100 |
0 |
6.79 |
99.84 |
0.34 |
6.32 |
1024 |
ө=0.2490π, 0.3790π, 0.5063π, 0.7554π β=5.3196 γ=0.5902 p=2.2524 |
|
four orientations & two scales (β) |
100 |
0 |
6.81 |
99.76 |
0.56 |
6.10 |
2048 |
ө=0.2449π, 0.3978π, 0.5398π, 0.7549π β=4.5143, 4.5901 γ=0.6146 p=2.1187 |
|
|
eight orientations & one scale (β) |
100 |
0 |
5.90 |
99.76 |
0.63 |
5.50 |
2048 |
ө=0.1116π, 0.2007π, 0.2934π, 0.4694π, 0.5692π, 0.6480π, 0.8444π, 0.9548π β=2.5087 γ=0.6173 p=1.8085 |
|
|
four orientations & four scales (β) |
100 |
0 |
6.74 |
99.84 |
0.32 |
6.32 |
4096 |
ө=0.2437π, 0.3997π, 0.5645π, 0.7562π β=3.1506, 4.1970,5.2077, 5.7382 γ=0.6766 p=1.8852 |
|
|
encode2 |
four orientations & one scale (β) |
100 |
0 |
5.55 |
99.68 |
0.26 |
5.37 |
496 |
ө=0.1154π, 0.3333π, 0.6468π, 0.8845π β=4.5334 γ=0.8088 p=2.6664 |
|
four orientations & two scales (β) |
100 |
0 |
5.42 |
99.52 |
0.24 |
5.40 |
992 |
ө=0.1993π,0.3181π, 0.7028π, 0.8989π β=3.2184, 4.7782 γ=0.9048 p=2.2067 |
|
|
eight orientations & one scale (β) |
100 |
0 |
5.61 |
99.68 |
0.24 |
5.50 |
992 |
ө=0.0831π, 0.1803π, 0.2887π, 0.4078π, 0.5612π, 0.6837π, 0.8427π, 0.9625π β=3.6585 γ=0.6263 p=1.7347 |
|
|
four orientations & four scales (β) |
100 |
0 |
5.69 |
99.68 |
0.32 |
5.46 |
1984 |
ө=1875π, 0.3503π, 0.6571π, 0.8512π β=3.5636, 3.5907, 3.6231, 5.7063 γ=0.8962 p=2.2675 |
|
(f)
Fig. 5. Recognition results for various feature dimension:
(a) encode1-CASIA (b) encode2-CASIA (c) encode1-UBIRIS session I
(d) encode2- UBIRIS session I (e) encode1- UBIRIS session II (f) encode2- UBIRIS session II
-
C. Combination of Both Approaches
In this sub-section, we intend to shorten the iris codes as much as possible. The optimal feature subset is selected from extracted features by optimized Gabor-wavelet. The original iris codes are generated by optimized Gabor filter bank including one scale and four orientations for both encode1 and encode2. The optimum parameters have been selected from Tables 2 and 3. In the light of the previous discussions, too short iris codes are more susceptible to overfitting in spite of showing good performance on the training set. Furthermore, decreasing in the numbers of total features, M, due to use the shorter iris codes, causes the accepted risk would be increased if the weights were not changed (see (13) in section V). Based on this knowledge, we choose w1=0.9 and w2=0.1 in our implementations for this sub-section. The recognition results based on this combinatorial approach is provided in Table 5. Comparably, the recognition results have been presented in Tables 2 and 3 are indicating to be sacrificed the accuracy by decreasing the iris code length in Table 5. Among them, the results by encode2 are more affected because of their shorter length. Nevertheless, this short iris codes require to less storage space and on the other hand, to be performed the recognition task faster with acceptable accuracy. The GA is run with the aforementioned configuration in the previous sub-section for 100 generations.
TABLE 3 Recognition results for optimized Gabor-wavelet on the UBIRIS
|
Training set |
All classes* |
Code Length |
Optimized Parameters |
||||||
|
CRR(%) |
EER(%) |
d |
CRR(%) |
EER(%) |
d |
||||
|
encode1 |
four orientations & one scale (β) |
100 |
0 |
4.93 |
99.57 |
0.43 |
5.57 |
1024 |
ө=0.2353π, 0.4179π, 0.5523π, 0.8116π β=3.4013 γ=0.5196 p=1.5282 |
|
99.49 |
1.03 |
4.14 |
|||||||
|
four orientations & two scales (β) |
100 |
0 |
5.30 |
99.57 |
0.25 |
5.63 |
2048 |
ө=0.2191π, 0.4640π, 0.5654π, 0.7825π β=3.5130, 3.6423 γ=0.5414 p=1.7486 |
|
|
99.49 |
1.02 |
4.15 |
|||||||
|
eight orientations & one scale (β) |
100 |
0.06 |
5.30 |
99.79 |
0.42 |
5.64 |
2048 |
ө=0.0124π, 0.2145π, 0.2950π, 0.4398π, 0.5653π, 0.5981π, 0.6755π, 0.7944π β=3.6513 γ=0.5929 p=1.8967 |
|
|
100 |
1.53 |
4.14 |
|||||||
|
four orientations & four scales (β) |
100 |
0.06 |
5.47 |
99.57 |
0.42 |
5.86 |
4096 |
ө=0.2383π, 0.4749π, 0.5762π, 0.7849π β=3.4582, 3.9679, 4.5184, 6.4692 γ=0.5865 p=1.6949 |
|
|
100 |
1.00 |
4.35 |
|||||||
|
encode2 |
four orientations & one scale (β) |
100 |
0.17 |
4.80 |
98.93 |
0.46 |
5.04 |
464 |
ө=0.1309π, 0.4467π, 0.6849π, 0.8702π β=5.3343 γ=0.9328 p=2.3077 |
|
96.94 |
1.52 |
4.23 |
|||||||
|
four orientations & two scales (β) |
100 |
0.17 |
4.49 |
98.93 |
0.64 |
4.82 |
928 |
ө=0.1878π,0.4284π, 0.6408π, 0.8761π β=3.8856, 4.5951 γ=0.7073 p=1.9416 |
|
|
98.47 |
1.51 |
4.16 |
|||||||
|
eight orientations & one scale (β) |
98.33 |
1.7241 |
4.27 |
99.15 |
1.07 |
4.72 |
928 |
ө=0.0698π, 0.2282π, 0.3311π, 0.4327π, 0.5508π, 0.7254π, 0.8321π, 0.9060π β=3.1973 γ=0.8000 p=1.6445 |
|
|
97.45 |
2.06 |
3.94 |
|||||||
|
four orientations & four scales (β) |
100 |
0.37 |
4.73 |
98.93 |
0.64 |
5.05 |
1856 |
ө=0.1816π, 0.4529π, 0.7319π, 0.8608π β=4.2587, 4.3325, 4.7689, 5.0489 γ=0.7891 p=1.7554 |
|
|
98.47 |
1.53 |
4.30 |
|||||||
* The recognition results on all classes of UBIRIS database, have been presented in two columns for each row: session I (upper column) and session II (down column)
TABLE 4 Recognition results for optimal feature subset
|
CASIA |
UBIRIS (Session I) |
UBIRIS (Session II)* |
|||||
|
encode1 |
encode2 |
encode1 |
encode2 |
encode1 |
encode2 |
||
|
CRR (%) |
Training Set |
100 |
100 |
100 |
100 |
- |
- |
|
All Classes |
99.52 |
99.44 |
99.57 |
98.93 |
99.49 |
97.45 |
|
|
EER (%) |
Training Set |
0 |
0 |
0 |
0 |
- |
- |
|
All Classes |
0.57 |
0.33 |
0.63 |
0.82 |
2.16 |
2.00 |
|
|
d |
Training Set |
6.35 |
5.80 |
5.54 |
4.46 |
- |
- |
|
All Classes |
5.73 |
5.13 |
5.33 |
4.64 |
4.04 |
3.79 |
|
|
Feature Dimension |
1015 |
714 |
1408 |
705 |
1408 |
705 |
|
*For UBIRIS database, the training set only contains the images from first session.
TABLE 5 Recognition results for combination of optimized Gabor filtering and feature selection
|
CASIA |
UBIRIS (Session I) |
UBIRIS (Session II)* |
|||||
|
encode1 |
encode2 |
encode1 |
encode2 |
encode1 |
encode2 |
||
|
CRR (%) |
Training Set |
100 |
100 |
100 |
100 |
- |
- |
|
All Classes |
99.60 |
98.63 |
99.79 |
98.29 |
100 |
96.43 |
|
|
EER (%) |
Training Set |
0 |
0 |
0 |
0 |
- |
- |
|
All Classes |
0.56 |
0.81 |
0.43 |
1.09 |
1.53 |
2.97 |
|
|
d |
Training Set |
7.70 |
5.92 |
5.72 |
5.31 |
- |
- |
|
All Classes |
6.16 |
4.85 |
5.63 |
4.78 |
4.35 |
4.01 |
|
|
Feature Dimension |
421 |
234 |
483 |
228 |
483 |
228 |
|
*For UBIRIS database, the training set only contains the images from first session.
-
D. Discussions on the Results
This sub-section is comparing between two presented approaches, optimizing the Gabor filtering and feature selection. After analyzing the above results, we can list the following conclusions:
-
1) In optimizing the Gabor-wavelet approach, the complexity of feature extraction step is reduced by applying the smaller filter bank. In contrast, the feature selection approach is applied when the features have been extracted by the large Gabor filter bank. Hence, for the feature selection approach the features are extracted slower. However, both approaches can shorten the iris codes, which this leads to perform the matching step effectively.
-
2) The GA is adopted in both approaches. In configuration of GA for optimizing the Gabor-wavelet approach, each individual contains variables with real value while they are binary for feature selection approach. Nevertheless, the first approach is converged in less than 70 generations while for second approach, finding the optimal feature subset is continued until the stopping criterion is satisfied on the 200th generation. The justification for this is that each individual in GA configuration for first approach contains less parameter than second one. For example, a optimized Gabor filter bank including four filters, required to optimize seven parameters including a scale β , four orientations, resonance value p and aspect ratio γ . However, for
finding an optimal feature subset from a set of features, which are extracted by a Gabor filter bank including four scales and four orientations (i.e. 16 filters), required to use more variables (genes). In this case, each individual contains 4096 bits when using encode1while for encode2, each individual contains 1984 and 1856 bits for CASIA and UBIRIS databases, respectively. Therefore, the first approach is higher computational efficiency than the second approach .
-
3) The number of parameters of Gabor filter bank must not be very small, therefore the length of optimized iris codes by the first approach will be confined. Oppositely, the feature selection searches for a feature subset with the best performance without any limitations for code length.
-
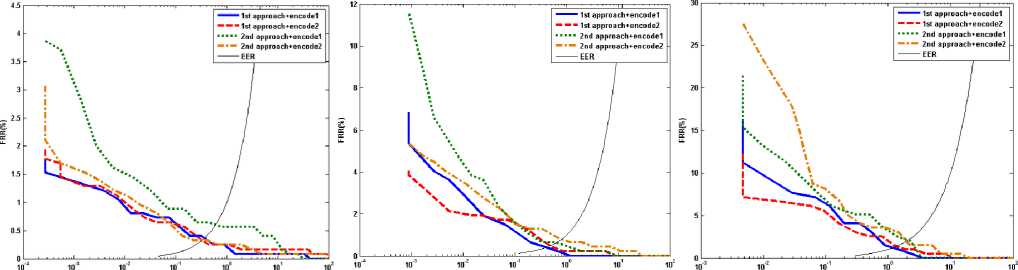
4) The comparison between Tables 2, 3 and 4 suggests that the superiority of the optimizing the Gabor-wavelet approach on both accuracy and complexity except few cases. In fact the features that are extracted by an optimized Gabor filter bank show a better discrimination than ones that are selected as dominant features from a set of features which have been extracted by non-optimized Gabor filter bank. Figure 6 shows ROC curves for both approaches. The ROC curves for first approach are for optimized Gabor filter bank including four filters.
FAR(%) FARW FAR(%)
(a) (b) (c)
Fig. 6. ROC curve for optimizing the Gabor-wavelet approach
(1st approach) and feature selection approach (2nd approach) and both encoding strategy, on the database
(a) CASIA (b) UBIRIS session I (c) UBIRIS session II
-
E. Comparison with Previous Works
In this sub-section, our results are compared with the existing ones in the literature. We try to find the schemes, which were tested by the iris databases used in this paper, for fairly comparison. These results are presented in Tables 6 and 7 for CASIA-IrisV3-Interval and UBIRIS V1 databases, respectively. We rarely find the papers, which were used both aforementioned database. For this reason, the comparisons are separately tabulated for each database. Tan and Sun [13] proposed multilobe differential filters (MLDFs) for ordinal iris feature extraction. The best performance was obtained by combining the di-lobe and tri-lobe for nonlocal ordinal codes (OC) which is brought in Table 6. Tsai et. al [49] used fuzzy grayscale curve tracing (FGCT) to segment the iris region. Then, they applied a filter bank including twelve Gabor filters corresponding to two frequencies and six orientations to extract 96 local real-valued features point. The matching strategy was based on fuzzy clustering algorithm. Their system was tested for identification and verification mode, which those results can be seen in Table 6. Also, Tsai et. al in their earlier work [29] optimized a Gabor filter bank including ten Gabor filters by Particle Swarm Optimization (PSO) algorithm. Masek [50] adopted Log-Gabor filtering for iris representation. Ma et al. [51] used 1D quadratic spline wavelet to address the position of local sharp variation points in the iris plane as the features. Rathgeb et al. [52] exploited the previous works for feature extracting and adopted selective bits fusion to pick out the discriminative bits. The pertaining results for Masek 's and Ma 's method in Table 6, are reported by Rathgeb et al. [52] through re- implementing these methods. Tajbakhsh et al. [53] proposed a robust feature extraction method based on local intensity variations by defining the overlapped patches. They preferred to extract soft variations by wavelet de-noising strategy to remove sharp variations of intensity signals. For each iris image, they generated five iris codes and then used SVM-based fusion rule to make the decision. In addition, they re-implemented the works of [9],[10],[51] and tested them on the UBIRIS database, which the results are shown in Table 7. Pinheiro et al. [54] used Novelty filter to extract the real-valued features. Chen et al. [55] extended the idea of feature extraction using two-dimensional gray level co-occurrence matrix (2D GLCM) to three-dimensional one to consider the edge information from four orientations. They extracted contrast, homogeneity, angular second moment, entropy and image pixel correlation of 3D GLCM as features and then adopted projection to make the feature vectors. Their system was only tested on the first session of the UBIRIS database which obtained results are brought in Table 7. We also repeat our results in the Tables 6 and 7, which were given in the sub-sections A, B and C. Although the accuracy of our result is not the best, however, it provides best compromise between accuracy and complexity (iris code length). On the other hand, we use only a quarter of the iris region for recognition, while the others used the whole or half of the iris region. We intend to extend proposed optimization of Gabor-wavelet approach to whole iris region by removing the irrelevant parts such as eyelashes and eyelids in the future.
TABLE 6 Performance comparisons using CASIA database
|
CRR (%) |
EER (%) |
Feature Length |
Number of tested images |
|
|
Sun and Tan (2009) |
- |
0.35 |
2048 bits |
Not Determined |
|
Tsai et al. (2010) |
99.97 |
0.40 |
96 real-valued features |
2553 |
|
Tsai et al. (2008) |
100 |
0.03 |
1600 bits |
2578 |
|
Masek (2003)* |
- |
1.41 |
10240 bits |
1332 |
|
Ma et al. (2004)* |
- |
1.83 |
10240 bits |
1332 |
|
Rathgeb et al. (2011) |
- |
1.15 |
6336 bits |
1332 |
|
Proposed method (1st approach-encode1) |
99.84 |
0.34 |
1024 bits |
2125 |
|
Proposed method (1st approach-encode2) |
99.68 |
0.26 |
496 bits |
2125 |
|
Proposed method (2nd approach-encode1) |
99.52 |
0.57 |
1015 bits |
2125 |
|
Proposed method (2nd approach-encode2) |
99.44 |
0.33 |
714 bits |
2125 |
|
Proposed method (combinational approach-encode1) |
99.60 |
0.56 |
421 bits |
2125 |
|
Proposed method (combinational approach-encode2) |
98.63 |
0.81 |
234 bits |
2125 |
* The experimental results are reported i n [52] b y re-implementing these methods
TABLE 7 Performance comparisons using UBIRIS database
|
CRR (%) |
EER (%) |
Feature Length |
Number of tested images |
|||
|
First Session |
Second Session |
First Session |
Second Session |
|||
|
Poursaberi and Araabi (2007)* |
- |
- |
2.10 |
5.00 |
544 bits |
1740 |
|
Ma et al. (2004)* |
- |
- |
1.90 |
5.00 |
5280 bits |
1740 |
|
Monro et al. (2007)* |
- |
- |
1.20 |
3.80 |
2343 bits |
1740 |
|
Tajbakhsh et al. (2009) |
- |
- |
0.40 |
3.00 |
5×256 bits ** |
1740 |
|
Pinheiro et al. (2010) |
97.44 |
96.33 |
3.39 |
5.83 |
18400 realvalued features |
Not Determined |
|
Chen et al. (2009b) |
- |
- |
0.35 |
- |
1536 bits |
975 |
|
Proposed method (1st approach-encode1) |
99.57 |
99.49 |
0.43 |
1.03 |
1024 bits |
1696 |
|
Proposed method (1st approach-encode2) |
98.93 |
96.94 |
0.46 |
1.52 |
464 bits |
1696 |
|
Proposed method (2nd approach-encode1) |
99.57 |
99.49 |
0.63 |
2.16 |
1408 bits |
1696 |
|
Proposed method (2nd approach-encode2) |
98.93 |
97.45 |
0.82 |
2.00 |
705 bits |
1696 |
|
Proposed method (combinational approach-encode1) |
99.79 |
100 |
0.43 |
1.53 |
483 bits |
1696 |
|
Proposed method (combinational approach-encode2) |
98.29 |
96.43 |
1.09 |
2.97 |
228 bits |
1696 |
* The experimental results are reported i n [53] b y re-implementing these methods.
** The authors o f [53] generated five iris codes for each iris image and used SVM-based fusion rule to make the decision.
-
VII. Conclusion
Simulation in this paper, we focused on iris feature extraction based on Gabor-wavelet transform. Due to concerns about losing the information, traditionally, the use of a large Gabor filter bank has been adopted. This approach yields some problems such as long templates and slow feature extraction and matching. To feature selection. Furthermore, a novel encoding strategy based on texture variations is introduced to generate shorter iris codes than ones which generated by Daugman phase quantizing method. The experimental results exhibit the generated iris codes by the idea of optimizing the Gabor-wavelet are more distinctive and compact than ones based on the feature selection approach. In addition, optimizing the Gabor-wavelet leads to reduce the size of filter bank as the features are faster extracted while the feature selection approach does not have any improvements on the feature extraction step. Both approaches require running MOGA in training mode. However, optimizing the Gabor-wavelet is converged in less time than feature selection approach. The proposed encoding shows better accuracy than Daugman phase quantization encoding on the CASIA iris database while it provides shorter iris codes. However, when this encoding strategy is tested on UBIRIS database, the accuracy is more degraded due to highly noisy images from this database. This challenge does not pertain to the intrinsic property of proposed encoding. In a less constraint iris recognition system, representing the iris with short iris codes is a risk. For this reason, the accuracy of the proposed encoding is lower than the phase quantization one. Since the iris codes have been generated based on a quarter of the iris region, we expect to reach the better recognition rate using the whole iris region for noisy images when using the proposed encoding. This is left as future work.
Acknowledgement
We highly appreciate Iran Research Centre of Intelligent Signal Processing (RCISP) for its support to this research as a part of MSc thesis.
References Two Approaches Based on Genetic Algorithm to Generate Short Iris Codes
- Flom, L, Safir, A. Iris Recognition System. United States Patent No. 4,641,349, Washington D.C.: U.S. Government Printing Office, 1987.
- Daugman, J.G. High confidence visual recognition of persons by a test of statistical independence. IEEE Trans Pattern Anal Mach Intell, 1993, 15: 1148-1161.
- Daugman, J G. How iris recognition works. IEEE Trans Circuits and Systems for Video Technology. 2004, 14: 21–30.
- Wildes, R P. Iris recognition: an emerging biometric technology. Proc. IEEE, 1997, 85: 1348–1363.
- Boles, W, Boashash, B. A human identification technique using images of the iris and wavelet transform. IEEE Trans. Signal Process. 1998, 46: 1185–1188.
- Tisse, C, Martin, L, Torres, L, Robert, M. Person identification technique using human iris recognition. Vis. Interface Conf., 2002, 294–299.
- Ali, J M H, Hassanien, A E. An iris recognition system to enhance e-security environment based on wavelet theory. Adv Model Opt. 2003, 5: 93–104.
- Lim, S, Lee, K, Byeon, O, Kim, T. Efficient iris recognition through improvement of feature vector and classifier. Electronics and Telecommunications Research Institute Journal. 2001, 23: 61–70.
- Poursaberi ,A, Araabi, B N. Iris Recognition for Partially Occluded Images: Methodology and Sensitivity Analysis. EURASIP Journal on Advances in Signal Processing, 2007, 12 pages.
- Monro, D M, Rakshit, S, Zhang, D. DCT-based iris recognition. IEEE Trans. Pattern Machine Intell. 2007, 29: 586–595.
- Miyazawa, K, Ito, K, Aoki, T, Kobayashi, K, Nakajima, H. An effective approach for iris recognition using phase-based image matching. IEEE Trans. Pattern Anal. Machine Intell. 2008, 30: 1741–1755.
- Azizi, A, Pourreza, H R. A Novel Method Using Contourlet to Extract Features For Iris Recognition System. In: International Conference on Intelligent Computing, Springer Lecture Notes in Computer Science, 2009, 5754: 544-554.
- Sun, Z, Tan, T. Ordinal measures for iris recognition. IEEE Trans Pattern Anal Mach Intell. 2009, 31: 2211–2226.
- Sun, Z, Wang, Y, Tan, T, Cui, J. Improving iris recognition accuracy via cascaded classifiers. IEEE Trans. Syst. Man Cyber. 2005, 35(3): 435–441.
- Thoonsaengngam, P, Horapong, K, Thainimit, S, Areekul,V. Efficient iris recognition using adaptive quotient thresholding. In: International Conference on Biometrics, Springer Lecture Notes in Computer Science, 2006, 3832: 472–478.
- Liang, H, Cai, Z. Iris Recognition Based on Characters of Iris’s Speckles. World. Cong. Intelligent Control and Automation, 2008, 6793-6797.
- Hosseini, M S, Araabi, B N, Soltanian-Zadeh, H. Pigment melanin: pattern for iris recognition. IEEE Trans on Instrumentation and Measurement, special issue on Biometrics. 2010, 59(4): 792– 804.
- Iridian Technologies. Web siteAvailable: http://www.iridian.com/solutions. php [Online] .
- Lin, Z, Lu, B. Iris recognition method based on the optimized Gabor filters. Int. Cong. Image and Signal Processing, 2010, 1868-1872.
- Ma, L, Wang,Y, Tan, T. Iris Recognition Based on Multichannel Gabor Filtering. Asian. Conf. Computer Vision, 2002, 279-283.
- Meng, H, Xu, C. Iris Recognition Algorithms Based on Gabor Wavelet Transforms. IEEE Int. Conf. Mechatronics and Automation, 2006, 1785-1789.
- Minhas, S, Javed, M Y. Iris Feature Extraction Using Gabor Filter. Int. Conf. Emerging Technologies, 2009, 252-255.
- Sanchez-Reillo, R, Sanchez-Avila, C. Iris recognition with low template size, In: International Conference on Audio- and Video-Based Biometric Person Authentication, Springer Lecture Notes in Computer Science, 2001, 2091: 324–329.
- Wei-qi, F, Wang-lan, L, Li, K. Parameter Selection of Gabor Filter Used in Iris Recognition. OPTO- ELECTRONIC ENGINEERING, 2008, 35(8).
- Yu, L, Zhang, D, Wang, K. The relative distance of key point based iris recognition. Pattern Recog. 2007, 40: 423 – 430.
- Zheng, H, Su, F. An Improved Iris Recognition System Based On Gabor Filters. IEEE Int. Conf. Network Infrastructure and Digital Content, 2009, 823-827.
- Nadia, F, Hamrouni, K. An Efficcient and Reliable Algorithm for Iris Recognition Based On Gabor Filters. Int. Conf. Systems, Signal and Devices, 2009, 1-6.
- Chou, C T, Shih, S W, Chen, D Y. Design of Gabor Filter Banks for Iris Recognition. Int. Conf. Intelligent Information Hiding and Multimedia Signal Processing, 2006, 403-406.
- Tsai, C C, Taur, J S, Tao, C W. Iris Recognition Using Gabor Filters Optimized by the Particle Swarm Technique. IEEE Int. Conf. Syst. Man and Cyber, 2008, 921-926.
- Ma, L, Tan, T, Wang, Y, Zhang, D. Personal Identification Based on Iris Texture Analysis", IEEE Trans Pattern Anal Mach Intell. 2003, 25: 1519-1533.
- Nabti, M, Bouridane, A. An Effective Iris Recognition System Based On Wavelet Maxima and Gabor Filter Bank. Int. Symp. Signal Processing and its Applications, 2007, 1-4.
- Holligsworth, K P, Bowyer, K W, Flynn, P J, 2009. The Best Bits in an Iris Code. IEEE Trans Pattern Anal Mach Intell. 31, 964–973.
- Blum, A, Langley, P. Selection of relevant features and examples in machine learning. Artif Intell. 1997, 10: 245–271.
- Wegner, J K, Frohlich, H, Zell, A. Feature Selection for Descriptor Based Classification Models. 1. Theory and GA-SEC Algorithm. J. Chem. Inf. Comput. Sci. 2004, 44: 921-930.
- Attarchi, S, Faez, K, Asghari, A. A Fast and Accurate Iris Recognition Method Using the Complex Inversion Map and 2DPCA. Int. Conf. Computer and Information Science, 2008, 179-184.
- Chen, W S, Chuan, C A, Shih, S W, Chang, S H. IRIS RECOGNITION USING 2D-LDA + 2D-PCA. IEEE Int. Conf. Acousts. Speech Signal Process. 2009, 869-872.
- Chu, C T, Chen, C H. High Performance Iris Recognition Based on LDA and LPCC. In: Proc. IEEE Int. Conf. Tools with Artif. Intell. 2005, 5 pages.
- Dorairaj, V, Schmid, N A, Fahmy, G. Performance Evaluation of Iris Based Recognition System Implementing PCA and ICA Encoding Techniques. In: Proc. SPIE Conf. Biometric Technology for Human Identification. 2005, 5779: 8 pages.
- Go, H J, Kwak, K C, Kwon, M J, Chun, M G. Iris Pattern Recognition Using Fuzzy LDA Method. In: International Conference on Knowledge-Based Intelligent Information and Engineering Systems, Springer Lecture Notes in Computer Science, 2005, 3682: 364-370.
- Ranjzad, H, Ebrahimi, A, Sadigh, H E. Improving Feature Vectors for Iris Recognition through Design and Implementation of New Filter bank and locally compound using of PCA and ICA, Int. Symp. Applied Sciences on Biomedical and Communication Technologies, 2008, 1-5.
- Son, B, Won, H, Kee, G, Lee, Y. Discriminant Iris Feature and Support Vector Machines For Iris Recognition. IEEE Int. Conf. Image Process. 2004, 2: 865-868.
- Zhiping, Z, Maomao, H, Ziwen, S. An Iris Recognition Method Based on 2DWPCA and Neural Network. Chinese Control and Decision Conference, 2009, 2357-2360.
- Konak, A, Coit, D W, Smith, A E. Multi-objective optimization using genetic algorithms: A tutorial. Reliability Engineering and System Safety. 2006, 91: 992–1007.
- Bhanu, B, Lin, Y. Genetic algorithm based feature selection for target detection in SAR images. Image and Vision Computing. 2003, 21: 591–608.
- Pereira, M B, Veiga, A C P. Application of Genetic Algorithms to Improve the Reliability of an Iris Recognition System. IEEE Workshop on Machine Learning for Signal Processing. 2005, 159-164.
- Roy, K, Bhattacharya, P, Suen C Y. Towards nonideal iris recognition based on level set method, genetic algorithms and adaptive asymmetrical SVMs. Engineering Applications of Artificial Intelligence. 2011, 24: 458-475.
- CASIA iris image database, http://www.cbsr.ia.ac.cn/.
- UBIRIS datasetobtainedfromdepartmentofcomputerscience,UniversityofBeira Interior, Portugal. /http://iris.di.ubi.pt/S.
- Tsai, C C, Lin, H Y, Taur, J S, Tao, C W. A New Matching Approach for Local Feature Based Iris Recognition Systems. IEEE Conf. Industrial Electronics and Applications, 2010, 387-392.
- Masek, L. Recognition of human iris patterns for biometric identification. Bachelor thesis, University of Western Australia. 2003, http://www.csse.uwa.edu.au/˜pk/studentprojects/libor/.
- Ma, L, Tan, T, Wang, Y, Zhang, D. Efficient iris recognition by characterizing key local variations. IEEE Trans. Image Process. 2004, 13: 739–750.
- Rathgeb, C, Uhl, A,Wild, P. on Combining Selective Best Bits of Iris-Codes. In: European workshop on Biometrics and ID Management, Springer Lecture Notes in Computer Science, 2011, 6583: 227-237.
- Tajbakhsh, N, Araabi, B N, Soltanian-Zadeh, H. Noisy iris verification: a modified version of local intensity variation method. In: International Conference on Advances in Biometrics , Springer Lecture Notes in Computer Science, 2009, 5558: 1150–1159.
- Pinheiro, C F M, Costa, M G F, Filho, C F F C. Applying a Novelty Filter as a Matching Criterion to Iris Recognition. Int. Cong. Image and Signal Process. 2010, 5: 2414-2418.
- Chen, W S, Huang, R H, Hsieh, L. Iris Recognition Using 3D Co-occurrence Matrix. In: International Conference on Advances in Biometrics, Springer Lecture Notes in Computer Science, 2009, 5558: 1122-1131.
