Use of API’s for Comparison of different product information under one roof: analysis using SVM

Author: Priyanka Desai, G. R. Kulkarni
Journal: International Journal of Information Technology and Computer Science @ijitcs
Article in issue: 6 Vol. 10, 2018.
Free access
The internet has grown in leaps and bounds and hence all the data is now available online; be it shopping, banking, private and public institutes or universities, private public sectors are all making their presence felt online. The online data is just a click away thanks to ubiquitous systems today. The browser does not require any specific program set up hence easier for the end user. Earlier the data online was static used HTML now it’s dynamic uses ASP, ASP.NET, Servlet, JSP and other operational tools therefore the internet operation is broken down into many categories. The problem arises with the customer while trying to buy something online. There are lots of online stores sometimes it’s difficult to browse through all products to get a better deal. The pricing of products are different on different sites, this is the first gap at the customer end. The second problem arises at the provider end. The second gap here is to understand the customer need. How can the variation in prices be checked? ; The existing prices available on sites cannot be changed but the customer can be provided with options to select the best deal of the same product. For the first problem the paper deals with an API implementation wherein the information of at least some products is compared under one roof. How can the provider know the genuine customer? ; The second problem is resolved by the use of SVM. Last problem is in detecting if a customer visiting a site will actually buy the product being compared. The paper focuses on the selection of ASP.NET to deal with the implementation problems stated and find solution to the forecasting problem using SVM. SVM and C4.5 are used for comparison.
HTML, ASP.NET, Application Program Interface, Support Vector Machines, C4.5
Short address: https://sciup.org/15016268
IDR: 15016268 | DOI: 10.5815/ijitcs.2018.06.02
Text of the scientific article Use of API’s for Comparison of different product information under one roof: analysis using SVM
Published Online June 2018 in MECS
Online shopping is catching up of late. As there are a wide range of products available, the customer is in a fix.
The customer is not able to finalize on the site from which he /she need to buy.
For any customer shopping online, the first issue is availability of huge data online is a major advantage because one can select from a wide range of sites; as well as disadvantage because it’s tedious to visit each and every site. The paper deals with using the API’s of different sites and crawl through the sites to compare the products on one site that takes care of streamline the second issue. Using the model vision check architecture will streamline the flow of the implementation.
API’s are used to give customer better features that the online application intends to provide. But all the online sites do not provide the API’s, hence to create a single site to compare all the product cost from different sites cannot be achieved. This is the gap for the existing solution. API is the one that accesses information from an operating system, web service or another implementation. E.g: A company ‘X’ wants to display information of electronic product, it also needs to compare the price sold by amazon, ebay and other online portals. Now ebay, amazon should provide their API to company ‘X’ so that any update done by ebay and amazon in the product information should be visible on the site of ‘X’.
The paper explains the use of API that helps the customer to get better deals under one roof and difference with HTML. HTML is not a structured tool for implementation, the machines interpret json or rdf style. The application software does not give the desired outcome with the use of HTML. For eg: If a site ‘X’ wants to display the contents present in the site ‘Y’, site ‘X’ has to update the information regularly. The problem will arise when site ‘X’ is not updating the information regularly; the end user is not getting the desired outcome. Therefore, you need an application that communicates with the site regularly or as the need arises. The answer is API which has to be used by site ‘X’ to get the details from site’Y’.
If one has worked on windows platform using ASP then ASP.net will provide an easy path. The difference is that in ASP.NET there is no need to implement using scripts as is done in ASP[1]. The implementation is for online applications hence use HTML like syntax. The browsers understand HTML; hence use browser specific tools. Here the graphic interaction can be developed in a better manner only if the layout of the exhibition is considered. Hence the user interaction is separated out from the situation-rational.
Take a look at figure 1, each of the implementation flipcart , amazon, eBay have their own situation-rational. Each implantation is written using different tools such as ASP.NET, ASP, JSP etc. The products sold on the site need to be updated in the backend that has its own situation-rational. Any change in information at the backend needs to be updated separately on each site. The backend has the web service details of the situation-rational.
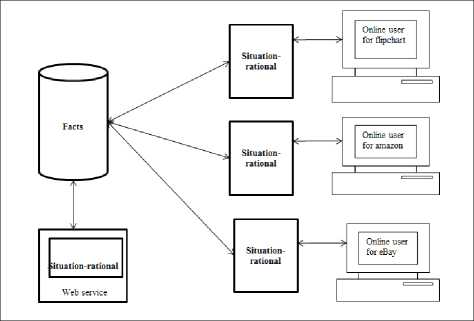
Fig.1. Implementation using situation rational
The paper explains combining these different situation-rational are combined as API as explained in section 5.1 to give better outcome under one roof. The paper also tries to predict if the customer might buy the product being analyzed by using SVM as a mechanism. The provider gets to know a true customer with the use of SVM.SVM is used based on the paper[2] that compare SVM with C4.5. Here it is shown that i) API’s perform better while comparing different products from different sites and ii) SVM performs better than C4.5.
-
II. Related Works
-
A. API for product price comparison
Existing API’s of amazon, flip cart and eBay are used for implementation here. The application has to be developed based on the end user requirement. Select API’s that work on all platforms namely windows, Apple computers and the interface should be compatible with all available tools and languages. In this paper three different situation-rational are considered and combined into one application. Each situation-rational is developed to be used as a third party API in an application. The design of an API should be simple and should use two URL’s, it needs to have type of product (/mobiles) and specific product (/mobiles/HTC) as the URL. There are many ways to use URL’s but the simpler one given above is to better as the programmer has no confusion as to how to develop the application. It’s better to use one form of URL for type of product either use (/mobile or /mobiles) to maintain consistency in developing the application. As this is a third part application out of the four HTTP verbs, only GET verb is used. POST/UPDATE/DELETE is taken care of by the API provider; here the provide is amazon, flip cart and eBay. The API[3] used here is for easy exploration.
-
• How to get the API keys from providers?
First search for the provider API keys on search engines. Next register username and password to create an account on the provider site. Proceed to enter the title of application you are creating. Fill in the mandatory developer information that will help create a key set. A mail will be sent to you that can now be used for developing the application. Authorize the Key that is given to you before using it in an application.
-
• How to create an e-commerce site for price comparison using API?
Create a basic layout of the site as shown in figure 4. Once the API keys are created; on click of any product a query should be fired to all the API’s and the price information should be generated. The website created here does not require a personal server at the client end. The site is able to check the product rates, inventory, time to dispatch an order, tracking the dispatch. Create a domain name for the site to be used by online end-users. Check the cost for using the online domain name; most domain names cannot be launched for free. Find out if the domain name is available before launching the site online. Be careful to choose domain name, if the name is relevant, it help the user in choosing your site over others[4]. Next while displaying the products uses proper layouts that retrieve products from different websites and display in sorted manner. The products should either be displayed in ascending or descending order. Payment gateway is not considered if the user wants to shop directly from the site that displays lowest price of a certain product. Try and display 360o view of the product with proper focus so that the users have a proper view. For startup’s it’s better to use social networking sites to advertise the details about the site.
-
B. C4.5 for customer analysis
The focus of this paper is on linear classification SVM, let’s look in decision tree which is the oldest information retrieval method for the purpose of comparison. Since C4.5[5] is supervised learning method it has to be trained and tested. There are input data which are pruned[6] and an output that classifies the data. The information is generated at the root node which ends at the leaf nodes. First use the data to find if the customer[7] is a potential customer or not base on the parameters age, education and income based on the steps being followed:
First: Use top down approach for selecting attributes (divide and conquer):
Gather the attribute of root node, branch the attribute value
Split the nodes into subbranches from root node repeat recursion on the branches for the instances of the branch
Repeat until class instances are not same
Second: Select the best attribute that gives good information gain(entropy), which calculates the probability of data in the given space:
Entropy(sp) = - Щ p (У log 2 p (У (1)
where ‘o’ is the total number of values in a column, P (sp) is the data where ’sP’ is to divide the root node,’i’ is the event(class).
Now use the entropy values for probable and nonprobable data in impurity measure:
Impurity = Z t= 1”-Entropy(.sp) (2)
Finally, the tree is generated as rules:
Create one rule for each branch
Make sure the rules give proper information
Prune the tree to remove unnecessary rules if any
The tree[8] is easy to generate and it takes care of some amount of noisy data. The training of the data needs to be done carefully so there are better test outcomes.
-
C. SVM for customer analysis
The classification of positive and negative data is better in SVM. This method has to learn in the same way a child picks up words and tries to form sentences that make sense. The child needs to be taught first and later the child makes its interpretation and learns to speak. In the same way that a child is taught, there is teaching that needs to be done so that the SVM method can function properly. There is a need to check the kind of information we feed into the SVM so that the outcome is generated properly. Hence, first get the data and then clean the data before training. Next train the data, thus the teaching can be for forecasting based on the training such as weather forecasting, customer forecasting etc. For any given input there needs to be an output that forecasts based on the teaching.
Most of the forecasting methods or algorithms behave like a parrot. They just imitate and forecast based on the teachings, hence a deviation in the input from the existing teaching will generate garbage results. If the outcome is for generating weather forecast then customer predication for a sales company cannot be given. But if there is some variation in the monitoring system that was not considered earlier, then such situations need to be worked upon. This is where SVM [9] performs better; it learns form partial teaching to generate optimal output. SVM is a supervised learning given as:
Training set SI = ({xt ,yt ) ... . (xn ,y )} (3)
xi is the example, yt is the outcome
Here the input example belongs to Vk , here V are the values and k or n is the dimension of the input examples.
Output y ={+1,-1}Therefore, input examples are linear leaners that use speculation. Supervised learning comprises of teaching data along with outcome data. SVM is used to divide useful fact from that of useless facts. In this paper it is used to differentiate between the probable customers from non-p robable customers as shown in figure 5. SVM is a continuous classification. The formula for SVM[10] is:
/(x) =< we * x > +h (4)
‘*’ implies product, ‘h’ or’ be’ is the bent
Where ‘we
i
’ is the weight and ‘x
i
’ is the row vector and
Only one hyperplane is depicted in the diagram 2a. Here w is the weight vector, x are the points and h1 is the hyperplane that separates the useful and useless facts. Two more hyperplanes h2 and h3 can be used to separate the data from the first hyperplane h 1 . . This is to reduce the probability of errors in the outcome of the implementation. There is no space between the positive data and the hyperplane which may lead to errors while testing the data.
This draw back in 2a can be rectified, the changes to the margin and the data separation are done and it is depicted in figure 2b. As shown in the figure 2b the good data and the bad data are separated properly by the hyperplane. The probability of errors is reduced with wider margin while testing the data.
Draw a bent as depicted in figure 2b ’h’ from 0,0 to the line that divides the good data from the bad data. Next draw a perpendicular line from the dividing line. There can be many dividing lines in a given space, therefore ‘h’ is necessary if all the lines need to be considered in Vn .
x i is depicted as column vector and w i the row vector.
Hence the formula functional margin:
/(x) =< wet * xt > +h (5)
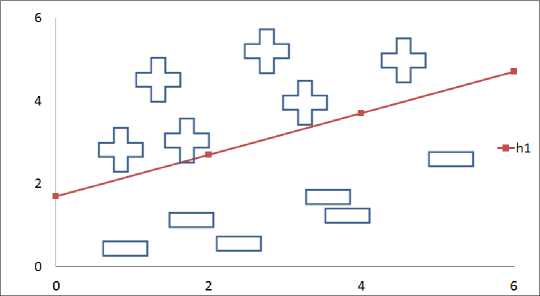
Fig.2a. Bad margin for probable and non-probable customers
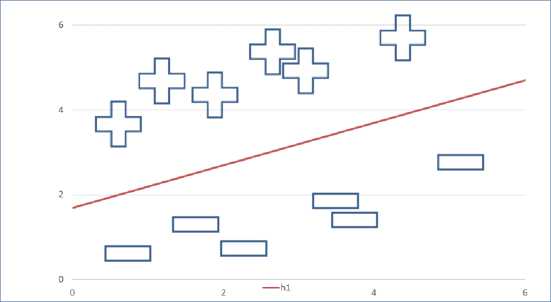
Fig.2b. Good margin for probable and non-probable customers
Tis margin gives a number, but does not actually give the distance between the points on the plane.
Where w belongs to Vk ,h belongs to V
The computation is for 2D inputs, where w and h are specifications of hyperplane. x , is the example data that is used for teaching the SVM.
The outcome of the teach method has to be optimal hence the need to curtail the plane.
miniwe,hwe * we(6)
So thaty,(weiXi + h) > 1
and y i is either positive or negative for all ‘i’.
After organizing the formula is now depicted as wetXt + h=1(8)
for positive fact wex, + h=-1(9)
for negative fact
Let’s consider maximum limit classifier, it does not work for all day-to-day forecasts but SVM is based on it. This helps in spacing and separating the good data from that of the bad, such that the good and the bad data do not get mixed. Curving outward gain is a minimization issue; the given function needs to be solved subject to constraints. As SVM[2,11] is a linear issue we consider maximizing the function subject to constraints.
Lets’s look at Primal and Dual forms as minimum and maximum classifiers are explained.
-
• Primal Form
Primal gives the best w, solve we, x, consider x as a point and calculate we*x in order to generate the optimal w. Make sure that the distance between two points of we*x is not large.
Considering binary classification and compute by using values for we1, we2 and h in equation (2)we get :
A slope we1/we2 and an intercept h/ we2
As is mentioned in equation (8) and (9) we get a decision rule:
у = sign(we * x, + K)(10)
For calculating distance between vectors(points) on axis x1 and x2: δ(u,v)=||u-v||(11)
6(u, v) = 7(ui - П1)2 + (U2 - V2)2
Now calculating δ i
= we(xt - 5^) + h = 0
V ‘ ‘ ||we||/
_ we*we , _ ... ..
= we * xt - Si , + h = 0
Vw*we
= we * xt - St||we|| + h = 0 (15)
The solution for distance is:
S t
we*x t +h
||w||
Using the output signs we get geometric margin:
This is calculated by using Euclidean distance as mentioned in equation (11) between the points on the plane. This margin give whether it is a positive or negative classifier[12], it also give the distance between the training data and the plane. The data has to forecast properly even if new data is introduced to generate the optimal plane. It’s good to have a wide margin in order to avoid misclassification of data as and when new data is added.
r . ,weu^h,. „
St = ' ..
The relation of geometric margin with functional margin is
St = ||we|| *yt(18)
If ||we||=1 functional margin is equal to geometric margin
From h to the plane it’s S t that is half the margin and hence the total margin is 2 S t .
There is a need to maximize[13] the margin:
Max 2Stweh where St = yt = 51дтг(^^)
Optimizing the equation:
Max 2Stwe hwhereV(x,y)eSl ,yt =sHt5t)s(20)
The normal vector of ‘we’ is:
М=£(21)
The total margin is:
Max we^ 2T —-r whereV ( x,y)eSl y t =
||we||
• /wenL+^1
"^"( ||...|| I ' ii-^N
The linear equation now is:
Maxwe,h2j-j—whereV(x,y)eSl ytsign(we * xt + h) > 1
The minimization of the equation leads to:
Minweh —-— where V(x,y)eSl ytsign (we * xt + h) > 1
||we|| = Vwe. we hence the equation is now:
we * we
Minw,h------- whereV(x,y)eSl ytsign(we * xt + h) > 1
The primal gives optimal ‘we’, there is a need to get perfect ‘we’ in order to get the product of we*x.
-
• Dual Form
Solve the primal optimization using Lagrange to get:
we * we
Minweh------- whereV(x,y)eSl ytsign(we * xt + h") > 1 (27)
ytsign(we * xt + h) - 1 > 0 (28)
The Lagrange (α) is multiplied and the function is subtracted:
MinwehLa(we,h,a') = we*we
—--Z "=i a t (y t sign( we * x t + h) - 1)
where a t > 0
Use quadratic optimization, these should solve certain parameters given KKT(Kruskal Kuhn Tucker):
KKT conditions
-
1) Sw La(w, h,a) = 0 and SLa(w’h,a) = о
-
2) at>0
-
3) a t(yt(we * xt + h) - 1) = 0
-
4) (yt(we * xt + h) - 1) > 0
Solve using Lagrange (α) to get w and h
La(we,h,a) = we * we - £^ 1 a t(yt(we * xt + h) - 1)
= w^*w1 - ^^=^a t(ytwe * xt + yth) - 1(35)
w e* w e /V W 7 1 V4 N
= — --Z "=i a t y t we * x t - Z t=i a t y t h + ^^a t
The Lagrange with respect to vector and considering rest of equation as zero:
S w =we- X t=i a t y t x t (37)
Now w is:
we = y^a iViXi(38)
Solving Lagrange for h and considering rest of equation as zero:
y' a v(39)
-
-£=« iVi = 0
Use the values of W and h in the Lagrange equation:
La(we, h, a) = we * we - yv = ia i(yi(we * Xi + h) - 1)
we*we
= —-- y^a i V i we * X i - hy^a i V i + y ^ a t
Now take hy^a ivi = 0 (43)
La(we,h,a) = 1 y^a i V i X i * y^a i V i X i -y^ i a i V i X i - y^a i V i X i * y^a i V i X i + y^a i (44)
= yv =i a i -1yv '=i a i V i X i *yv= i a i V i X i (45)
Max La(a)=yv=ia i - ^y^ yv=i a ta jViVjXiXj where a i> 0 andy^a iVi =0
MaX La(a) = 1)Tr a -XiXiViVi ••■ XiXnViVnl iaTrl : ^ : la (47)
XiXn Vi Уп • XnXnVnVn where aTrV = 0 and a > 0
Solve dual to get optimal α for a few points (xi to x2) if binarV ^r (xi to Xn)if multiple parameter Therefore dual maximizes w(α) that solves the primal problem:
If we = y^^a i V i X i (48)
Then Vi (we * Xi + h) = 1 and h = — - we * Xi (49)
Put the values in equation (10) to generate the results .
-
III. Research Questions
The paper is based on the questions that arise as a customer shopping online. There is a need to verify where the study will be helpful; Can the method predict using SVM and C4.5 that a customer will buy products form a particular site just because the person visited the site is it mandatory that they will buy. It’s hard to predict, but if data is collected from the customer based on their visit to the site on certain items apart from the normal IP address scraping by giving the customer certain products on a particular site based on their visit. Therefore, first process is to get the data, prune the data by removing unnecessary outliers, use a method to generate the outcome and forecast based on the data collected. If a customer goes to a store he/she can compare costs of the products that are displayed in that store. But the problem is the stores cannot have a wide variety of products as they are not sure of their purchase; hence do not stock all products. Therefore, an online store will have most of the products displayed. But, apart from the product availability the customer needs to verify a product cost from different sites. The customers require a single place online where the costs of the products can be compared. The first question is based on API implementation that compares costs of a given product from different sites to be displayed on one screen. Finally predicting if a customer logged in will buy from the site.
-
IV. Tables Used
The site uses eight tables , the details are mentioned as follows:
-
• Table CustomerDetails ‘N’ is used to store the customer’s information.
-
• Whenever customers enter their data for the first time during registration this table is filled up with a new entry.
-
• Table Education is used to store the education details and its appropriate EID and all this is used in CustomerDetails’N’ table.
-
• Table Product_Group is used to store the offer details of the product this table can be maintained by administrator.
-
• Table Product_Details is used to store all the product related information this table can be maintained by administrator.
-
• Table RecentlyViewed stores the IP address of the user so that it could show recently viewed products to the user, the next time user visits the website.
-
• Table wishlistCartDetails stores the wishlist information, whenever user adds any product to wishlist this table is updated with that information.
-
• Table CustomerDetails for SVM, this table stores the historic details of the customers. This table is used to generate the CSV file of all the historic data which is used for current prediction.
-
• Table Admin Login is used to store the login details of the administrator.
-
V. Proposed Solution
-
A. API for price comparison of different sites
Let’s look into Graphic User Interface (GUI) to understand Application Program Interface (API)[14]. The GUI makes it easier for a non-programmer to use the online implementation easily without the need to understand how the implementation works as he/she enters the information. For e.g.: Entering the user name and password in the given form fields for accessing the emails on pressing the submit button. The user does not understand the code but is able to access, send, and receive the mail without any hindrance. Similarly API helps the programmer copy a document from one point to another without understanding the document system.
This paper deals with use one situation level rational and not different situation level rational as depicted in figure 2, with different API[15] for each of the sites namely flip cart, amazon and eBay and updating is done at the fact level. Therefore there is no need of having different rational for each site. Hence the comparison of products of at least some products can be done on a single site as is implemented in this paper shown in figure 3. Here we see all the details of the sites are under one roof.
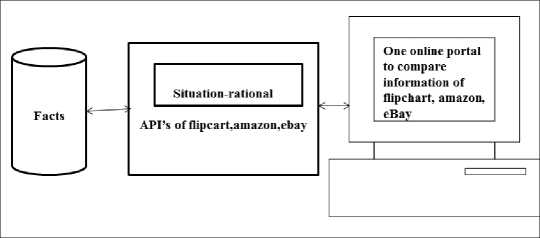
Fig.3. Implementation with API base on figure 1
API is a code used by a third party to develop and get required information from a specific site. Hence the developer need use many libraries to create an application to find information on specific site, but use the specific site API to get information.
-
B. SVM for Customer prediction
After the user has bought the product form the site, take age, education and salary information from the user. This information will be used to give better deals to the user. SVM is based on the straight-line principle; here the line divides the probable and non-probable results. As h is the hyperplane that segregates the data, h is 1 for probable data and -1 for non-probable data. Selecting w and h will generate proper distance from the hyperplane h. This gives an insight into proper separation of data. Hence w.x+h=1or w.x+h=-1, as the data being considered may not be in a given range this formula is helpful for dividing the data. The boundary h/|| w || neutralizes the data from the base point with the angle w.
Therefore, SVM has to follow the following approach(a brief algorithm):
Create the fact
Clean the fact
Arrange h=1 to n for cleaned data.
If fact =1
h=1
else h=-1
Hence for a function: /^) = £ " =1 wt xt + h (50)
The data is separated to generate the desired outcome.
Hence generate the SVM method and get the forecast based on the teaching done at the start.
-
VI. Experimental Results
-
A. Use of API for Analysis
This project uses API’s, the results are shown in figures 4 to 6. Enter the name of the product in the search space as shown in figure 4. On click of the search button different products appear on screen as shown in figure 5. It’s easier for the customer to compare price of a product displayed on different sites available at one location on one screen.
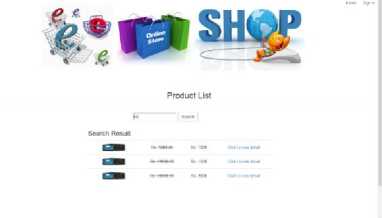
Fig.4. Search Product
As shown in figure 6, the user needs to enter a unique Userid and password to login into the application program. As soon as the user enters the valid information the user session starts. In some cases, the session times out if there is any problem in the internet connectivity.
If the user is new, the new user button takes the person to registration screen. Here the user fills in the name, emailed, contact, age, gender, income, education. On clicking the register button the password is sent to the emailed of the user. The user can change the password at any given time.
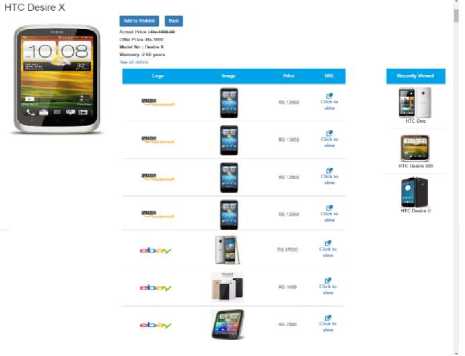
Fig.5. Display of prices from different sites
Let’s compare the result in figure 5 with the ebay and amazon as shown in figure 7 and 8.
Fill in the name of the product is the search field. The results are shown in the figure 7. Though one gets the information of the product it’s not as useful as in figure 5 and it is giving the product information and also comparing it with the other site.

Fig.6. Login screen to get details of the customer
-
• Products on amazon
Similarly, as one enters the name of the product here in amazon, the site gives the case information of the product apart from the product on display which is displayed in figure 8.
-
• Products on ebay
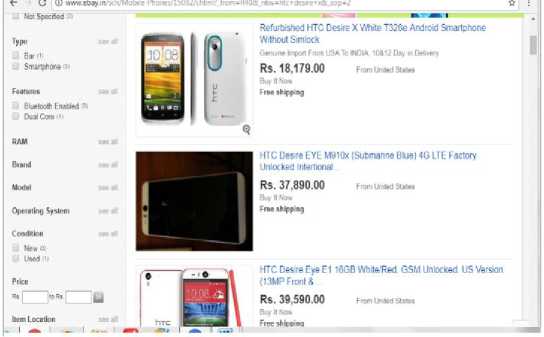
Fig.7. Display of prices on ebay
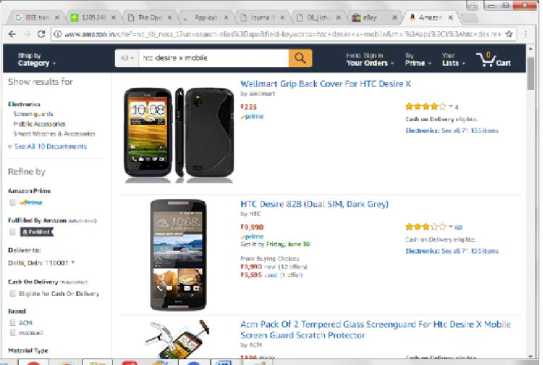
Fig.8. Display of prices on amazon
The sites that are considered of comparison are the best sites available but there are some flaws as explained in previous points. The flaws are rectified in the application that is created that is shown in figure 5.
-
• Comparison of product display on different sites
The table 1 shows the products displayed on different sites; it also shows that eSHOP gives better information as it is dealing with only the discounts being offered by the site based on customer wish list collected by the site. A total of 31 products were fed into the search engines of each site, the average outcome of the generated data by the sites were considered.
Table 1. Comparison of products display
|
Result |
eBay |
Amazon |
eSHOP |
|
Correct |
99.5 |
98.9 |
100 |
|
Wrong |
0.5 |
1.1 |
Nil |
Figure 9 shows that eSHOP gives correct data by using the API’s provided by eBay and Amazon.
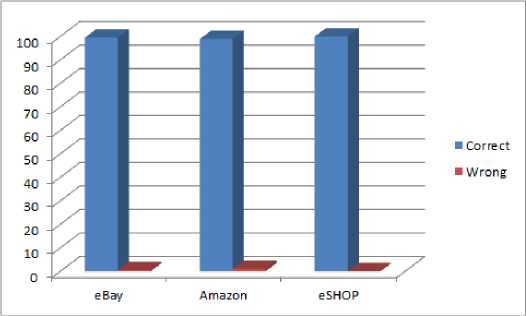
Fig.9. Bar graph of correct data displayed on the sites in table 1
-
B. Prediction of customer purchase
The data being considered is 57 data sets for training and 43 data sets for testing of prediction of customer purchase. The same data set is used for SVM(primal and dual) and C4.5. The paper discuses mainly binary classification.
-
• Prediction of Customer purchase using SVM
As mentioned the training data is used to generate weights and plane bias’h’ as shown in table 2. Primal gives the weight and dual is used to generate few support vectors α that lie on the plane. The basic idea is to maximize the distance of the planes so that there is no mixing of positive data with that of the negative data. The weights ‘we1’ and ‘we2’ of primal and dual are slightly different as the forecasting is based on the age and education of the customer w.r.t to the salary. The outcome y labels are generated based on the salary.
Table 2. Comparison of results of SVM weights and bias (primal -Dual)
|
We1 |
We2 |
h |
Min/max |
|
|
SVM Primal |
2 |
2 |
-99.0 |
Min=2 |
|
SVM Dual |
1.99 |
1.99 |
-80.6 |
Max=3.99 |
-
• Prediction of customer purchase using SVM and C4.5
The information of customers are gathered and trained, the SVM and C4.5; 2D data set is 57 for training are depicted in table 3. The trained information is then tested with 43 data sets as shown in table 4.
Table 3. Comparison training results of SVM and C4.5
|
RESULT |
SVM |
C4.5 |
|
True Positive |
100 |
75 |
|
False Positive |
0 |
25 |
|
False Negative |
0 |
0 |
|
True Negative |
100 |
100 |
Table 4. Comparison testing results of SVM and C4.5
|
RESULT |
SVM |
C4.5 |
|
True Positive |
100 |
61 |
|
False Positive |
0 |
39 |
|
False Negative |
0 |
15 |
|
True Negative |
100 |
85 |
The tables 5 and 6 depict the training and testing data for positives and negatives respectively.
Table 5. Comparison training and testing results of positives for SVM and C4.5
|
Comparison of True positives and False positive |
Size of data |
True positive(%) |
False positive(%) |
||
|
SVM |
C4.5 |
SVM |
C4.5 |
||
|
Training data |
57 |
100 |
75 |
0 |
25 |
|
Testing data |
43 |
100 |
61 |
0 |
39 |
The Table 5 and figure 10 shows that SVM gives better results for training and testing of positives whereas C4.5 gives better results for training and the tested results are not 100%. for positives The data used is same for both training as well as testing.
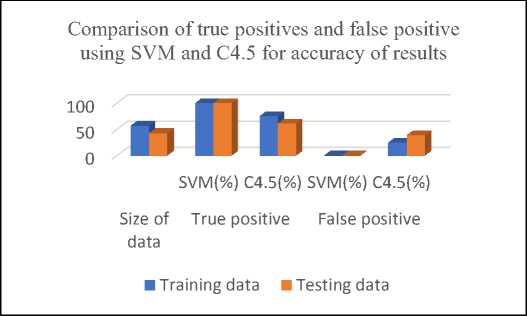
Fig.10. Comparison of true positives and false positive using SVM and C4.5 for accuracy of results
In table 6 and figure 11the true negative is 100% for both the methods which is good as the methods specify that the customers are not potential customers. This is a good analysis for giving more deals to potential customers rather than non-potential customers. But the testing shows that SVM performs better while predicting the false negative. As is depicted false negative needs to be zero for training as well as testing. But this is not the case with C4.5 Though true negative is high showing 80% nonpotential customers, it also give 15% false negative this is depicting non-potential customers as potential customers.
Table 6. Comparison training and testing results of negatives for SVM and C4.5
|
Comparison of false negative and true negative |
Size of data |
False negative (%) |
True negative (%) |
||
|
SVM |
C4.5 |
SVM |
C4.5 |
||
|
Training data |
57 |
0 |
0 |
100 |
100 |
|
Testing data |
43 |
0 |
15 |
100 |
85 |
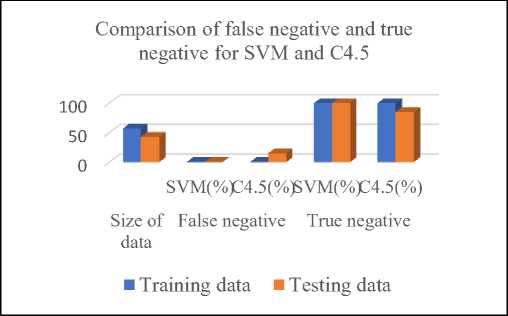
Fig.11. Comparison of false negative and true negative for SVM and C4.5
-
VII. Inference of experimental results
-
A. Use of API
As shown in figure 3, use of API helps in getting the information of some sites and specific products the user wants to browse through. Hence provides a platform to compare the updated information from many sites under one roof.
-
B. SVM prediction
SVM is used for linear classification and hence the test results of the data need to be 100%. The cent percent results are depicted in table 3. True Positive outcome will give the correct specification of how many among the existing customers are potential buyers.
-
C. C4.5 prediction
Though C4.5 gives better customer predication for training data it does not give better customer prediction for testing results. During prediction the true negative has to be nearing 100% accuracy as this gives an idea of the potential non-buyers
-
VIII. Conclusion
A site can be developed without using the API of different portals for comparison, but any change in the situation logic of amazon or eBay may not be reflected in the present site that is developed for comparison. Flipcart is used for depiction only, not used in the actual implementation. All online sites do not provide their
API’s for free hence only two API’s are used for the purpose of implementation in this paper. Comparing all sites under one roof is a task as all the online portals do not provide their API’s for free. Paying money to the online portals without having customer base is a major issue when developing a site that compares all products in one application. The API’s used here provide better results as they are updated. But it will not provide better results every time as the customer needs to search by providing multiple search feeds to get the required result.
In the future robots might use the application to find the desired results of deals of products on sites, in such a scenario API is the best answer.
The paper deals with API implementation for comparing prices of the same products on two different sites. Therefore, it is obvious that the product with the lowest cost on any of the site will be purchased. The focus of the paper is to provide the customer with extracting only the specified data that is to be given on discount by the eSHOP site. This will lead to better results as proper specification are given to the eSHOP API.
A prediction method is required to predict if the customer will be a potential buyer. 2D classification is used as it provides better results. The SVM and C4.5 used here are for binary classification as the binary method gives optimum results and it’s helpful in verifying the data. The SVM gives 100% positive prediction whereas C4.5 gives 75% positive prediction. Hence, it is necessary to generate better true positives. This shows SVM is a better classifier. While using C4.5 the conditional rules that give results also need to be pruned, this is not the case with SVM. Though pruning of input data needs to be done for both SVM and C4.5, there is not added burden in SVM of pruning conditional rules. There is always a point of improvement in any system, and the same is applicable here too. The paper does not talk about any efficiency related stuff, because that itself needs a full article.
References Use of API’s for Comparison of different product information under one roof: analysis using SVM
- Khampheth Bounnady , Khampaseuth Phanthavong ;, Somsanouk Pathoumvanh , Keokanlaya Sihalath (2016), “Comparison the processing speed between PHP and ASP.NET”, Electrical Engineering/Electronics, Computer, ,Telecommunications and Information Technology (ECTI-CON), 2016 13th International Conference on, DOI: 10.1109/ECTICon.2016.7561484
- P. Desai and G. R. Kulkarni (2014), "Necessity of customer inputs for online group shopping using Support Vector Machines," Proceedings of 3rd International Conference on Reliability, Infocom Technologies and Optimization, Noida, 2014, pp. 1-6.
- S.Subramanian, Laura Inozemtseva, Reid Holmes,” Live API Documentation”,(2014) International Conference on Software Engineering(ICSE), Hyderabad ,India 2014, Pages 643-652.
- F. Thung(2016), "API recommendation system for software development," 2016 31st IEEE/ACM International Conference on Automated Software Engineering (ASE), Singapore, pp. 896-899.
- Yi Yang ; Wenguang Chen (2016),”Taiga: performance optimization of the C4.5 decision tree construction algorithm”, Tsinghua Science and Technology , Volume: 21, Issue: 4 , DOI: 10.1109/TST.2016.7536719
- Tahira Mahboob , Sadaf Irfan , Aysha Karamat (2016),”A machine learning approach for student assessment in E-learning using Quinlan's C4.5, Naive Bayes and Random Forest algorithms”, Multi-Topic Conference (INMIC),19th International Conference, DOI: 10.1109/INMIC.2016.7840094
- Sardjoeni Moedjiono; Yosianus Robertus Isak ; Aries Kusdaryono (2016).”Customer loyalty prediction in multimedia Service Provider Company with K-Means segmentation and C4.5 algorithm”, Informatics and Computing (ICIC), DOI: 10.1109/IAC.2016.7905717
- Batra M., Agrawal R. (2018),” Comparative Analysis of Decision Tree Algorithms. In: Panigrahi B., Hoda M., Sharma V., Goel S. (eds) Nature Inspired Computing”, Advances in Intelligent Systems and Computing, vol 652. Springer, Singapore
- Seyyid Ahmed Medjahed, Mohammed Ouali, Tamazouzt Ait Saadi, Abdelkader Benyettou(2015),"An Optimization-Based Framework for Feature Selection and Parameters Determination of SVMs", IJITCS, vol.7, no.5, pp.1-9, 2015.DOI: 10.5815/ijitcs.2015.05.01
- A. Hajiha M. Shahriari, N. Vakilian (2014),“The role of perceived value on customer E-shopping intention using technology acceptance model, (TAM)”, Industrial Engineering and Engineering Management (IEEM), IEEE International Conference , DOI: 10.1109/IEEM.2014.7058816
- Munir Ahmad, Shabib Aftab(2017), "Analyzing the Performance of SVM for Polarity Detection with Different Datasets", International Journal of Modern Education and Computer Science(IJMECS), Vol.9, No.10, pp. 29-36, 2017.DOI: 10.5815/ijmecs.2017.10.04
- K. Maheswari ; P. Packia Amutha Priya(2017) “Predicting customer behavior in online shopping using SVM classifier”, Intelligent Techniques in Control, Optimization and Signal Processing (INCOS),IEEE International Conference, DOI:10.1109/ITCOSP.2017.8303085
- Ngoc, P.V., Ngoc, C.V.T., Ngoc, T.V.T. et al. (2017). Evolving Systems ,https://doi.org/10.1007/s12530-017-9180-1
- S. J. Lee, W. C. Su, C. E. Huang and J. L. You(2016), "Categorizing and Recommending API Usage Patterns Based osn Degree Centralities and Pattern Distances," 2016 International Computer Symposium (ICS), Chiayi, 2016, pp. 583-588.
- Grill T., Polacek O., Tscheligi M. (2012),” Methods towards API Usability: A Structural Analysis of Usability Problem Categories. In: Winckler M., Forbrig P., Bernhaupt R. (eds) Human-Centered Software Engineering. HCSE 2012. Lecture Notes in Computer Science, vol 7623. Springer, Berlin, Heidelberg
