Using Time Series Forecasting for Analysis of GDP Growth in India

Author: Malik Mubasher Hassan, Tabasum Mirza
Journal: International Journal of Education and Management Engineering @ijeme
Article in issue: 3 vol.11, 2021.
Free access
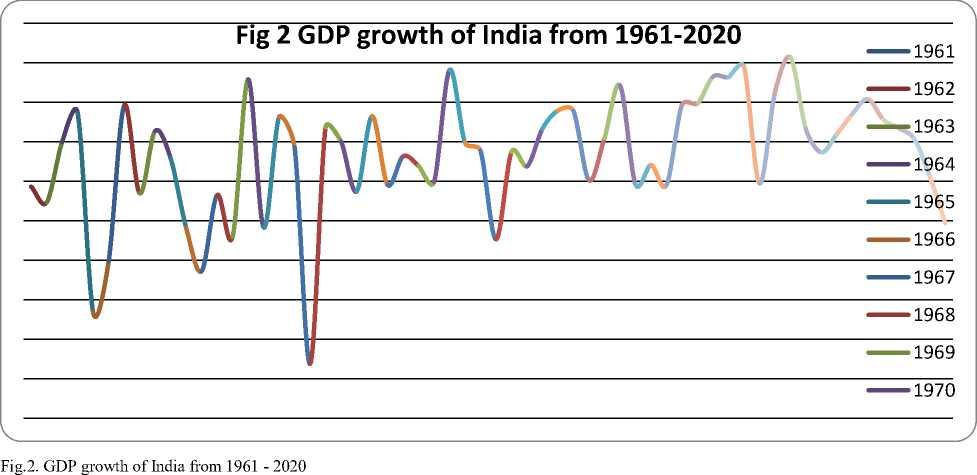
Gross Domestic Product is one of the most important economic indicators of the country and its positive or negative growth indicates the economic development of the country. It is calculated quarterly and yearly at the end of the financial year. The GDP growth of India has seen fluctuations from last few decades after independence and reached as high as 10.25 in 2010 and declined to low of -5.23 in 1979. The GDP growth has witnessed a continuous decline in the past five years, taking it from 8.15 in 2015 to 1.87 in 2020.The lockdown imposed in the country to curb the spread of COVID-19 has caused massive slowdown in the economy of the country by affecting all major contributing sectors of the GDP except agricultural sector. To keep on track on the GDP growth is one of the parameters for deciding the economic policies of the country. In this study, we are analyzing and forecasting the GDP growth using the time series forecasting techniques Prophet and Arima model. This model can assist policy makers in framing policies or making decisions.
GDP of India, Time Series Analysis, ARIMA model, Time series forecasting, PROPHET
Short address: https://sciup.org/15017847
IDR: 15017847 | DOI: 10.5815/ijeme.2021.03.05
Text of the scientific article Using Time Series Forecasting for Analysis of GDP Growth in India
Published Online June 2021 in MECS DOI: 10.5815/ijeme.2021.03.05
The Gross Domestic Product (GDP) is the value in totality of the services and goods produced within the geographic limits of a nation[1]. It is measured over specific period of time intervals within a year i.e. quarterly or once a year i.e. annually[2]. It is one of the most powerful statistical economic indicators that are used to assess the economic performance and development of the country[3,4]. It is also used to compare the economic health of the country at two points of time or economic health of two countries[5].
The concept of GDP was first given by William petty in UK between 1654 and 1676 to address the issue of unfair taxation by landlords during the warfare between the English and Dutch. The modern concept of GDP was given by Simon Kuznets for US Congress report in 1934 and gained popularity after Bretten Woods Conference in 1944.GDP became popular tool for assessment of national economic development and progress in world war -II[6].
GDP growth rate indicates the rate at which economy of country is growing positively or negatively. It is an important indicator used to measure development of a country with respect to time and can be used to indicate whether the country’s economy is growing or facing recession. Positive GDP growth rate of country indicates its economy is flourishing while as negative GDP growth indicates possible economic downturn[7].It acts as an aiding tool to economists in strategy formulation and policy framing of the country’s economy related policies. It also helps investors in making investment related decisions.GDP directly affects business, stock market, jobs and personal income and lower GDP indicates low stock prices[8].
GDP Growth Rate= [(GDP1)/ (GDP2)-1]
Where GDP1 is GDP for year1 and GDP2 is GDP for year[9,10,11].
GDP is measured by three methods
-
• Income based method
-
• Output based method
-
• Expenditure method
-
2. Background of the GDP Forecasting
GDP (G) has four component consumption (C), Investment (N), government spending (S) and net exports (E-I)
G=C+N+S+ (E-I)
Where Investment=government spending(S) =Sum of Government expenditure on final goods and services = Gross exports, I =Gross Imports[12].
The structure of the manuscript is as follows: The section 2 gives the breaf background of the GDP analysis. The section 3 and 4 depicts the objectives and methodology respectively. The section 5 explains the results obtained. The conclusion is given in the section 6 followed by references.
There are two types of GDP:-
-
• Nominal GDP: It refers to the goods and services produced in context to their total monetary values at current prices within the geographical limits of a country by citizens as well as foreigners. It is more useful than real GDP in comparison of the economic health of a nation over a period of time and is sensitive to both the changes in quantity and price levels.
-
• Real GDP: All formed goods and services produced in a country, their total monetary value at constant process is actually referred the real GDP. It can be used for effective comparison of economic growth at different periods of time with freedom from the effects of changing price levels.
GDP deflator= Nominal GDP /Real GDP - 1
GDP per Capita is the GDP or economic output of the country divided by the size of the population. It is used to assess income of individuals and indicate the standard of living in the country.
There are certain limitations in using GDP as the assessment parameter to measure economy of the country. One of them is that increase in GDP doesn’t necessarily mean the positive growth or expansion of the economy, sometimes change in market value of goods and services also affect the GDP growth rate making comparison using GDP growth rate inaccurate or difficult.
The Government releases GDP numbers after every two months, but annual GDP numbers are issued on May 31 of every year.
In India the main sectors contribute to the GDP of the country are manufacturing, mining, agriculture, construction, forestry and fishing, insurance and business services, transport and communication, electricity and gas supply, trade, hotel, real estate, social and public services, financing, and social and public services.
In India GDP is measured at market prices and the base year used for calculation is 2011-12.
GDP at market price=GDP in factor+ Indirect Taxes-Subsidies
India is a fast growing economy, ranks 5th by nominal GDP and third by purchasing power parity in the world. From the independence in India i.e. 1947 to 1991 India has witnessed remarkable economic growth and in the 21st century, annual average GDP growth is recorded as 6-7%, making it the world’s largest growing economy, surpassing china in the time period of 2014-18.India is ranked on 139th position by nominal GDP and 118th position by GDP(PPP) in 2018.
India is 6th largest manufacturer in the world, producing almost 3% of total global manufacturing output and employs more than 57 million populations. Majority of Indian population lives in rural areas and depends on agriculture as their primary source of livelihood. Agriculture contributes to almost 50% of total GDP of India. India is ranked second largest producer of global food and agricultural production and agricultural exports amounting to $38.5 billion. Construction and real estate is the second largest employer after agriculture and is a very important component of GDP of the country. The textile industry of India contributes to 2% of country’s GDP, employs over 45 million people and has a net worth of $150 billion. India is major exporter of IT services, Indian IT industry employs over 4 million population and earns $180 billion revenue .The Indian telecom industry is second largest in the world in terms of mobile phone and internet users contributing to more than 10% of country’s GDP[15]. Indian ecommerce market is growing rapidly. India is rich in natural resources and world’s second largest producer of coal, second largest steel and cement producer and third largest electricity producer in the world. Mining sector contributes 2.5% of Indian GDP and 11% of country’s industrial GDF. India has the world's second largest labour force with 520 million workers as per 2019 statistics. Indian Foreign direct investment (FDI) for 2018-19 was $ 64.4 billion and major contributors to FDI are services sector, computer and telecom sector[16,17].
GDP in India reached an all time high of 13.3% in March 2010 and lowest of 0.2% in March 2009.The global rating agencies are forecasting further decline in GDP growth for almost all countries across the globe for FY 21 because of the pandemic. There is a projection of contraction of 3.1% in 2020 with recovery of 4.8% that will be followed in 2021.The lockdown imposed in the country in an effort to contain the spread of COVID-19 followed by partial lockdown and phase wise unlocking has affected manufacturing and services sector causing 40% drop in the economic activity of the country. During the Q1 economic activity was pushed down by the considerable levels because of lockdown affecting key sectors like construction, manufacturing, hotels, trade, communication, transport and services related to broadcasting constitutes the 45% of the total national economy, have been affected severely in terms of volume and profit during the period of lockdown [Icra]. The sale of domestic passenger vehicles and two-wheelers, the deal in capital goods, steel output, imports by value (not including oil and gold), and railway and aviation passenger traffic showed sharp decline amidst pandemic[18].
In India, it is predicted that the GDP in 2020-2021 may come down to 5.3%. If this prediction is proved true, it could be the India’s lowest GDP rate in the history. Based on the expectations evolved from the credit ratings agency, the GDP may bounce back to 506% in the 2021-2022 fiscal years[19]. The covid-19 pandemic has almost crippled the economic sectors in both small to large domain. Not only in India, but all across the globe the closure of economic sectors has badly affected the economy and likely to continue its shadow in the coming days as well. There is no certain timeline by which time the things would improve. The gradual normalcy in the GDP is expected in 2021-2022[20]. The government of India announced monetary support worth rupees 20.97 lakh Crore to reduce the impact due to coronavirus breakout and it further pushed the already slowing down economy into standstill[21].
Machine learning and Time series forecasting techniques are popular for analysis and forecasting future trends for various parameters and can be used for prediction of GDP growth trend in India for near future [22,23].
In this research paper we are using time series forecasting techniques to forecast the GDP growth of India for next ten years i.e. from 2020 to 2030[24].
-
3. Objectives
-
a. Analysis of GDP growth trend in India from 1951 to 2020
-
b. Forecasting of GDP growth trend in India from 2020 to 2030
-
-
4. Methodology
The methodology adopted is depicted in the fig.1. and the following steps is the description of the steps involved in the sequence. At the end, the evaluation is performed and the final results are obtained.
-
a. Data collection . We have collected the GDP growth data for India from 1951-2020 from a comma-separated (CSV) file available for download on the official website of Open Government Data (OGD) Platform India, and uploaded that in Excel 2013.Then data was cleaned , extracted and converted into Time series data to be used for analysis and forecasting in R studio software.
-
b. Analysis of data . Data was analyzed for missing values and plotted to visualize the GDP growth of India from 1951-2020.
-
c. Time series forecasting . Time series forecasting with ARIMA Model and PROPHET is used for forecasting the trend of GDP growth in the near future, i.e. for next ten years from 2020-2030.
-
d. Validation of results. Models are validated on the basis of comparison of actual test data with the forecasted data by dividing the dataset into a training set and testing set. The model prediction is then tested on test data for ten years with actual data to check the predictive capability of the model.
-
4.1. Arima
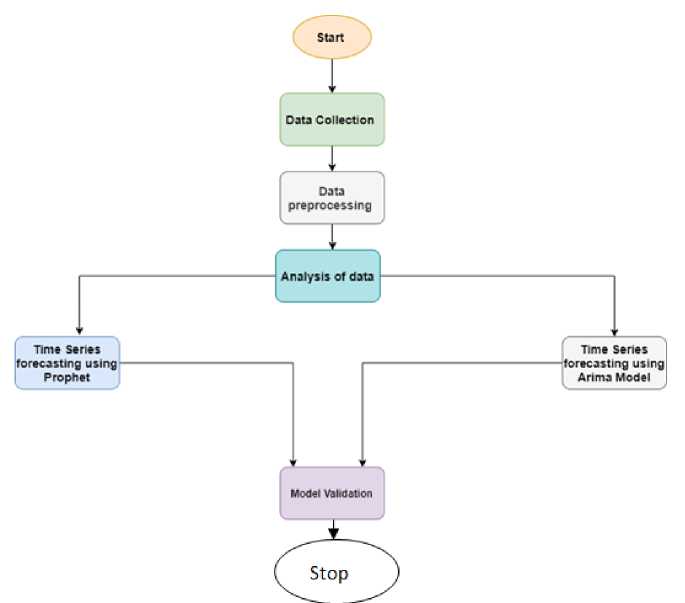
Fig.1. Flow chart of the methodology adopted for the GDP forecasting.
It is an acronym for 'Auto Regressive Integrated Moving Average' i.e. a class of statistical models that can be used for modeling stationary time series data on the basis of its past values, lags between observations and the lagged forecast errors, used to forecast or predict future values. The ARIMA model has three components:
AR(Auto Regression)
Integrated- representing the degree of differencing to make time series stationary
MA(Moving Average)
The ARIMA model is denoted as ARIMA (n, f, p), in which n determines the order of auto regression terms, f is the degree of differencing used to form a stationary time series, and p is the order of moving average. The value of ‘v’ at time t for an ARIMA model is estimated as equation (1). Here the moving average parameter is denoted by '0'
At f=0; vt = Vt
At f=1; vt = Vt - Vt-1
At f=2; ( v t = V t - V t—i )-( V = V - V - ) = V t - 2V t—i + 2V t- 2
At f=2, the second difference was actually the 1st difference of the 1st difference and not the difference of the 2 periods ago. It is not the local trend, but it is the local acceleration of the series.
The general forecasting equation in terms of v is given by:
vt = Ц + 01Vt-1 + 0nVt-n -K1 S t-1 -----K p 6 t-p (1)
The time series is checked for stationary using Augmented Dickey Fuller (ADF) test and may require logging or differencing of terms to make it stationary and to stabilize the series[25] [26][27][28].
-
4.2. Prophet
It is an open source Face book library that can be used for decomposition of time series and forecasting of future trends easily and accurately. This model is flexible in nature and can deal well with missing values. The time series model is additive in nature and fits linear data. It has three main components:
Trend
Seasonality
Holidays
The general equation for PROPHET model is given as:
y(t) = y(t) + s(t) + h(t) + e(t) (2)
Where g(t) logistic growth curve for modeling non periodic changes in time series. s(t) is periodic changes, h(t) is effectiveness of yearly seasonally holidays and e(t) is error term accounts unusual changes not accommodated by model[29, 30]. The other alternative techniques available for forecasting the GDP are also taken into reference while taking this study [31].
5. Results and Findings
5.1. Time series forecasting of GDP in India using Prophet
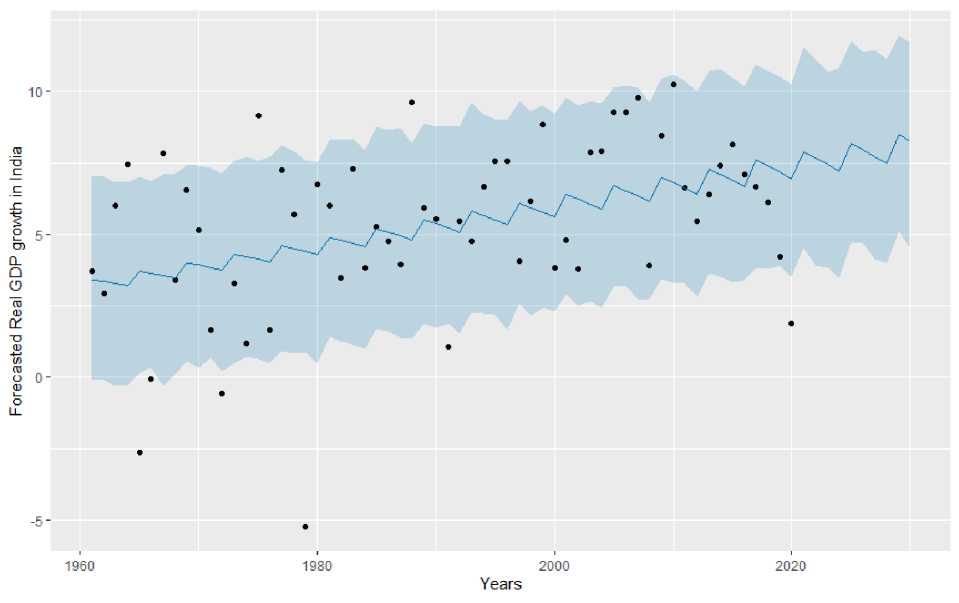
Fig. 3. plots the forecasted GDP growth in India from 2020-2030 using Prophet and indicates steady growth in the GDP value of India every year till 2030
Table 1. Forecasted GDP growth in India from 2021-2030 using Prophet
|
Forecast |
Lower Forecast |
Upper Forecast |
|
3.87472575 |
3.328305173 |
7.584486 |
|
4.05680805 |
3.397433828 |
7.556841 |
|
4.04059877 |
3.466562484 |
7.507688 |
|
3.90293958 |
3.535691141 |
7.437169 |
|
4.43411949 |
3.605009191 |
7.86119 |
|
4.33090538 |
3.674137848 |
7.833545 |
|
4.1526732 |
3.743266505 |
7.784392 |
|
4.31190216 |
3.812395162 |
7.713873 |
|
4.61989856 |
3.881713215 |
8.137894 |
|
4.53453538 |
3.950841874 |
8.110249 |
The table 1 displays the forecasted GDP growth in India from 2021-2030 using PROPHET. The forecasting of GDP in India using PROPHET based on data from 1961 to 2020 indicates that the GDP will grow positively to 7.58 in Financial Year (FY) -2021.The GDP of India will continuously grow and reach up to a high of 8.11 in 2030.The average forecast indicates that GDP for FY-21 will be 3.8 and can grow positively up to 4.5 in 2030.
-
5.2. Time series forecasting using Arima Model
The time series of GDP in India from 1961-2020 was tested for being stationary. The Augmented Dickey Fuller test was performed on the time series with result of p-value of 0.01 indicating the series is stationary.

Fig. 4. ACF and PACF plot for the time series of GDP growth from 1961 - 2020
Figure 4 displays the ACF and PACF plot for the time series for Indian GDP. The ACF and PACF plots were used to find the values of Arima parameters n, f and p and Arima (1, 2, 1) were founded as the best model for forecasting.ACF are the coefficients of correlation determine the relationship between a time series and its lags and
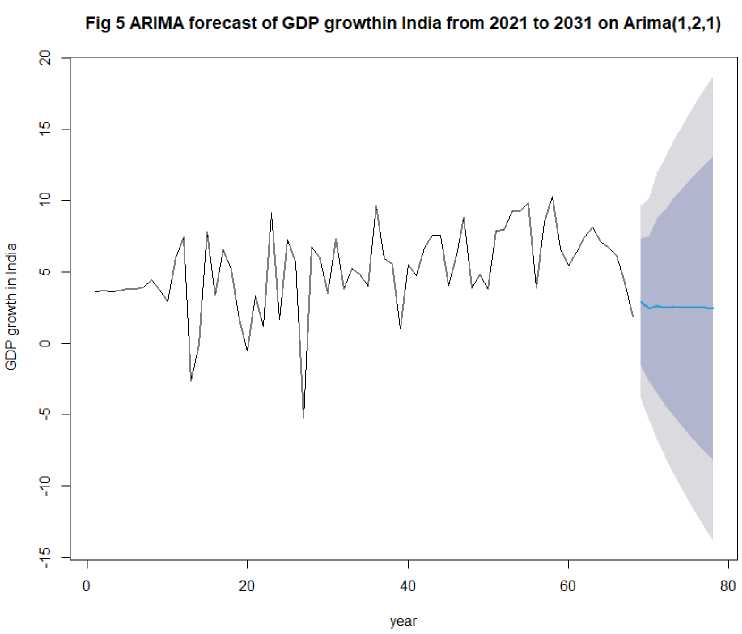
Fig.5. ARIMA forecast plot of GDP growth in India from 2021-2031 on Arima (1, 2, 1)
Figure 5 displays the forecasted plot for GDP growth in India from 2020-2030 using Arima (1, 2, 1) model based
|
on the Indian GDP values of last 60 years i.e Table 2. Forecasted GDP growth from 2021-2030 |
. from 1961-2020. |
||
|
Year |
Forecast |
Lo at 95% CI |
Hi at 95% CI |
|
2021 |
2.909092 |
-3.837576 |
9.655759 |
|
2022 |
2.419223 |
-5.329275 |
10.167720 |
|
2023 |
2.617102 |
-6.731222 |
11.965426 |
|
2024 |
2.505622 |
-7.952256 |
12.963501 |
|
2025 |
2.533297 |
-9.070155 |
14.136749 |
|
2026 |
2.498378 |
10.124073 |
15.120829 |
|
2027 |
2.491614 |
11.117655 |
16.100884 |
|
2028 |
2.472186 |
12.070377 |
17.014749 |
|
2029 |
2.458455 |
12.985601 |
17.902511 |
|
2030 |
2.442161 |
13.871681 |
18.756003 |
Table 2 displays the mean forecasted GDP values for next ten years, i.e. from 2021-2030 using Arima (1, 2, 1) model on 95% confidence interval. The forecasted results predict the GDP forecast for FY 2021 as 2.90 and then the GDP growth is declining or showing negative growth in coming years in the average case scenario. The prediction suggests that the GDP of India can drop up to the value of 2.44 in 2030.As per the best case scenario, GDP of India will increase with time and forecasted GDP of 9.6% in 2021 and GDP can increase up to 18.75 in 2030.
Fig 6 Predicted VS Actual GDP growth in India from 1951 to 2020
Fig. 6. Predicted VS Actual GDP growth in India from 1951-2020
Validation of results was done by dividing the total dataset into training data set for GDP data from 1961 -2010 and test data set including GDP data from 2010-2020 and then comparing the predicted values with the test data set. The actual versus predicted results were plotted in Figure 6 for visualization.
Table 3. Parameters of ARIMA model (1, 2, 1).
|
ME |
RMSE |
MAE |
MAPE |
MASE |
|
0.07557139 |
3.314592 |
2.299306 |
103.1148 |
0.8723103 |
Table 3 displays the parameters for Arima model used for forecasting of GDP in India from 2021-2030. In this study, we used five performance measures to indicate goodness of fit of the model, namely Mean Error (ME), Mean Absolute Error (MAE), Mean Absolute Percentage Error (MAPE) and Root Mean Square Error (RMSE). The low values of MAE, RMSE, MAPE and ME indicate a good fit of the models. The MAE is smaller than the RMSE that indicates presence of low errors in the variance.
The other available approaches to forecast the GDP are Linear Probability model (LPM), Logit model (LM), Probit model (PM),and Tobit model (TM). In addition to these techniques, there are some forecasting methods based on qualitative approach and are exclusively based on opinions about the future trends. These models are also interrelated with the technological changes. The complementary methods like a straight line (Constant growth rate), Moving average (repeated forecasts), simple linear regression (comparing of independent and dependent variable), and multiple linear regression (comparing of one dependent variable with more than one independent variable) is also used for the prediction and forecasting the GDP. The proposed technique based on machine learning is compared with these techniques and shows the promising results.
-
6. Conclusion
In this study, we are using time series forecasting techniques PROPHET and ARIMA model to forecast GDP growth for 2021-2030.The Arima (1, 2, 1) fits the model and has indicated good predictive capability as per validation and performance parameters like RMSE, MAPE and MASE. The Prophet's model has shown an increasing trend in GDP of India for coming years and according to the model, forecasted GDP of 2021 will be 3.8 and will show positive growth up to 4.5 in 2030.The Arima model forecasting results indicate that the GDP growth for 2021 will be 2.9. Further, it will show decreasing trend in coming years and can come down to 2.44 to 2030 as per average forecasting results. It shows an increasing trend at 95% confidence interval and can reach to a high of 18.75 for 2030 in the best case scenario. The forecasting models can help investors or policy makers in decision making. Although the GDP of the
country can be influenced by different conditions and thus predictions can vary in the future. This model has some limitations and future prospects can take into account other parameters affecting the economic conditions of the country as well. The monetary policy decisions by the policy makers make better use of forecasting macroeconomic variables such as GDP along with the inflation rate to assess the future state of economics. The proposed study gives the GDP forecasting and inflation rate can be future prospective of the given study.
References Using Time Series Forecasting for Analysis of GDP Growth in India
- “The Power of a Single Number: A Political History of GDP on JSTOR.” https://www.jstor.org/stable/10.7312/lepe17510 (accessed Aug. 24, 2020).
- “What is Gross Domestic Product (GDP)? - The Financial Express.” https://www.financialexpress.com/what-is/gross-domestic-product-gdp-meaning/1619044/ (accessed Aug. 24, 2020).
- “Gross Domestic Product | U.S. Bureau of Economic Analysis (BEA),” www.bea.gov, Accessed: Aug. 24, 2020. [Online]. Available: https://www.bea.gov/data/gdp/gross-domestic-product.
- “Measuring the Economy 1: Gross Domestic Product (GDP) | SparkNotes.” https://www.sparknotes.com/economics/macro/measuring1/section1/ (accessed Aug. 24, 2020).
- “(1) (PDF) Estimation, Analysis and Projection of India’s GDP.” https://www.researchgate.net/publication/228304100_Estimation_Analysis_and_Projection_of_India’s _GDP (accessed Aug. 24, 2020).
- P. Lepenies, The Power of a Single Number. Columbia University Press, 2016.
- “What Is GDP and Why Is It So Important to Economists and Investors?” https://www.investopedia.com/ask/answers/what-is-gdp-why-its-important-to-economists-investors/ (accessed Aug. 24, 2020).
- “It’s Your Business: GDP (Business Reference Services, Library of Congress).” https://www.loc.gov/rr/business/its-your-business/gdp.html (accessed Aug. 24, 2020).
- “Principles of Macroeconomics , 2.”
- Centre for the Advancement of the Steady State Economy, “GDP and Indicators of Economic Wellbeing.”
- X. Wang, “The Income of Nations: Defining and Measuring Macroeconomic Aggregates,” 2017, [Online]. Available: https://www.brookings.edu/wp-content/uploads/2018/08/WP43-8.23.18.pdf.
- K. Dynan and L. Sheiner, “GDP as a Measure of Economic,” pp. 1–53.
- M. Feldstein, “Underestimating the real growth of GDP, personal income, and productivity,” J. Econ. Perspect., vol. 31, no. 2, pp. 145–164, 2017, doi: 10.1257/jep.31.2.145.
- J. S. Landefeld, E. P. Seskin, and B. M. Fraumeni, “Taking the pulse of the economy: Measuring GDP,” J. Econ. Perspect., vol. 22, no. 2, pp. 193–216, 2008, doi: 10.1257/jep.22.2.193.
- R. Chn et al., “Gross domestic product 2019 , PPP Gross domestic product 2019 , PPP,” no. July, pp. 1–4, 2020, [Online]. Available: https://databank.worldbank.org/data/download/GDP_PPP.pdf.
- R. N. A. Raja Aziz and A. Azmi, “Impact of Foreign Direct Investment ( FDI ) inflow on Gross Domestic Product ( GDP ) of India — an Empirical study .,” World Appl. Sci. J., vol. 3, no. 10, pp. 1358–1361, 2013, doi: 10.5829/idosi.wasj.2013.24.10.229.
- Prof. Dr. Zubair Hasan, “[WIP] Mp r a,” Econ. Policy, no. 2116, pp. 0–33, 2011, doi: 10.1227/01.NEU.0000349921.14519.2A.
- M. Maliszewska, A. Mattoo, and D. Van Der Mensbrugghe, “The Potential Impact of COVID-19 on GDP and Trade : A Preliminary Assessment,” vol. 1, no. April, 2020.
- R. Nagaraj, “Growth Rate of India’s GDP, 1950-51 to 1987-88, Examination of Alteranative Hypothesis,” Econ. Polit. Wkly., vol. 25, no. 26, pp. 1396–1403, 1990.
- “India GDP Rate: India’s GDP growth could plummet to -15.2% y-o-y from 3.1% in Q1: Nomura - The Economic Times.” https://economictimes.indiatimes.com/news/economy/indicators/indias-gdp-growth-to-plummet-to-15-2-y-o-y-from-3-1-in-q1-nomura/articleshow/77759863.cms (accessed Aug. 26, 2020).
- “India GDP forecast: Indian economy expected to contract by around 25 per cent in the first quarter of FY’21: Report - The Economic Times.” https://economictimes.indiatimes.com/news/economy/indicators/indian-economy-expected-to-contract-by-around-25-per-cent-in-the-first-quarter-of-fy21-report/articleshow/77739356.cms (accessed Aug. 26, 2020).
- B. Maity and B. Chatterjee, “FORECASTING GDP GROWTH RATES OF INDIA: An Empirical Study,” Int. J. Econ. Manag. Sci., vol. 1, no. 9, pp. 52–58, 2012.
- S. L. Ho and M. Xie, “The use of ARIMA models for reliability forecasting and analysis,” Comput. Ind. Eng., vol. 35, no. 1–2, pp. 213–216, Oct. 1998, doi: 10.1016/s0360-8352(98)00066-7.
- “Lesson 3: Identifying and Estimating ARIMA models; Using ARIMA models to forecast future values.” https://online.stat.psu.edu/stat510/book/export/html/665 (accessed Jul. 29, 2020).
- R. Nau, “Mathematical structure of ARIMA models,” vol. 1, no. c, pp. 1–8, 2014.
- “Time Series Regression and ARIMA Models | SpringerLink.” https://link.springer.com/chapter/10.1007/978-1-4757-3261-0_2 (accessed Jul. 29, 2020).
- A. C. Harvey, “ARIMA models,” New Palgrave Dict. Econ., p. 1, 2011, doi: 10.1057/9780230226203.1992.
- R. H. Shumway and D. S. Stoffer, “Time Series Regression and ARIMA Models,” Springer, New York, NY, 2000, pp. 89–212.
- S. J. Taylor and B. Letham, “Business Time Series Forecasting at Scale,” PeerJ Prepr. 5e3190v2, vol. 35, no. 8, pp. 48–90, 2017, doi: 10.7287/peerj.preprints.3190v2.
- E. Žunić, K. Korjenić, K. Hodžić, and D. Đonko, “Application of Facebook’s Prophet Algorithm for Successful Sales Forecasting Based on Real-world Data,” Int. J. Comput. Sci. Inf. Technol., vol. 12, no. 2, pp. 23–36, 2020, doi: 10.5121/ijcsit.2020.12203.
- Dominique Guegan, Patrick Rakotomarolahy,” Alternative methods for forecasting GDP””, HAL Id: halshs-00511979; https://halshs.archives-ouvertes.fr/halshs-00511979; 2010
