Utilizing Random Forest and XGBoost Data Mining Algorithms for Anticipating Students’ Academic Performance

Author: Mukesh Kumar, Navneet Singh, Jessica Wadhwa, Palak Singh, Girish Kumar, Ahmed Qtaishat
Journal: International Journal of Modern Education and Computer Science @ijmecs
Article in issue: 2 vol.16, 2024.
Free access
The growing field of educational data mining seeks to analyse educational data in order to develop models for improving education and the effectiveness of educational institutions. Educational data mining is utilised to develop novel approaches for extracting information from educational databases, enabling improved decision-making within the educational system. The main objective of this research paper is to investigate recent advancements in data mining techniques within the field of educational research, while also analysing the methodologies employed by previous researchers in this area. The predictive capabilities of various machine learning algorithms, namely Logistic Regression, Gaussian Naive Bayes, Support Vector Machine, Random Forest, K-Nearest Neighbour, and XGBoost Classifier, were evaluated and compared for their effectiveness in determining students' academic performance. The utilisation of Random Forest and XGBoost classifiers in analysing scholastic, behavioural, and additional student features has demonstrated superior accuracy compared to other algorithms. The training and testing of these classification models achieved an impressive accuracy rate of approximately (96.46% & 87.50%) and (95.05% & 84.38%), respectively. Employing this technique can provide educators with valuable insights into students' motivations and behaviours, ultimately leading to more effective instruction and reduced student failure rates. Students' achievements significantly influence the delivery of education.
Educational Data Mining, Classification Algorithm, Exploratory Data Analysis, Random Forest Classifier, XGBoost Classifier, Predictive Accuracy
Short address: https://sciup.org/15019159
IDR: 15019159 | DOI: 10.5815/ijmecs.2024.02.03
Text of the scientific article Utilizing Random Forest and XGBoost Data Mining Algorithms for Anticipating Students’ Academic Performance
Given the rising abundance of data in educational databases, predicting students' academic achievement through predictive analysis is a helpful strategy. Educational institutions are implementing evaluation approaches that are known to benefit students by facilitating talent development. In this context, Educational Data Mining (EDM) uses cuttingedge tools such as analytics and data mining to investigate and comprehend the learning process [1]. Machine learning is an important component of educational data mining (EDM), which entails gathering relevant data from many sources, such as social media and educational settings. This information includes student performance, demographics, and educational plans. EDM's major goal is to use data mining techniques to provide practical insights that can improve academic performance and influence decision-making processes [2]. Machine learning algorithms are capable of identifying nuanced patterns and connections among large and complicated datasets, making them essential for educational data mining. Machine learning has the potential to improve educational data mining on numerous fronts, including faster processing, higher accuracy, and more complete analysis [3]. As machine learning develops, we may anticipate seeing increasingly potent and complex algorithms that will significantly improve our understanding of student learning and success. Data mining means taking out the useful knowledge from the giant sets of data [4]. Basically, it changes the raw data into useful knowledge. It includes various methods like machine learning and database systems to identify the patterns. This data can be further used to make informed decisions, solve business problems, etc. Nowadays, data mining is used everywhere vast amounts of data are stored, e.g., in banks [5]. Through data analysis, data mining in education improves learning. The focus was on establishing techniques and locating various types of data from educational environments to use them to better understand the students. It focuses mostly on new tools and algorithms.
The research looks at how data mining techniques, notably Random Forest and XGBoost, can be used to predict students' academic achievement. This study is significant because it investigates the possibility of data-driven methodologies to predict student outcomes, thereby assisting educational institutions in identifying vulnerable students and providing specific assistance. The research intends to provide insights into students' academic performance patterns using data mining algorithms, allowing educators to modify instruction and support techniques accordingly. The findings of the article could help to build personalised learning approaches, which are increasingly recognised as helpful in boosting student engagement and achievement.
There are a total of six sections to this study. In Section 2, we review relevant research into predicting student performance with predictive analytics and ensembles of classifiers. Section 3 discusses the materials and methods used for this study. The proposed methodology is discussed in Section 4, which addresses the six different classification techniques of data mining. In Section 5, we will compare the implemented predictive model with the existing literature, and in Section 6, we will draw conclusions based on our findings.
2. Literature Review
A good education may help you overcome numerous challenges in your life. A good education is the best way to increase one's chances of getting a job down the road. DM using EDM is popular because of how well it can glean insights from freshly collected data. Researchers have found and presented a plethora of models to explain predictive modelling of student performance, retention, and success after examining data over several decades.
Shahiri, A. M. et al. [8] started predicting student performance with a huge amount of data from educational databases, and it becomes harder as the population grows. The current system to evaluate student performance and growth has some shortcomings. First, they cannot be properly evaluated using the current prediction method. Second, this systematic literature provides an overview of the prediction algorithm used to determine the strongest framework for predicting student performance using data mining techniques because there has not been enough research on the factors influencing learners' performance. Students, teachers, and institutions may benefit from using this strategy to enhance their teaching and learning procedures. To measure learners' performance, the educational system uses metaanalysis with neutral networks and decision trees.
Amrieh, E. A. et al. [9] used data mining techniques' whose effectiveness is dependent on the features and data that have been acquired, hence educational data mining focuses on identifying undiscovered patterns in educational data. A novel student performance model known as specific characteristics has been proposed in this proposal. Data from an elearning system called Kal board 360 is collected using an API’s web server in combination with several data mining algorithms, including Native Bayesian and Decision Tree. There is a strong relation between learner performance and academic success during the learning process, as shown by the observation that adopting this affective feature will enhance classification accuracy by 29% when compared to not using it. The outcome demonstrates that the impact of behavioural characteristics on students' academic progress has been positively impacted by the application of data preprocessing techniques to data.
Ragab, A. H. M. et al. [15] have observed that the growth of educational data and its application to better management decision-making is one of the main issues facing educational institutions today, both in developing and advanced nations. The quality of the university is determined by its ability to offer services that best fulfil the demands of its students, teachers, and other participants in the educational system. This article suggests a fresh data mining approach for use in colleges and universities. The suggested model governs the area of student admissions and helps with strategic decision-making at the university.
Pandey, U. K. et al. [16] having a big dataset of records that contain important data, proposed some data mining methods that can be used to uncover this hidden data. Universities can locate these students consistently by determining the percentage of students based on the student database from the previous year, Bayesian classification techniques are applied. The task allocation for students will be made better with the aid of this study, for both students and teachers. The study will also try to pinpoint students who require extra help so that the necessary measures can be taken at the right time to reduce rationing failures.
Khan, A. et al. [18] have noted that one of the most challenging and well-liked research topics in data mining in education is modelling student performance. The impact of many variables on performance is not linear. Researchers will therefore become more interested in this field. The extensive availability of educational datasets, particularly in online learning, has further sparked interest in this topic. Notwithstanding the fact that some EDM polls have been published, these surveys have a narrow focus and are primarily concerned with investigations into or models of potential predictors of student progress. In this article, the authors provide a full examination of EDM research on students' performance in standard classroom settings. Learning outcomes serve as predictors, as do the timing, intent, and methods employed to make the prediction. Yet, performance projection requires further thought before the course even begins.
Fong, S. et al. [19] found that deciding to apply to a university involves more than just comparing test results and admission requirements. Student experience and other factors have been linked to achievement in higher education, according to previous studies. The correct high school students are difficult to match with suitable universities and career pathways in education systems that do not offer standard, open college admissions tests. This indicates that a manual process is necessary and that the choice is dependent on human judgement. As a result, errors must happen. An experimental recommendation system named the RGAU system was implemented in this research using a hybrid data mining technique (University Admissions Recommender System). examining several high school student data sources to estimate the probability that they will attend college. Gives high school officials, instructors, and students assistance in making decisions about college recommendations.
Francis, B. K. et al. [20] used data mining, which offers a powerful method for various education-related sectors. Given the wealth of data available on students that may be used to identify important trends in their learning development, research in the field of education is expanding quickly. Nidhi et al. [21] different classification algorithms are used on a student's academic dataset, along with different ensemble learning methods, to make better predictions than a basic classification algorithm could make. Finally, a comparison is shown that shows how ensemble learning improves performance over basic classification. The Multilayer Perceptron Algorithm provides the greatest improvement, up to 15%. Soni, A. et al. [22] have concluded that the methods for measuring student performance using data mining are described in this article. An academic institution has a sizable database with information about students. These student databases are considered with additional factors like family background, household income, etc.
We will be able to target and improve students who may be underperforming thanks to this, which will also help us find promising children. Create a feature area considering the characteristics of the students' personal information, household assets, household income, and household expenditures. Because they only provide a subset of functions, the selection of potential or critical functions is essential.
3. Materials and Methods 3.1 Dataset Description
A dataset in data mining is a group of data that is used for design and prediction. It is a structured collection of information that is set up in a certain format, usually as a table or spreadsheet. Data in a dataset can come from a variety of sources, including databases, text files, web pages, sensor networks, and can be of many forms, such as numerical, categorical, or textual. In this study, a dataset consisting of 649 instances and 33 attributes was used. The dataset exhibits a multivariate nature in terms of its characteristics. The online link of the considered dataset for this study is given in reference number [23].
-
3.2 Exploratory Data Analysis
-
3.2.1 Correlation between features analysis:
Data mining cannot begin without first performing exploratory data analysis (EDA). It is the process of analysing and summarising the primary characteristics of a dataset in order to gain insights and understand the underlying patterns and relationships in the data. EDA's primary goal is to assist analysts in locating the data's most important features and variables and in identifying any potential abnormalities or outliers. This makes it easier for analysts to choose the statistical methods and machine learning algorithms that will analyse the most effectively. EDA employs a few tools, including statistical techniques like correlation analysis and regression analysis as well as visualization like histograms, box plots, scatter plots, and heat maps. These methods can assist analysts in finding patterns in the data, identifying connections between variables, and identifying any unique or unexpected patterns that would call for additional research. Overall, EDA is an essential step in the data mining process, as it helps analysts to gain a better understanding of the data and to identify the most relevant variables and features for further analysis.
A heatmap is a graphical representation that visualizes attribute values in a two-dimensional matrix and is typically used for datasets containing numeric variables. The values are depicted by colour according to a chosen colour palette. By combining class variables and attributes on the x and y axes, we can identify where the attribute values are strongest or weakest, allowing us to find typical features for each class. In data mining, heatmaps are particularly useful for visualizing correlation tables and identifying missing values in the data. They offer a more visual approach than traditional analytics reports, making it easier to analyse large amounts of data immediately. This accessibility is especially helpful for individuals who are not accustomed to analysing large datasets. Clustered heatmaps are like standard data tables, where each row is an observation and the column is the entity's value on each measured variable. The objective of this type of chart is to build associations between data points and their features. After clustering the datasets, we can use a heatmap of students grouped by clusters to assess indicators of high and low performance. Figure 1 shows the correlation between features in the student performance dataset.
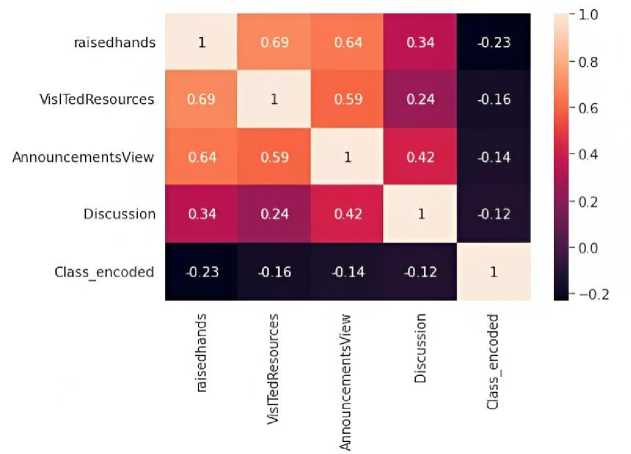
Fig. 1. Correlation between features analysis of the Student Performance Data Set.
Additionally, to better understand how students are progressing over the years, we can create a heatmap by sorting the students of a cohort according to their cluster results. The range of value between -1 to 1 is represented as follow:
-
• Negative value in the index (-1) is showing negative linear correlation between two different features of the dataset.
-
• A value of 0 indicates no linear correlation between two different features of the dataset.
-
• A value of 1 indicates a strong positive correlation.
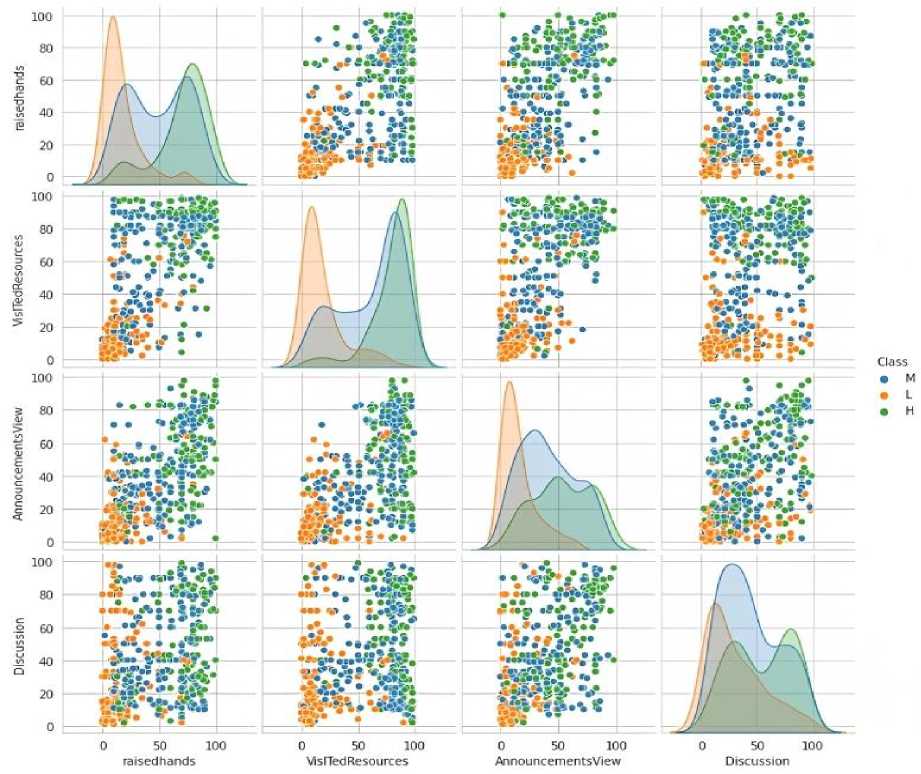
Fig. 2. Multiple pairwise bivariate distributions analysis of the Student Performance Data Set.
To better understand the performance of students over the years, we have been clustering the datasets and creating a chart to build associations between data points and their features based on some classifications. In the first row, the curve represents the differences observed between the students' classes by observing the changes in Figure 2. The comparison of the density of students who are raising their hands in different scenarios differentiating on lower, medium, and higher-class students, such as, when they are asked to raise their hands in the institutions, more density of lower-class students is observed in the starting analysis, but later it has changed and the density of higher-class students has become more. Firstly, it analyses the variations in participation of students in discussion by raising hands and all other factors. It is clearly observable that the high-class students are more active with a higher value at 100, and then come the low-class students, and the lowest are middle-class students with a value approaching 85 at its maximum. Furthermore, variations in discussion in visited resources are shown where low-class people are more involved in visited resources, whereas medium-class and high-class people show the same variation. In continuation to this graph, further shown in the analysis of announcement views in discussion, the medium-class students have the highest participation with the value at 100, but the lower-class students have not reached the peak; they are less involved in announcement views with the value approaching nearly 90, and the same variation is observable in high-class students. At the end, the graphical analysis of discussion shows that overall, the medium-class students are most involved in discussion, followed by the low-class students, and the lowest overall participation is done by high-class students.
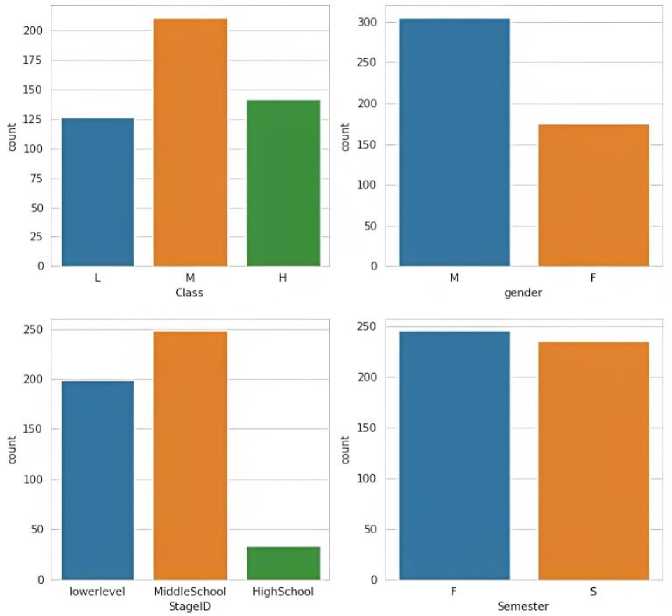
Fig. 3. Count of class, gender, staged and Semester in the Student Performance Data Set.
In Figure 3 class is showing that L is on 125, M is on 200 and H is in between 125 to 150 which shows that M holding the highest position among L and H. Gender is showing that M is on 300 and F is in between 150 to 200 which means M is holding the highest rank than F. Stage Id showing the lower level is on 200, middle school is on 250 and high school is in between 0 to 50 which means middle school is highest among the lower level and high school. Graph Semester is showing that F is less than 250 and S is in between 200 to 250.
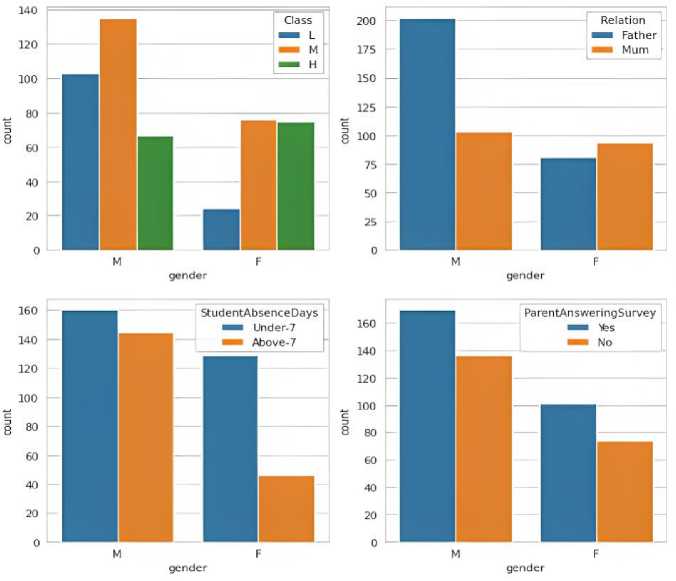
Fig. 4. Count of gender with respect to Class, Relation, StudentAbsenceDays and ParentAnsweringSurvey in the Student Performance Data Set
Figure 4 illustrates the number of students of different genders who come from different classes, as if they belong to a lower, medium, or higher class. There are more boys than girls in the lower and middle classes, indicating that a greater number of boys from lower- and middle-class backgrounds are joining institutions, according to the data set. This graph shows directly that the participation of female students of lower- and middle-class backgrounds is much lower, especially the girls from lower-class backgrounds; the number of male students is almost five times that of female students. On the other hand, as can be seen in the graph, there was a slight increase of 15.38% in female students from the upper class. Overall, this figure clearly shows that most lower-class women are less educated than upper-class women. Figure 4 shows the number of students by gender and their relationship status with their parents. Nowadays everyone is treated equally, but if you look at the family situation, male students prefer their father to their mother, while female students slightly prefer their mother. Thus, this graph shows that boys have a better relationship with their father than with their mother, and that girls have a slightly better relationship with their mother than with their father. Overall, the relationship between parents and sons is slightly better.
Figure 4 shows the absence of students under 7 and over 7 by gender. Blue bars represent students under 7 years old, and orange bars represent students over 7 years old. Basically, this graph shows that male students under the age of 7 have higher absenteeism rates than female students of the same age. The same changes were observed for students over 7 years old. But the overall analysis showed an almost 12.5% reduction in absenteeism among boys under 7 and over 7 years old. The absenteeism rate for female students under 7 years old and over 7 years old fell by nearly 69.23%. Figure 4 shows the results of a survey illustrating the number of "yes" or "no" answers given by their parents for the decisions made by their children. The graph shows that parents of male students answered "yes" or "no" to their children more often than female students. And the number of times that parents say "yes" to their children is higher among boys than among girls.
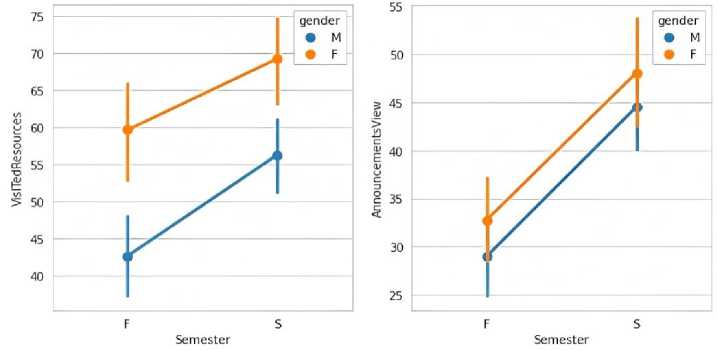
Fig. 5. Comparison of semester attribute w.r.t Visited Resources and Announcements View
Figure 5 provides a line graph that displays the total number of students, with blue representing male students and orange representing female students. The graph reveals that in the first semester, the number of female students visiting the resources was higher than that of male students. Furthermore, the graph also indicates an overall increase in the number of students visiting resources over time. Specifically, male students show a slightly greater increase compared to female students.
The line graph suggests that the number of female students visiting resources was higher than that of male students in the first semester. Moreover, both male and female students showed an increase in resource visits over time, with male students showing a slightly greater increase. The line graph depicts the total number of students, with the blue line representing male students and the orange line representing female students. Interestingly, the graph shows an equal increase in the number of male and female students who checked announcements during both the first and second semesters.
3.3 Data Mining Algorithm
3.3.1 Logistic Regression Algorithm:
3.3.2 Gaussian Naive Bayes Algorithm:
3.3.3 Support Vector Machine Algorithm:
3.3.4 Random Forest Algorithm:
3.3.5 K-Nearest Neighbor Algorithm:
3.3.6 XGBoost Algorithm:
4. Implementation Methodology
Logistic regression is one of the classification algorithms which used sigmoid function which mainly returns the probability of the label. Most of the classification problems comes under the category of binary that is it returns either true or false, positive, or negative etc.
Gaussian Naive Bayes is a popular classification algorithm in data mining and machine learning. It is a probabilistic algorithm that makes predictions based on Bayes' theorem, which describes the probability of an event based on prior knowledge of conditions that might be related to the event. Gaussian Naive Bayes is a simple and fast algorithm that works well with small to moderate sized datasets. It is commonly used in text classification and spam filtering, but it can be applied to a wide range of classification problems.
Support vector machine is one of the best ways which can be used in classification and regression. It comes under the category of Supervised Learning algorithm. It performs operation by constructing the divider which separates out data in two categories.
Random Forest Classifier is one of the classification algorithms which is the cluster of decision trees. It is commonly a type of ensemble methods which accumulates results from various predictors. It additionally uses the allows trees to be trained o random sampling of original dataset and then take out the majority votes from the included trees.
Due to its high forecast accuracy, the K-Nearest Neighbor algorithm competes with other cutting-edge algorithms. The K-Nearest Neighbor algorithm is useful when accuracy is needed, but a human-understandable model is not. Distance estimation affects forecast accuracy. It excels at a wide range of prediction-type tasks and is especially useful when labelled data is expensive or unavailable. K-Nearest Neighbor is a simple algorithm that can accurately learn an unknown function. The objective function's local minimum underpins this process.
XGBoost (Extreme Gradient Boosting) is a powerful algorithm used for classification problems in data mining. It is a gradient boosting implementation that may be applied to both classification and regression issues. XGBoost has gained popularity in recent years due to its high accuracy, speed, and ability to handle large datasets.
Students’ academic performance prediction is an important task for any institution to make informed decisions about student progress in education. Data mining algorithms can be used to predict student performance and identify factors that affect prediction accuracy. In this section, we will outline a detailed methodology for performance prediction using different data mining algorithms. Figure 6 shows the implementation methodology of the proposed work.
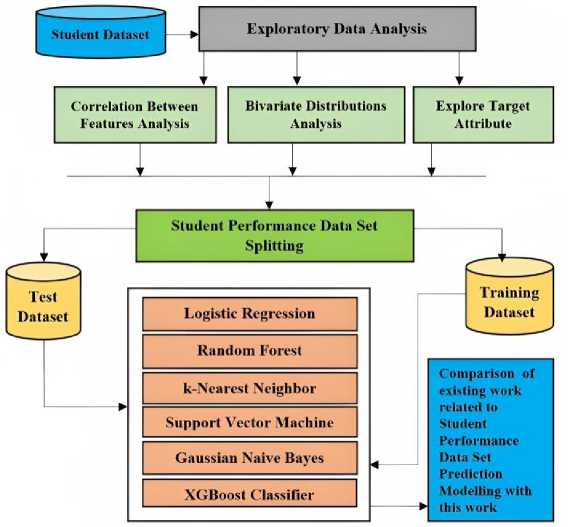
Fig. 6. Flow chart for Methodology for building predictive modelling for predicting student’s academic performance
Algorithm Selection: After figuring out which characteristics are the most important, the next step is to choose an algorithm for data mining. Several different algorithms, including Logistic Regression, Random Forest, Support Vector Machine, Naïve Bayes, K-nearest neighbour and XGBoost frequently utilised when attempting to forecast the academic achievement of students. The particulars of the problem at hand, as well as the information at hand, will serve as the deciding factor in deciding which algorithm to use.
Model Training: The data mining algorithm is then educated with the help of the data that has been pre-processed. The class variable serves as the output variable, and the algorithm is trained to recognise the relationship that exists between the input variables and the class variable in the dataset.
Model Tuning: Changing the model in different ways can make it work better. Changing the hyperparameters of the various algorithms is one way to accomplish this goal.
Model Evaluation: After the training phase is over, the model needs to be tested to see how well it can predict how well students will do in school. Testing the model on a different collection of data than the one it was trained on is part of this step.
Prediction: The trained model is utilised to make predictions regarding the academic achievement of students for the upcoming season. These predictions are made based on the input variables that influence the accuracy of the prediction.
-
4.2 Performance Metrics:
-
4.2.1 Accuracy:
Performance metrics are used to evaluate the effectiveness of machine learning models in predicting student outcomes and improving educational practices.
Accuracy measures the percentage of correct predictions made by the model on the total number of predictions. It is calculated as the ratio of the number of correct predictions to the total number of predictions. It provides an overall measure of the model's performance. The formula used for calculating accuracy is shown in (equation 1).
True Positive+ True Negative
Accuracy =
True Positive+ True Negitive+ False Positive+ False Negative
Table 1. displays the train accuracy and test accuracy of various data mining algorithms on a dataset. The algorithms included are Logistic Regression (train accuracy: 82.81%, test accuracy: 79.17%), Gaussian Naive Bayes (train accuracy: 51.04%, test accuracy: 42.71%), Support Vector Machine (train accuracy: 83.70%, test accuracy: 79.17%), Random Forest Classifier (train accuracy: 96.46%, test accuracy: 87.50%), K-Nearest Neighbor (train accuracy: 76.30%, test accuracy: 64.58%), and XGBoost (train accuracy: 95.05%, test accuracy: 84.38%). Among these, the Random Forest Classifier has the highest test accuracy of 87.50%, indicating it performs the best on the test set compared to the other algorithms.
Table 1. Train and testing accuracy by different Data Mining Algorithms
|
Data Mining Algorithms |
Train Accuracy |
Test Accuracy |
|
Logistic Regression |
82.81% |
79.17% |
|
Gaussian Naive Bayes |
51.04% |
42.71% |
|
Support Vector Machine |
83.70% |
79.17% |
|
Random Forest Classifier |
96.46% |
87.50% |
|
K-Nearest Neighbor |
76.30% |
64.58% |
|
XGBoost |
95.05% |
84.38% |
-
4.2.2 Confusion Matrix:
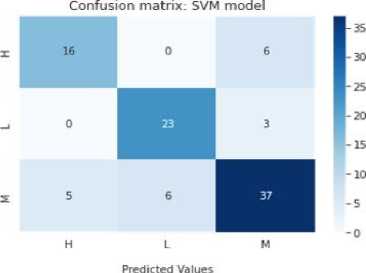
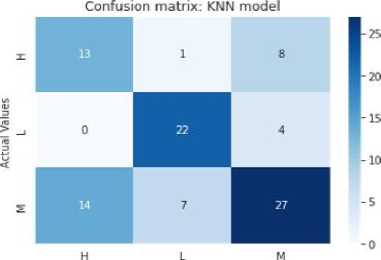
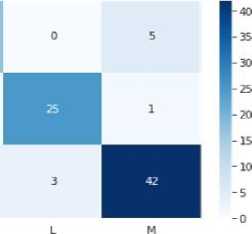
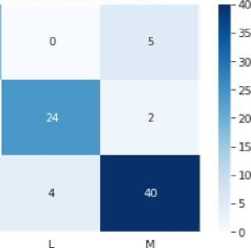
A confusion matrix is a table that summarizes the predictions made by the model and their correspondence to the actual labels in the dataset. It provides a detailed breakdown of the number of true positives, true negatives, false positives, and false negatives, and is useful in evaluating the performance of a model on different classes in a multiclass classification problem. The confusion matrix of all the implemented algorithm is shown in Figure 7.
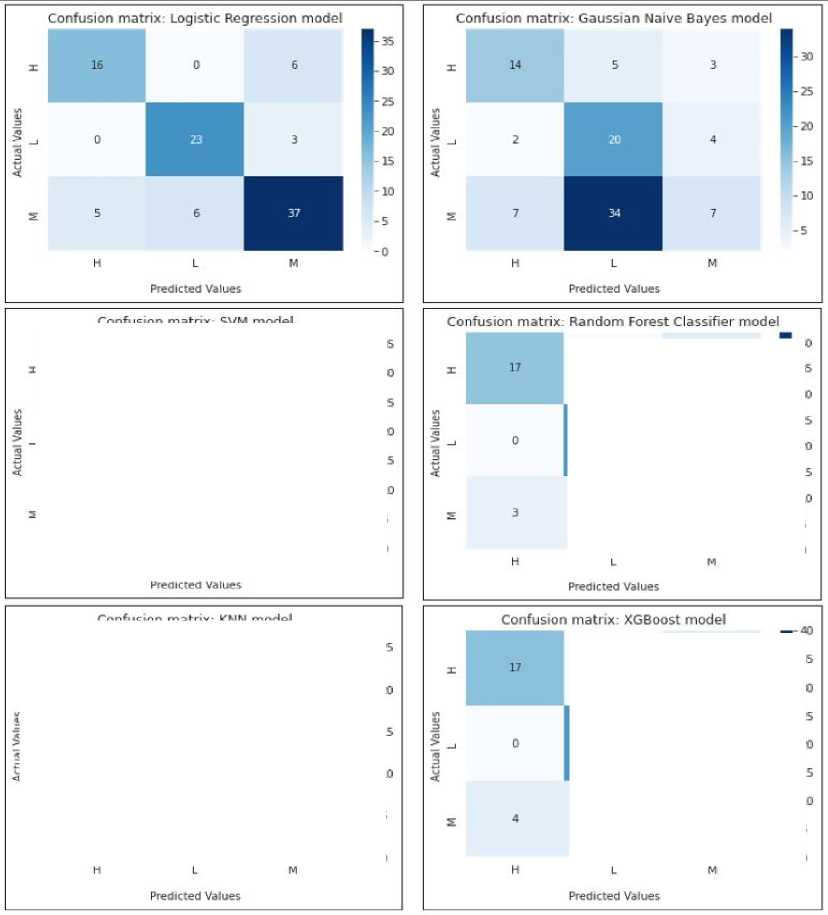
Fig. 7. Confusion Metrix of all the implemented data mining algorithms
-
4.2.3 Recall:
Recall measures the percentage of positive instances that are correctly identified by the model. It is calculated as the ratio of the number of true positives to the sum of true positives and false negatives. It is an important metric in cases where identifying all positive instances is crucial. The formula used for calculating recall value is shown in (equation 2).
Recall =
True Positive
True Positive+False Negative
-
4.2.4 Precision:
-
4.2.5 F1-score:
Precision measures the percentage of instances identified as positive that are positive. It is calculated as the ratio of the number of true positives to the sum of true positives and false positives. It is an important metric in cases where minimizing false positives is crucial. The formula used for calculating precision value is shown in (equation 3).
Precision =
True Positive
True Positive+False Positive
F1-score is the harmonic mean of precision and recall. It provides a balance between precision and recall and is a useful metric for evaluating models that need to optimize both precision and recall. The formula used for calculating F1-score value is shown in (equation 4).
Precision = 2 ∗
Precision ∗ Recall
Precision+ Recall
Table 2. Recall, Precision and F1-score value of Logistic Regression algorithm
|
Data Mining Algorithm |
Class Level |
Recall |
Precision |
F1-score |
|
Logistic Regression |
0 |
0.73 |
0.76 |
0.74 |
|
1 |
0.88 |
0.79 |
0.84 |
|
|
2 |
0.77 |
0.80 |
0.79 |
Table 2. represents the analysis of machine level algorithm where the table is based on logistic regression and the table consists of four parameters: class level, recall, precision, and F1-score. Comparing the class levels, Class Level 2 have the highest F1-score (0.79) and precision (0.80) whereas Class Level 1 have the highest recall (0.88). F1-score is gradually increasing from Class Level 0 up to Class Level 1 that is (0.74 to 0.79). Moreover, the same gradual increase is observable in precision (0.76 to 0.80), but the recall shows different changes, from class level 0 to class level 1, value increases (0.73 to 0.88) but in class level 2, value again decreases (0.77).
Table 3. Recall, Precision and F1-score value of Gaussion Naïve Bayes algorithm
|
Data Mining Algorithm |
Class Level |
Recall |
Precision |
F1-score |
|
Gaussian Naive Bayes |
0 |
0.64 |
0.61 |
0.62 |
|
1 |
0.77 |
0.34 |
0.47 |
|
|
2 |
0.15 |
0.50 |
0.23 |
Table 3. represents the analysis of machine algorithms where the table is based on Gaussian Naïve Bayes and the table consists of four parameters: - class level, recall, precision, and F1-score. Comparing the class levels, class level 0 has the highest F1-score (0.62) and precision (0.61) and class level 1 have the highest recall (0.77). F1-score is gradually decreasing from class level 0 up to class level 2 (0.62 to 0.23). Moreover, the same gradual decrease is observable in precision (0.61 to 0.50). Furthermore, recall shows different changes, from class level 0 to class level 1, value increases (0.64 to 0.77) but in class level 2, value shows huge decrement (0.15).
Table 4. Recall, Precision and F1-score value of Logistic Regression algorithm
|
Data Mining Algorithm |
Class Level |
Recall |
Precision |
F1-score |
|
Support Vector Machine |
0 |
0.73 |
0.76 |
0.74 |
|
1 |
0.88 |
0.79 |
0.84 |
|
|
2 |
0.77 |
0.80 |
0.79 |
Table 4. represents the performance metrics of the Support Vector Machine algorithm on a multi-class classification problem with three classes denoted as Class Level 0, 1, and 2. when class level is on 0 than recall will be at 0.73, precision will be at 0.76 and F1-score will be at 0.74. when class level is on 1 than recall will be at 0.88, precision will be at 0.79 and F1-score will be at 0.84. when class level is on 2 than recall will be at 0.77, precision will be at 0.80 and F1-score will be at 0.79.
Table 5. Recall, Precision and F1-score value of Random Forest algorithm
|
Data Mining Algorithm |
Class Level |
Recall |
Precision |
F1-score |
|
Random Forest |
0 |
0.77 |
0.85 |
0.81 |
|
1 |
0.96 |
0.89 |
0.93 |
|
|
2 |
0.88 |
0.88 |
0.88 |
Table 5. represents the performance metrics of the Random Forest classifier algorithm on a multi-class classification problem with three classes denoted as Class Level 0, 1, and 2. when class level is on 0 than recall will be at 0.77, precision will be at 0.85 and F1-score will be at 0.81. when class level is on 1 than recall will be at 0.96, precision will be at 0.89 and F1-score will be at 0.93. when class level is on 2 than recall will be at 0.88, precision will be at 0.88 and F1-score will be at 0.88.
Table 6. Recall, Precision and F1-score value of K-Nearest Neighbor algorithm
|
Data Mining Algorithm |
Class Level |
Recall |
Precision |
F1-score |
|
K-Nearest Neighbor |
0 |
0.59 |
0.48 |
0.53 |
|
1 |
0.85 |
0.73 |
0.79 |
|
|
2 |
0.56 |
0.69 |
0.62 |
Table 6. represents the performance metrics of the K-Nearest Neighbors (KNN) algorithm on a multi-class classification problem with three classes denoted as Class Level 0, 1, and 2. For class 0, the KNN algorithm achieved a recall of 0.59, meaning that it correctly identified 59% of the instances of class 0. It also achieved a precision of 0.48, meaning that 48% of the instances identified as class 0 were of that class. The F1-score for class 0 was 0.53. For class 1, the KNN algorithm achieved a higher recall of 0.85, meaning that it correctly identified 85% of the instances of class 1. It also achieved a precision of 0.73, meaning that 73% of the instances identified as class 1 were of that class. The F1-score for class 1 was 0.79. For class 2, the KNN algorithm achieved a recall of 0.56, meaning that it correctly identified 56% of the instances of class 2. It also achieved a precision of 0.69, meaning that 69% of the instances identified as class 2 were of that class. The F1-score for class 2 was 0.62.
Table 7. Recall, Precision and F1-score value of K-Nearest Neighbor algorithm
|
Data Mining Algorithm |
Class Level |
Recall |
Precision |
F1-score |
|
XGBoost |
0 |
0.77 |
0.81 |
0.79 |
|
1 |
0.92 |
0.86 |
0.89 |
|
|
2 |
0.83 |
0.85 |
0.84 |
Table 7. represents the evaluation metrics of the XGBoost machine learning algorithm on a multi-class classification problem for three different classes, denoted as Class Level 0, 1, and 2. Looking at the table, we can see that the XGBoost algorithm performed quite well across all three classes with F1-scores ranging from 0.79 to 0.89. The algorithm achieved the highest recall for Class Level 1 (92%) and the highest precision for Class Level 0 (81%). Class Level 2 had the lowest F1-score of 0.84, indicating that the algorithm had slightly more difficulty in correctly identifying instances in this class as shown in Figure 8.
Accuracy of Classification Models
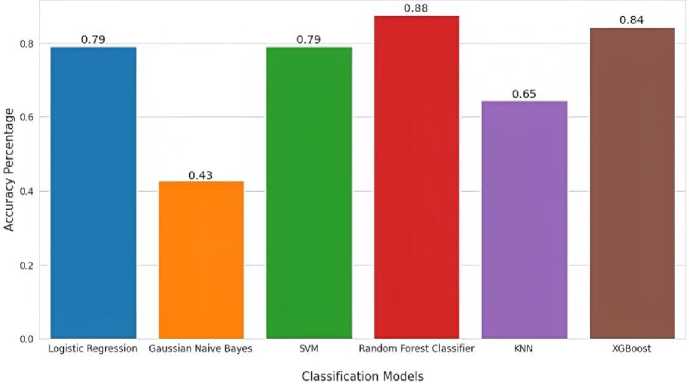
Fig. 8. Graphical representation of train accuracy by different implemented data mining algorithms
The classification algorithm in the data mining is the most used algorithm for analysing the dataset. Certainly, it is the most significant task that can be applied in different field of student’s data. It helps in organizing and sorting the small or simple dataset as well as complex and large data sets. It involves a lot of algorithms which can be used in improving the data quality.
5. Comparative Analysis
In this section, a comparative analysis of the present work with the literature is summarised. Adebayo, A. O., et al. [10] have researched the data mining techniques used in high schools and universities to look through the vast amounts of data and records to find patterns that may be used to forecast future events. The categorization technique is an important analytical tool for predicting the nature of an item based on the classes of items that are now available. In this study, we used the KNIME tool to conduct analysis based on classification algorithms to predict students' future performance. The teachers and students will be able to estimate their future performance using this technology based on their prior quiz results. To assess the compatibility of each categorization model and how it impacts algorithm performance, we will use more in-depth data on the students for the next tests, such as profiles and other curriculum activities.
Amazona, M. V. et al. [11] used three data mining models in this paper's analysis of the data sets to predict students' academic success in the classroom, which are the findings of an educational data mining technique. According to the findings, Deep Learning classifiers outperform the competing models by achieving an overall forecast accuracy of 95%, which has an impact on student success when forecasting their future academic performance. They could create a system to automatically explain all the attributes so that more research can be done on them. Institutions and faculty members can use this prediction to help them make the necessary adjustments. Table 8. shows the comparative analysis of different predictive classifiers over the years.
Table 8. Comparative analysis of different predictive classifiers
|
Ref. |
Authors / Year |
Classifier Models |
Accuracy |
|
[5] |
Meghji, A. F. et al./2023 |
Naïve Bayes, Decision Tree, random Forest, JRip, SMO, kStar |
84.87% (Naïve Bayes) |
|
[10] |
Adebayo, A. O. et al./2019 |
Decision Tree |
73.00% |
|
[11] |
Amazona, M. V. et al./2019 |
Naïve Bayes, Deep Learning, Decision Tree |
95.00% (Deep Learning) |
|
[12] |
Ashraf, M. et al./2020 |
Random Tree, Decision Tree, k-nearest Neighbor and Naïve Bayes, SMOTE, Spread subsampling |
95.50% (Naïve Bayes) 97.15% (Naïve Bayes-SMOTE) |
|
[13] |
Moreno-Marcos, P. M. et al./2020 |
Naïve Bayes, Support Vector Machine, K-Nearest Neighbor |
RMSE Value as parameter |
|
[14] |
Wakelam, E. et al./2020 |
Decision Tree, Naïve Bayes, Support Vector Machine, Neural Network, K-Nearest Neighbor, OneR, ADTree, Logistic Regression, Random Forest |
75.00% (K-Nearest Neighbor, Random Forest) |
|
[20] |
Francis, B. K. et al./2019 |
Naive Bayes, Decision Tree, Support Vector Machine, Neural Network |
75.47% (Decision Tree) (Academic + Behaviour + Extra features) |
|
[22] |
Soni, A. et al./2018 |
Decision Tree, Naïve Bayes, and Support Vector Machine |
83.33% (Support Vector Machine) |
|
Present implemented predictive model |
Logistic Regression, Naïve Bayes, K-nearest neighbor, XGBoost, Random Forest, Support Vector Machine |
Train-96.46%, Test-87.50% (Random Forest) |
|
Ashraf, M. et al. [12] did this analysis to determine if ensemble methods or filtering strategies significantly affected the learning classifiers' capacity to make accurate predictions of outcomes. There are many ensemble approaches, such as boosting mechanisms, that can be used to estimate student performance. Moreover, the analysis reduces these prediction processes to major classification features, and other ways have been reviewed for validation processes. The alternative method is the filtering strategy, which is used for the subsequent inspection because the output from the meta and base classifiers will differ. When compared to traditional classifiers, both the ensemble and filtering techniques improved significantly at predicting student achievement. This study's major objective was to identify if the ensemble approach or the filtering method significantly affected how well the learning classifier made predictions. As a result, we suggest the top prediction system for the pedagogical dataset based on the results.
Moreno-Marcos, P. M. et al. [13] examined several variables influencing MOOC grade predictions. Findings showed that variables related to activities were the best ones to identify, while variables from discussions were useless. Moreover, concept-oriented assignments had higher predictive value, and the best models typically only included the most recent exchanges. Aside from these results, there are a few restrictions that deserve to be mentioned. The first restriction relates to the method of student filtering. Second, we collected the data at the end of this week because early prediction was less important to us than the factors that influence prediction. Future research can examine more elements to determine whether they can affect prediction power. Wakelam, E. et al. [14] presented a multimodal analysis of task events and automatically identified nonverbal actions. One of the main challenges of adaptive learning environments, which attempt to boost motivation and learning, is identifying and responding to these moods. The technique presented in this work combines a collection of multimodal body language that is automatically extracted with task actions to forecast learning and affect in a data set of 63 human tutoring sessions that were computer-mediated. Automated monitoring of body language enables fine-grained studies of multimodal affective expressions. This line of research helps us better understand how learners behave emotionally and paves the way for affective interventions that successfully represent eye movements and task execution, much like a highly skilled human advisor would.
Khan, S. et al. [17] have used R software to predict using data mining techniques and machine learning algorithms. They built a regression model to test some features of the dataset that we thought affected student performance. They created a model based on an existing dataset that includes multiple parts and final grades. Higher education, absences, study time, parent work status, parent education level, and the number of previous failures were among the factors studied. According to the study, the only factors that can affect students' performance are study time and vacations. To improve student learning, teachers can take steps to improve student performance by having a strong understanding of how well or poorly the students in their classes will perform. This study focuses on the prediction algorithm's application to identify the key characteristics of a student's data.
6. Conclusion
Every educational institution in every part of the world has a big problem with how well their students do in school. Learning management systems are used by a lot of people, which means that a lot of data about how teaching and learning work together is being collected. This data contains information that has never been found before and could help students do much better in school. When the implemented algorithm was used to look at a set of student data, the results showed that there is a strong link between how learners act and how well they do in school. When applied to the academic, behavioural, and extra features of the student data set, Random Forest classifiers have been found to be more accurate than other algorithms. The accuracy of the training and testing predictive classification models is near 96.46% and 87.50%, respectively. Educators can use this model to better understand their students' wants and needs in order to improve the learning process, which in turn will reduce the number of students who drop out of school. There is a chance that in the not-too-distant future, the algorithm will be changed to include more characteristics from the student collection.
It is possible to add more variables to this exercise, which would lead to more accurate results that could be used to better tailor lessons. The tests can also be done with the help of other technologies, which makes for a more complete plan and more reliable results. A wide range of tools can be employed, and many factors can be considered. It can be hard for educational institutions to turn out graduates with the right level of knowledge. Many schools are not ready to meet the needs of their student populations because they do not have enough resources or good leaders. In order to manage their student populations and fulfil their requirements, educational institutions need to upgrade the assessment, analysis, and prediction tools at their disposal more effectively. The subject of analysing student performance sees a significant amount of research activity, but each individual study is conducted in a vacuum. Because of this, it should come as no surprise that a multi-pronged strategy is required. Students' personal and emotional steadiness, in addition to their academic qualities, is essential contributors to their overall success as students. As a result, existing components are analysed and classified with the help of appropriate data mining techniques in order to produce useful results. As a result, considering all the variables and components throughout the study can increase the prediction model's accuracy.
References Utilizing Random Forest and XGBoost Data Mining Algorithms for Anticipating Students’ Academic Performance
- Feng, G., Fan, M., & Chen, Y. (2022). Analysis and prediction of students’ academic performance based on educational data mining. IEEE Access, 10, 19558-19571.
- Rahman, M. M., Watanobe, Y., Matsumoto, T., Kiran, R. U., & Nakamura, K. (2022). Educational data mining to support programming learning using problem-solving data. IEEE Access, 10, 26186-26202.
- Batool, S., Rashid, J., Nisar, M. W., Kim, J., Kwon, H. Y., & Hussain, A. (2023). Educational data mining to predict students' academic performance: A survey study. Education and Information Technologies, 28(1), 905-971.
- Shafiq, D. A., Marjani, M., Habeeb, R. A. A., & Asirvatham, D. (2022). Student Retention Using Educational Data Mining and Predictive Analytics: A Systematic Literature Review. IEEE Access.
- Meghji, A. F., Mahoto, N. A., Asiri, Y., Alshahrani, H., Sulaiman, A., & Shaikh, A. (2023). Early detection of student degree-level academic performance using educational data mining. PeerJ Computer Science, 9, e1294.
- Ahuja, R., Jha, A., Maurya, R., & Srivastava, R. (2019). Analysis of educational data mining. In Harmony Search and Nature Inspired Optimization Algorithms: Theory and Applications, ICHSA 2018 (pp. 897-907). Springer Singapore.
- Silva, C., & Fonseca, J. (2017). Educational data mining: a literature review. Europe and MENA Cooperation advances in information and communication technologies, 87-94.
- Shahiri, A. M., & Husain, W. (2015). A review on predicting student's performance using data mining techniques. Procedia Computer Science, 72, 414-422.
- Amrieh, E. A., Hamtini, T., & Aljarah, I. (2016). Mining educational data to predict student’s academic performance using ensemble methods. International journal of database theory and application, 9(8), 119-136.
- Adebayo, A. O., & Chaubey, M. S. (2019). Data mining classification techniques on the analysis of student’s performance. GSJ, 7(4), 45-52.
- Amazona, M. V., & Hernandez, A. A. (2019). Modelling student performance using data mining techniques: Inputs for academic program development. In Proceedings of the 2019 5th International Conference on Computing and Data Engineering (pp. 36-40).
- Ashraf, M., Zaman, M., & Ahmed, M. (2020). An intelligent prediction system for educational data mining based on ensemble and filtering approaches. Procedia Computer Science, 167, 1471-1483.
- Moreno-Marcos, P. M., Pong, T. C., Munoz-Merino, P. J., & Kloos, C. D. (2020). Analysis of the factors influencing learners’ performance prediction with learning analytics. IEEE Access, 8, 5264-5282.
- Wakelam, E., Jefferies, A., Davey, N., & Sun, Y. (2020). The potential for student performance prediction in small cohorts with minimal available attributes. British Journal of Educational Technology, 51(2), 347-370.
- Ragab, A. H. M., Noaman, A. Y., Al-Ghamdi, A. S., & Madbouly, A. I. (2014). A comparative analysis of classification algorithms for students’ college enrollment approval using data mining. In Proceedings of the 2014 Workshop on Interaction Design in Educational Environments (pp. 106-113).
- Pandey, U. K., & Pal, S. (2011). Data Mining: A prediction of performer or underperformer using classification. arXiv preprint arXiv:1104.4163.
- Khan, S., & Alqahtani, S. (2020). Big Data Application and its Impact on Education. International Journal of Emerging Technologies in Learning (IJET), 15(17), pp. 36-46.
- Khan, A., & Ghosh, S. K. (2016). Analysing the impact of poor teaching on student performance. In 2016 IEEE international conference on teaching, assessment, and learning for engineering (TALE) (pp. 169-175). IEEE.
- Fong, S., & Biuk-Aghai, R. P. (2009). An automated university admission recommender system for secondary school students. In The 6th international conference on information technology and applications (p. 42).
- Francis, B. K., & Babu, S. S. (2019). Predicting academic performance of students using a hybrid data mining approach. Journal of medical systems, 43, 1-15.
- Nidhi, Kumar, M., Handa, D., & Agarwal, S. (2022, October). Student’s academic performance prediction by using ensemble techniques. In AIP Conference Proceedings (Vol. 2555, No. 1, p. 050004). AIP Publishing LLC.
- Soni, A., Kumar, V., Kaur, R., & Hemavathi, D. (2018). Predicting student performance using data mining techniques. International Journal of Pure and Applied Mathematics, 119(12), 221-227.
- Student Performance Data Set. Available online: https://archive.ics.uci.edu/ml/datasets/student+performance (accessed on 10 March 2023).
- Oyedotun, O. K., Tackie, S. N., Olaniyi, E. O., & Khashman, A. (2015). Data mining of students’ performance: Turkish students as a case study. International Journal of Intelligent Systems and Applications, 7(9), 20-27.
- Kumar, M., Mehta, G., Nayar, N., & Sharma, A. (2021). EMT: Ensemble meta-based tree model for predicting student performance in academics. In IOP Conference Series: Materials Science and Engineering (Vol. 1022, No. 1, p. 012062). IOP Publishing.
