Variant-Order Statistics based Model for Real-Time Plant Species Recognition

Author: Heba F. Eid, Ashraf Darwish
Journal: International Journal of Information Technology and Computer Science(IJITCS) @ijitcs
Article in issue: 9 Vol. 9, 2017.
Free access
There are an urgent need of categorizing plant by its species, to help botanist setting up a plant species database. However, plant recognition model is still very challenging task in computer vision and can be onerous and time consuming because of inefficient representation approaches. This paper, proposes a recognition model for classifying botanical species from leaf images, using combination of variant-order statistics based measures. Hence, the spatial coordinates values of gray pixels defines the qualities of texture, for the proposed model a gray-scale approach is adopted for analyzing the local patterns of leaves images using second and higher order statistical measures. While, first order statistical measures are used to extract color descriptors from leaves images. Evaluation of the proposed model shows the importance of combining variant-order statistics measures for enhancing the plant leaf recognition accuracy. Several experiments on Flavia dataset and swedish dataset are conducted. Experimental results indicates that; the proposed model yields to improve the recognition rate up to 97.1% and 94.7% for both Flavia and Swedish dataset respectively; while taking less execution time.
Plant Recognition, Leaf Descriptors Extraction, Gray Level Co-occurrence Matrix (GLCM), Gray Level Run Length Matrices (GLRLM), leaf classification
Short address: https://sciup.org/15012684
IDR: 15012684
Text of the scientific article Variant-Order Statistics based Model for Real-Time Plant Species Recognition
Published Online September 2017 in MECS
Plants form an essential part of life on earth and play a major role in various areas; such as medical science and environmental science. A thorough studying and understanding of plants species is vital to increase agricultural productivity. A wide variety of plants have been named and recorded, according to statistics approximately 350,000 species of plants exist on earth.
In order to study the plant effectively, plant species recognition and classification are of great importance. However, different plant species share a very close relationship to human beings. Therefore, interest for visual classification methods of plant species have grown recently [1, 2, 3].
Various plant organs have been posed such as flowers, bark, fruits or leaves for species recognition [4, 5]. Due to leaf easiness to access, carry and process; plant species recognition based on leaves has been by far the most popular methods reported in the literature [6, 7, 8, 9, 10, 11].
However, difficulty of developing leaf plant recognition models arise because leaves taxonomic have very fine differences between various species, and large variability in leaves color and texture within the same species. Also, the computer aided plant recognition procedure is very time consuming. Thus, the key issue lies in extracting leaves descriptors; which have good ability to deal with irregular textures, colors and with high intra-class variability; while taking less execution time.
This motivates the design of automated leaf plant recognition model based on variant-order statistics measures. The main contribution of this paper fall in two fold: (1) the variant order- statistical approach; (2) implementation of classifying the plant species from the extracted color and texture descriptors of leaf digital image. The proposed model adopts the first order statistic measures to extract leaf color descriptors. While, second and higher order statistic measures are used to extract the textural descriptors from the digital images. Then, the combination of the extracted statistical descriptors is used for plant species recognition proposes.
The main advantage of the proposed model is its simplicity and that it considers the spatial relationship, and correlation between leaf image pixels. The effectiveness of the proposed plant recognition model is evaluated by conducting several experiments on both flavia dataset and Swedish dataset.
The rest of the paper is organized as follows: Section II gives the mathematical concepts of the variant order statistical measures. While, section III describes the different stages of the proposed variant-order statistics based plant recognition model. Section IV presents two leaf plant dataset; the Flavia and swedish dataset.
Experimentation and discussion occupy the remainder of the paper in Section V, where results of different case studies are reported and comparison of the proposed model with other models are listed in section A . Finally, conclusions are drawn out in section VI.
-
II. Variant-order Statistical Analysis
The mathematical concepts of the variant order statistical measures: first-order, second-order and higher-order statistics are discussed below.
-
A. First-order statistics
Statistics is the study of the interpretation and analysis of data. One of the main statistical methodologies used for data analysis is descriptive statistics. Descriptive statistics aims to summarize data from a distribution using different moments [12]. A variety of image moments are used in computer vision, especially for pattern-recognition applications [13, 14]. Color moments are measures that can be effectively used to distinguish images based on their color features. For which; information of color distribution of an image can be extracted using the low order moments. let P ij be the i-th color channel at the j-th image pixel. Then, four color moments can be defined [15]:
-
• First order moment (Mean):
Mean is the average color value located within a spatial window.
Р = 1^ (1)
-
• Second order moment (Standard Deviation):
The standard deviation is the square root of the variance of the color distribution. It is a measure of how the color values are spread out.
^ = J I zG^P (2)
-
• Third order moment (Skewness):
Skewness is a measure of the degree of the color asymmetry around the Mean.
с, 1№ tj - а 3
S ке w =---— (3)
Na3 v '
-
• Fourth order moment (Kurtosis):
Kurtosis is a measure of the color histogram sharpness. Thus, it reflects the peakedness of the color distribution in the image.
„ „ 1 ХСР tj - а)
Kurt = - 3 (4)
No-4 v '
First-order statistics measures are calculated directly from the original image values. Therefore, they do not mull over the relationships with neighborhood pixel.
-
B. Second-order statistics: Gray Level co-occurrence Matrix
The co-occurrence probabilities is a second-order statistical method; which is related to image brightness changes [16]. The co-occurrence probabilities matrix represents the joint probability density of each pair wise pixels which have different positions in the spatial window. Given a certain inter-pixel distance d and orientation θ the probability measure is defined as:
Pr to = {Cy|( d, e )} (5)
where Ci j is the co-occurrence probability between grey levels i and j; which is defined by:
I ",
P ij represents the number of occurrences of gray levels i and j within the window; and N is the quantized number of grey levels.
The normalized co-occurrence matrix is obtained by dividing each element of the square matrix by the total number of co-occurrence pairs in it. For which, the directions of adjacency can be defined to take place in the four directions: horizontal (0o), vertical (90o), right diagonal (45o) and left diagonal (135o) as shown in figure 1.
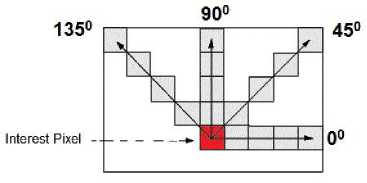
Fig.1. Co-occurance matrix orientations for texture descriptors extraction
Texture recognition of gray-level images can be achieved principally by modeling the texture as a twodimensional gray level variation. The resultant twodimensional array is called the Gray Level Co-occurance Matrix (GLCM). Thus, GLC matrix contains information about the positions of pixels which have similar gray level values.
By normalizing the GLCM, different second order statistic measures can be derived:
-
1) Contrast:
Contrast is the main diagonal near the moment of inertia. It measures the local variations presented in an image; reflecting the image clarity and texture of shadow depth.
=∑ ․( - ) (7)
-
2) Entropy:
Entropy is a measure of the randomness of the image texture. It is reflecting the intensity distribution of grayscale image.
= .log (8)
-
3) Angular second moment (Uniformity):
Angular second moment is a measure of homogeneity changing of a gray-scale image. It is reflecting the distribution of image gray-scale uniformity of weight and texture.
=∑ (9)
-
4) Inverse difference moment:
Inverse difference moment measures the local homogeneity of an image. It reflects local changes in image texture number.
=∑ (10)
( )
-
5) Correlation:
Correlation is a measure of the linear dependency of gray level values of neighboring pixels. It reflects the local gray-level dependency of the texture image.
=∑( )( ).
where µx, µy are the means of the rows and columns of the co-occurance matrix respectively; are defined as:
=∑ .(12)
And
=∑ .(13)
σ x , σ y are the standard deviations of the sum of the row and column of co-occurance matrix; are given by:
=∑( - ) .(14)
and
=∑( - ) .(15)
-
6) Dissimilarity:
Dissimilarity measures the variation of grey level pairs in the image.
=∑| - |.(16)
-
7) Sum of squares (Variance) :
Variance is a measurement of heterogeneity, for which it refers to the gray level variability of the pixel pairs. Variance has no spatial frequency and increases when the image gray-scale values differ from their means.
=∑( - ) . +∑( - ) . (17)
-
8) Cluster Shade:
Cluster shade is a measure of the skewness and uniformity of the GLC matrix. High cluster shade implies greater asymmetry of the image.
ℎ =∑( + - - ) . (18)
-
9) Cluster Prominence:
Cluster prominence also measures the skewness and asymmetry of the GLCM. High cluster prominence value indicates more asymmetry about the mean value; while low value indicates a peak in the GLCM matrix around the mean values.
=∑( + - - ) . (19)
-
C. Higher-order statistics: Gray Level Run Length Matrices
The grey-level run length method (GLRL) is based on the analysis of higher-order statistical measures [17]. The GLRL can also be used as image texture approach [18]. For which, it exemplify texture images based on run lengths of the image gray levels. GLRL matrix is a bi-dimensional matrix P , where each elements P(i, j/9) represents the numbers of runs with pixels of gray level i and run length j for a certain direction θ.
Three matrices represent the summation of distribution of the number of runs with a given run length j : Gray Level Run-Length Pixel Number Matrix (GLRLPNM), Gray-Level Run-Number Vector (GLRNV), and RunLength Run-Number Vector (RLRNV) [19]. Following theses matrices, a set of seven statistical measures were derived. For which, Galloway [17] introduced the first five original measures of run-length statistics; while, Chu et al [20] proposed the last two measures.
-
1) Short Run Emphasis:
SRE is a measure of the distribution of short run lengths; and is expected large for fine textural textures.
-
2) Long Run Emphasis:
LRE measures the distribution of long runs; and is expected large for coarse structural textures.
-
3) Gray-Level Non-uniformity:
GLN measures the similarity of gray-level intensity values throughout the image; where a lower value correlates with a greater gray level values alike throughout the image.
-
4) Run Percentage:
RP measures the homogeneity and the distribution of runs of an image for a certain direction.
-
5) Run Length Non-uniformity:
RLN measures the similarity of run lengths throughout the image. While, lower value indicates more homogeneity among run lengths in the image.
-
6) Low Gray-Level Run Emphasis:
LGRE measures the distribution of low gray level values. While, larger value indicating a higher concentration of low gray-level values in the image.
-
7) High Gray-Level Run Emphasis:
HGRE is a measure of the distribution of high gray level values. While, higher value indicating a greater concentration of high gray-level values in the image.
The mathematical formulas of the seven statistical GLRL measures are summarized in table 1:
Table 1. Measures and Formula of the Grey-Level Run Length.
|
Statistic measure |
Formula |
|
Short Run Emphasis |
SRE = -2(У ^У |
|
Long Run Emphasis |
LRE = ^t 1jP( GjW |
|
Gray-Level Non-uniformity |
GLNU = ±2(^Р( i J) 2 |
|
Run Percentage |
R p =4^ p G.n*J |
|
Run Length Non-uniformity |
RLNU = ^AZiP(i,D)2 |
|
Low Gray-Level Run Emphasis |
LGR E = ^УУг- |
|
High Gray-Level Run Emphasis |
HGRE = ^-2, ^.P(iJ-*!2 |
-
III. Proposed Variant-Order Statistics Model
The architecture of the proposed plant leaf recognition model using variant-order statistics measures is shown in Fig 2. For which, it combines both statistical color and textural descriptors for plant species recognition.
-
A. Color-based Descriptors Extraction
To generate the color descriptors vector; first the three color planes Red, Green and Blue are separated. Then, for each color plane the four first-order moments; mean, standard deviation, Skewness and Kurtosis; are derived. Finally, the averages of all color moments of the three color planes are calculated to form a color descriptors vector.
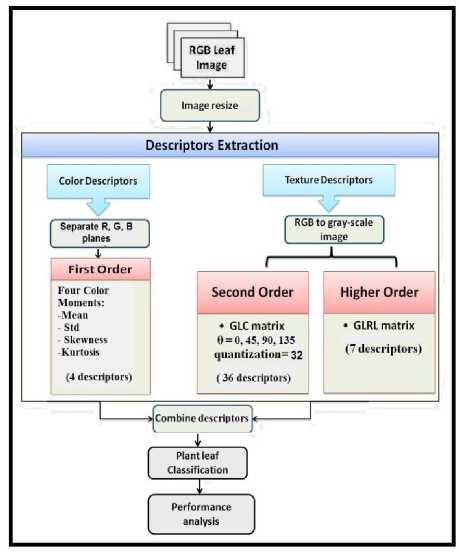
Fig.2. Proposed variant-order statistics based plant recognition model
-
B. Texture-based Descriptors Extraction
In the propose model to recognize a leaf image using its texture analysis, the spatial distribution of the grey pixel values are consider. For which, the RGB leaf images are converted to grey scale images; in order to capture the spatial dependence of gray-level values. Two statistical analysis methods are considered, to extract the leaf texture descriptors vector.
Second-order statistical texture analysis is used; where, descriptors of texture are extracted from the GLCM of gray scale image. The GLC method creates a symmetric matrix composed of the probability value based on the distance and the orientation amongst the grey image pixels. For the proposed model, the computation of the GLC matrix for four orientations (horizontal, vertical, and two diagonals) and one distance between neighbor pixels is established. Wherefore, the input leaf image is represented by four GLCMs. Having the GLCM normalized, nine second-order statistic texture descriptors are computed for each of the four GLC matrices. Which are: contrast, correlation, energy, entropy, homogeneity, Variance, dissimilarity, cluster prominence and cluster shade.
Extension to higher-order statistics measures is used for leaf texture descriptors extraction. For the propose model, the grey-level run length is used; where, GLRL method characterizes texture images based on the run lengths of image gray levels. First, GLRL matrix was generated for each leaf image at four directions (0o, 45o, 90o & 135o). Once the GLRLMs are calculated along each direction, seven texture statistical descriptors are calculated to capture the texture properties of the gray leaf image. These descriptors involves; SRE, LRE, GLN, RP, RLN, LGRE and HGRE.
-
C. Combine Descriptors
At this stage, a final descriptors vector characterizing color and texture of a leaf image is constructed. The descriptors vector is constructed based on the combination of the 4-dimensional color descriptors and the (36 GLC+7 GLRL) dimensional texture descriptors. For which, the final descriptors vector are provided as input for the plant species recognition stage.
-
D. Plant Species Recognition
For the species recognition purpose, a supervised learning method is used. Whereby, the combined descriptors vector is passed to the classifier; to identify the different plant species. The classifier learns from the combined input vectors, to get the desired outputs.
For a leaf class i consists of a set of N leaf images CN =1 1 , 1 2 ,..., 1N . Each class i is characterized by the collection of its descriptors values obtained during a training phase. A test image t is said to belong to a certain class i , if the probability of its descriptors values being maximum to the ith training class.
-
IV. Plant Leafs Datasets
For experimentation purpose; two challenging leaf datasets from different geographical areas were considered.
Flavia dataset: The Flavia dataset was collected by Wu et al. [21], it contains 1907 RGB scans images of leaf. It is composed of 32 species; where, each species has 40 to 60 sample leaves. For which; each image in the Flavia dataset have a white background and with no leafstalk. Samples of the flavia dataset images are given in Figure 3.
M##/* ♦ е#ем## t*x »#m /MW//H
Fig.3. Samples from the Flavia dataset.
Swedish dataset: The Swedish dataset contains 15 different scanned species images of leaves; with 75 images per species. The dataset was introduced by S¨oderkvist [22] for research purposes; where, some species are indistinguishable to the untrained eye. Figure 4, shows sample images of the dataset.
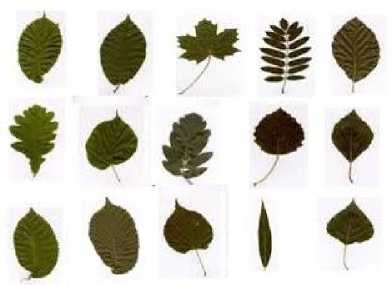
Fig.4. Samples from the Swedish dataset.
-
V. Experimentation Results and Discussion
To evaluate the proposed variant-order statistical plant recognition model, three performance measures are used: (1) Recall, (2) Precision and (3) Accuracy [23]. Mathematically, Recall and Precision are defined as:
Recall =
TP
TP + FN
Precision =
TP
TP + FP
Accuracy is the probability to correctly recognize classes. Thus, it is the proportion of true results, either true positive or true negative; and is computed by:
TP+TN
Accuracy = (22)
TP+TN+FP+FN where,
-
• True positives (TP) and True negatives (TN) refers to classifier correct prediction.
-
• False positives (FP) and False negatives (FN) correspond to the classifier incorrect prediction.
Case Study #1: Determination Of Grey Level Quantization
The effects of grey level quantization of the GLC matrix on the classification performance are studied. For which, it is possible to produce different descriptors space based on various grey level quantization values. Smaller values for quantization accelerate the calculation of the co-occurrence descriptors; however, this is offset by a reduction of textural information.
Four grey level quantization values are taken {8,16, 32,64} at orientation of θ = 0o. The j48 classifier accuracy for each quantization value is computed on flavia and Swedish datasets, as indicated in Table 2 and 3 respectively.
Table 2. Gray Level Quantization Analysis on Flavia Dataset And Orientation θ = 0o
|
Grey level Quantization |
Accuracy % |
|
8 |
90.8 |
|
16 |
92.6 |
|
32 |
93.4 |
|
64 |
92.9 |
Table 3. Gray Level Quantization Analysis on Swedish Dataset And Orientation θ = 0o
|
Grey level Quantization |
Accuracy % |
|
8 |
88.9 |
|
16 |
89.3 |
|
32 |
91.1 |
|
64 |
90.2 |
From Table 2 and 3, it has been demonstrated that 32 grey level quantization produces the preferred accuracy result; 93.4% for the flavia dataset and 91.1% for the Swedish dataset. Therefore; for the proposed model quantization value 32 is selected for computing the GLC descriptors vectors.
Case Study #2: Combine Color And Texture Based Modeling
In this study, three different classifiers; J48, Naive bays and Random forest [24]; was used to evaluate the efficiency of the combined extracted statistical descriptors. Performance of the three classifiers (J48, Naive bays and Random forest) are measured in term of 10-fold cross validation; using both Flavia and swedish dataset; as shown in fig 5.
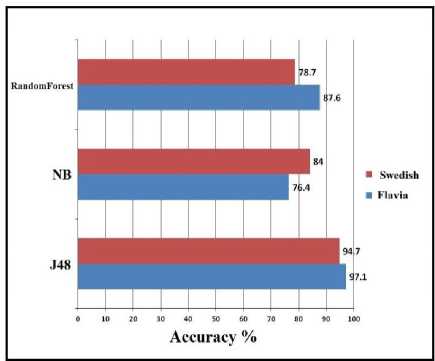
Fig.5. Performance analysis of the proposed extracted statistical descriptors.
Figure 5, illustrates that J48 classifier gives the best classification accuracy. Thus, it is selected to calculate the performance accuracy of the rest experiments of this study.
Recognition accuracy of plant species from digital leaves images using statistical color and textural descriptors are analyzed. For the color descriptors, first order descriptors were extracted by calculating the five color-moments. From the GLCM matrix, 36 second-order descriptors were extracted in four orientations 0o, 45o, 90o and 135o for gray levels quantization 32. GLRLM was used for generating 7 higher-order texture descriptor of leaf images.
Accuracy performance of the descriptors derived from the three methods; color moments, GLCM and GLRLM; are calculated individually using J48 classifier, as given in Table 4.
Table 4. Recognition Accuracy Analysis Of Different Statistics Descriptors.
|
Dataset |
Statistic descriptors |
Precision |
Recall |
Accuracy |
|
Color momets |
0.885% |
0.881% |
88.0% |
|
|
Flavia |
Texture-GLC Texture- |
0.962% |
0.962% |
96.1% |
|
GLRL |
0.935% |
0.935% |
93.4 % |
|
|
Color momets |
0.872 % |
0.867% |
86.6% |
|
|
Swedish |
Texture-GLC Texture- |
0.943% |
0.938% |
93.7% |
|
GLRL |
0.901 % |
0.898% |
89.7 % |
In order to evaluate the efficiency of combining the extracted statistical color, GLC and GLRL texture descriptors, all possible combinations are examined on both Flavia and swedish dataset, as shown in table 5 and table 6 respectively.
Table 5. Recognition Accuracy Analysis of Flavia Dataset Using Combined Order-Statistics Descriptors.
|
Combine Statistic descriptors |
Precision |
Recall |
Accuracy |
|
moments+GLC |
0.97% |
0.969% |
96.9% |
|
moments+GLRL |
0.943% |
0.942% |
94.2% |
|
GLC+GLRL |
0.967% |
0.965% |
96.5 % |
|
Proposed (moments+GLC+GLRL) |
0.972% |
0.971% |
97.1% |
Table 6. Recognition Accuracy Analysis of Swedish Dataset Using Combined Order-Statistics Descriptors.
|
Combine Statistic descriptors |
Precision |
Recall |
Accuracy |
|
moments+GLC |
0.953% |
0.951% |
95.1% |
|
moments+GLRL |
0.927% |
0.92% |
92.0% |
|
GLC+GLRL |
0.942% |
0.938% |
93.7 % |
|
Proposed (moments+GLC+GLRL) |
0.951% |
0.947% |
94.7% |
From table 5 and 6, it is observe that using the proposed combination of variant-order statistics descriptors gives the highest recognition accuracy of 97.1% for the Flavia dataset and 94.7% for the swedish dataset.
Case Study #3: Execution Time
The proposed variant-order statistics plant recognition model takes 0.5 seconds for J48 execution on the Flavia dataset; and takes only 0.2 seconds on the swedish dataset. Also, the proposed model takes 0.06 seconds and 0.03
seconds for Naive bays execution on Flavia and swedish dataset respectively. Finally; for the Random forest classifier the proposed model consumes 0.039 seconds on the Flavia dataset and 0.08 seconds on the swedish dataset. Therefore, the proposed model is promising for real time application.
-
A. Comparison with Other Systems
Researchers have used various methods for plant leaf recognition. Several leaf morphological features are considered for achieving greater recognition accuracies. To compare our proposed model with previous researches who have used Flavia dataset and swedish dataset; their accuracy results are listed in table 7 and table 8.
Table 7. Comparison Of The Proposed Leaf Recognition Model With Other models Based On The Flavia Dataset.
|
Methods |
Accuracy |
|
Gang Wu (2007)[21] |
90.0% |
|
Kadir (2011) [25] |
93.7% |
|
Kadir (2012) [26] |
93.44% |
|
Kulkarni (2013) [27] |
93.82% |
|
Aakif (2015) [28] |
96.0% |
|
proposed |
97.1% |
Table 8. Comparison Of The Proposed Leaf Recognition Model With Other Models Based On The Swedish Dataset.
|
Methods |
Accuracy |
|
Sderkvist (2001) [22] |
82.4% |
|
Ling (2007) [29] |
94.1% |
|
Sainin (2010) [30] |
92.6% |
|
Lei (2014)[31] |
94.2% |
|
proposed |
94.7% |
Based on table 7 and 8, the proposed model that combines variant-order statistical leaf descriptors of color and texture are certainly encouraging for plant species recognition.
-
VI. Conclusions
Base on the analysis of previous plant identification models, leaf descriptors extraction and classification became a major problem. This paper aims to improve the classification accuracy of plant species, by proposing a variant-order statistical model for plant recognition. The propose model takes into consideration statistical color descriptors and texture descriptors of plant leaves. The power of the proposed model lies through the use of variant order statistical descriptors, which take into consideration the spatial relationship, and correlation between leaf image pixels.
First order statistical measures are used to extract four color descriptors. Hence, leaf texture is characterized by both gray pixel coordinates and values. The gray level cooccurrence (GLC) and the grey-level run length (GLRL) are used to capture different image texture characteristics. 36 texture descriptors extracted from the GLC matrix for quantization levels 32 and different orientations 0, 45, 90 and 135o for unit distance. While, 7 texture descriptors extracted from the GLRL matrix for 0, 45, 90 and 135o orientations.
The proposed model has been tested using two challenging dataset: Flavia and swedish datasets. Several experiments are contacted for the extracted statistical descriptors from variant order measures: color moments, GLC and GLRL. For which classification accuracy is ranked by using each measure individually and in pairs. Results indicate that, using combinations of color and texture statistic descriptors assist in improving the recognition accuracy up to 97.1% and 94.7% for both Flavia and Swedish dataset respectively.
References Variant-Order Statistics based Model for Real-Time Plant Species Recognition
- G. Agarwal, P. Belhumeur, and S. Feiner, “First steps toward an electronic field guide for plants.” Taxon, vol. 55, no. 3, pp. 597–610, 2006.
- P. N. Belhumeur, D. Chen, and S. Feiner, “Searching the world’s herbaria:a system for visual identification of plant species,” In: Computer Vision, ECCV , Part IV, LNCS 5305, pp. 116–129, 2008.
- Z. Wang, H. Li, Y. Zhu, and T. Xu, “Review of plant identification based on image processing,” Archives of Computational Methods in Engineering, pp. 1–18, 2016.
- M. E. Nilsback and A. Zisserman, “An automatic visual flora: Segmentation and classification of flower images,” Ph.D. dissertation, Oxford University, 2009.
- S. Fiel and R. Sablatnig, “Automated identification of tree species from images of the bark, leaves and needles,” in Proc. In. 16th Computer Vision Winter Workshop, Mitterberg, Austria, 2011, pp. 1–6.
- X. F. Wang, D. S. Huang, J. X. Du, H. Xu, and L. Heutte, “Classification of plant leaf images with complicated background.” Applied Mathematics and Computation, vol. 205, no. 2, pp. 916–926, 2008.
- N. Valliammal and S. N. Geethalakshmi, “Analysi of the classification techniques for plant identification through leaf recognition,” Int. J. of Data Mining Knowledge Engineering, vol. 1, no. 5, pp. 239–243, 2009.
- M. Kumar, M. Kamble, S. Pawar, P. Patil, and N. Bonde, “Survey on techniques for plant leaf classification.” Int J. of Modern Engineering Research, vol. 1, no. 2, pp. 538–544, 2011.
- J. S. Cope, D. P. A. Corney, J. Y. Clark, P. Remagnino, and P. Wilkin, “Plant species identification using digital morphometrics: A review.’,” Expert Syst Appl, vol. 39, no. 8, pp. 7562–7573, 2012.
- T. Suk, J. Flusser, and P. Novotny, “Comparison of leaf recognition by moments and fourier descriptors,” Computer Analysis of Images and Patterns Lecture Notes in Computer Science, vol. 8047, pp. 221–228, 2013.
- H. F. Eid, “Performance improvement of plant identification model based on pso segmentation,” Int. J Intelligent Systems and Applications, vol. 8, pp. 53– 58, 2016.
- B. L. Chance and A. J. Rossman, Investigating Statistical Concepts, Applications, and Methods. Duxbury Press, 2005.
- J. Flusser and T. Suk, “Rotation moment invariants for recognition of symmetric objects,” IEEE Trans Image Proc, vol. 15, no. 12, pp. 3784–3790, 2006.
- F. Chaumette, “Image moments: A general and useful set of features for visual servoing,” IEEE Trans on robotic, vol. 20, no. 4, pp. 713–723, 2004.
- A. H. Kulkarni, H. M. Rai, K. A. Jahagirdar, and P. S. Upparamani, “Leaf recognition technique for plant classification using rbpnn and zernike moments.’, int,” J. of Advanced Research in Computer and Communication Engineering, vol. 2, no. 1, pp. 984–988, 2013.
- R. M. Haralick, K. Shanmugam, and D. I., “Textural features for image classification.” IEEE Trans. Syst.Man Cybern Smc, vol. Smc3, no. 6, pp. 610–621, 1973.
- M. M. Galloway, “Texture analysis using gray level run lengths,” Computer Graphics Image Processing, vol. 4, no. 2, pp. 172–179, 1975.
- F. Albregsten, Statistical texture measures computed from gray level run-length matrices. Department of Informatics, University of Oslo, Norway: Technical Note, 1995.
- M. Tuceryan and A. K. Jian, The Handbook of Pattern Recognition and Computer Vision, 2nd ed. World Scientific Publishing, 1998.
- A. Chu, C. M. A. Sehgal, and G. J. F., “Use of gray value distribution of run lengths for texture analysis,” Pattern Recognition Letters, vol. 11, no. 6, pp. 415– 419, 1990.
- E. Wu and F. X. Q. L. Wang, X.and Chang, “A leaf recognition algorithm for plant classification using probabilistic neural network,” in The 7th IEEE International Symposium on Signal Processing and Information Technology. Cairo, Egypt: IEEE, July 2007, pp. 1–7.
- O. Soderkvist, “Computer vision classification of leaves from swedish trees.” Master’s thesis, Linkping University, 2001.
- R. O. Duda, P. E. Hart, and D. G. Stork, Pattern Classification, 2nd ed. USA: JohnWiley & Sons, 2001.
- Y. kumar, G. Sahoo, “Study of Parametric Performance Evaluation of Machine Learning and Statistical Classifiers”. I.J. Information Technology and Computer Science, vol.5, no. 6 , pp. 57-64, 2013.
- A. Kadir, L. E. Nugroho, and P. Santosa, “Leaf classification using shape, color, and texture.” Int J. of Computer Trends & Technology, vol. 1, pp. 306–311, 2011.
- A. Kadir, “Experiments of zernike moments for leaf identification.” J. of Theoretical and Applied Information Technology, vol. 41, no. 1, pp. 82–93, 2012.
- A. H. Kulkarni, H. M. Rai, K. A. Jahagirdar, and P. S. Upparamani, “a leaf recognition technique for plant classification using rbpnn and zernike moments.’, int, J. of Advanced Research in Computer and Communication Engineering, vol. 2, no. 1, pp. 984–988, 2013.
- A. Aakif and M. F. Khan, “Automatic classification of plants based on their leaves,” Biosystems Engineering, vol. 139, pp. 66–75, 2015.
- H. Ling and D. W. Jacobs, “Shape classification using the inner-distance,” IEEE Trans Pattern Anal. Mach. Intell., vol. 9, no. 2, pp. 286–299, 2007.
- M. Sainin and R. Alfred, “Nearest neighbour distance matrix classification.” in Pro. In. 6th Conference on Advanced Data Mining and Applications: Part I. China, Springer-Verlag: Chongqing, 2010, pp. 114–124.
- Y. Lei, J. Zou, T. Dong, Z. You, Y. Yuan, and Y. Hu, “Orthogonal locally discriminant spline embedding for plant leaf recognition,” Computer Vision and Image Understanding, vol. 119, pp. 116–126, 2014.
