Ветровая нагрузка на здания и сооружения

Автор: Повзун Анастасия Олеговна, Бузун Никита Иванович, Зимин Сергей Сергеевич
Журнал: Строительство уникальных зданий и сооружений @unistroy
Статья в выпуске: 3 (30), 2015 года.
Бесплатный доступ
В данной статье рассматриваются общие вопросы определения и назначения нагрузок на здания и сооружения, и в частности ветрового воздействия. Изучены характер и природа ветровой нагрузки и методы ее определения. Статья анализирует несколько способов определения ветрового давления. Это расчет в соответствии с действующими нормами, испытания в аэродинамической трубе и математическое моделирование ветрового воздействия. Поднимается актуальная проблема возможности вычисления ветрового давления с помощью развивающихся в настоящее время методов компьютерного моделирования, а также верификации полученных результатов. Ставится задача дальнейшей разработки методики расчета с использованием компьютерной симуляции.
Ветровая нагрузка, нагрузки и воздействия, математическое моделирование, математическая модель ветрового потока, аэродинамические испытания, аэродинамические нагрузки
Короткий адрес: https://sciup.org/14322225
IDR: 14322225 | УДК: 69.07
Wind load on buildings and structures
In this article, the main aspects of determination of wind loads on buildings and constructions, and in particular, the wind action are considered. The character and nature of the wind load and calculation methods have been investigated. The article analyzes several ways of determination of wind effect. Calculation in accordance with prevailing regulations, wind tunnel tests and mathematical modeling of wind action are used in practical field. Therefore, the possibility of computational simulation of such loads and verifying of received results should be marked as an actual issue. The task of further develop of the method of wind effect calculation using computer simulation is formulated.
Текст научной статьи Ветровая нагрузка на здания и сооружения
journal homepage:
Loads and actions on the constructions are established in SP 20.13330.2011 “Loads and actions”, which is based on Russian Building Code (SNIP) 2.01.07-85 and suitable for the Russian base of standards. Thus, loads, actions, and their combinations should be calculated in accordance with the guidelines, but there is a lack of description for methods, properties and quality of the results in this case. It is caused by values, which are generated from tables by standard number of coefficients. As a result, weak knowledge about the determination and the control of such aspects is gotten. Furthermore, guidelines of different countries have divergent requirements [1]. This discordance is making some doubts about adequate using of any principles, moreover, there are mathematical (computational) ways to simulate such phenomenon, which could give different results in comparison with standards values.
As a consequence, the main purpose of the paper is to determine the reason of divergence and to make it understandable.
There are a number of monographs on wind loads on buildings and constructions [4 - 6, 12, 13], additionally on dynamic and aerodynamic calculations [8 - 11]. Although, a development of new determining methods of wind influence on constructions, computational simulation as well [14 - 22], makes a relevance to reopen the question about the actual design experience, and taking new methods into account as an alternative way to typical patterns, which are based on guidelines.
In this case, the aim could be shaped as a comparing of methods from different sources, and an understanding of special aspects of the relationship between a construction and wind loads. The clear understanding of such physical processes gives a possibility of values regulation of these actions, and, as a result, chance to use modified ways of loads design.
Loads from regulations and standards
The definition of a load is describing relationship between the construction and the surrounding. This interaction could have not only forcible nature, but it also could be kinematic, in case if the displacement or rotation of analytic model’s nodes is constant. Such influence is defined as restrictions, and it is well known, that all models have it. It should be appreciated that the estimation of restrictions and loads (concentrated, distributed, fluctuating and so on) is idealised process. Basically, loads and actions establish the less explored field, it is caused by high variability in space and time, but designed values are relative.
Previous research experience shows, that relative actions on buildings could be separated into internal and external from one side, and into forcible and kinematic from another. This classification is introduced in the table 1 [1].
Table 1. Classification of actions on constructions
|
Forcible interaction |
Kinematic interaction |
|
|
External |
Loads |
Assignable displacement of major nodes |
|
Internal |
Controlled preliminary tension |
Displacements, thermal deformation |
In accordance with the method of calculation of building structures by critical-load method, which lies as in the base of the Russian regulations [26], as in foreign ISO standards and systems Eurocode [29], introduced the concept of the normative (characteristic) and the design load. Deviations from the normative values associated with the static nature and variability of loads are carried by establishing of safety coefficient of the load γ f [26]. It gives the design load in case of multiplying by normative (characteristic) load. Therefore, the analysis of loads and actions is based on the theory of reliability, likewise, methods of static and dynamics of building structures [1, 7].
For further understanding of the issues, attention should be paid to the fact that the foreign interpretation “method of limiting states” is treated as a “method of partial coefficient”. This name comes from the calculations of building structures according to the principle the main safety coefficient is replaced by the number of several individual (private) coefficients, each of which is responsible for a particular characteristic of the system: material properties, operating conditions of the construction, the type of load, and so on. In accordance with “method of limiting states”, the limit state is considered only in the calculations, which are based on the design conditions, and a detailed analysis of all states of the system is not carried out. At the same time the concept of the "security" calculated values is introduced, which means, that there is a probability, that the actual load would be less than designed, and strength will have higher value [3]. The conversion of the single safety coefficient into differentiated is the main difference between this method and the previously used method of calculation for the allowable stresses. Thus, the foreign name of this principle is more trustful.
Depending on the duration all loads should be divided into constant and temporary types. At the same time temporary loads should be separated by term (long and short) and special [26]. The duration of long-term loads Td is equal with operation time Tef, short-term duration Td is much less than Tef [1].
Wind load refers to the temporary and has probabilistic environment. This means, that, as many other loads, the wind effect is random. To determine it by using the calculated values, which are obtained by statistical analyzing of measured data is realized only with a certain probability.
The features of the statistical characteristics of temporary loads are large variability, the time dependence and a variety of distribution laws applicable to them [2]. Furthermore, statistical processing is usually not subject to all of their values, only the maximum for typical terms. Therefore, due to the wide variety of temporary loads, as well as the lack of a uniform methodology for statistical processing of the experimental data, their study is an actual issue.
The determination of the wind loads is using data of meteorological stations on the results of long-term measurements of wind speed and direction at 10 m above the ground with 10-minute averaged periods. Primary meteorological information, which is developed on the basis of estimates for the construction of climatic parameters, is subject to a multi-level processing according to [28].
A wind velocities chart has approximate view, which is shown on the figure 1.
where
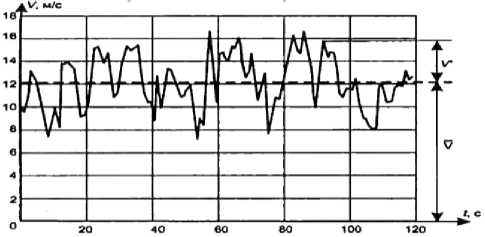
Figure 1. Wind velocities chart
Here, turbulent flow velocity at a given point in time v is represented as the sum of the averaged v and fluctuation v' velocities [1]:
v = v + v'
1 t +Д 1/2
V = — f vdt (2)
Д t t -Д t/2
Experimental studies CNIISK Kucherenko, showed that wind loads are subject to a double exponential rule of Gumbel distribution [2]:
F ( x ) = exp( - e -a( x - u ) )
The most probable value of the maximum load for a given time t is determined by the equation:
x ( t ) = u + — ln(t) (4) a
In the equation (4) it is the time at which prediction is carried out (operation time, as an example). The intensity of the temporary load for a given period is alleged, actually this value cannot be reached, but there is the probability of its occurrence.
Return period of given load is determined by equation:
t =-----------(—г
1 - exp( - e -a( x - u ) )
Quantile function F (x) is a value, which could not be exceeding by an assigned random value with a fixed probability, can be expressed by using the double taking the logarithm of this function:
x = — a
a • u - ln(ln
)
I F ( x ) J
Probability of exceeding of any value of x taken from the Gumbel distribution depends only on the time that the building is designed and defined by the formula:
Ф = 1 - exp(eh ( t ) ) (7)
Thus, the probability of exceedance of a set load value for the period of operation of the building is higher, in case of the higher return period load. Therefore, it is often accepted as settlement values corresponding to a very large return periods t. In consequence, calculating particularly high-performance structures, such as a nuclear power plant, appointed by the return period of load 10,000 years.
The standard value of wind load is assigned as a value exceeding an average of once every t years [1]. In SP 20.13330.2011 return period is accepted as t = 50 years. In the previous edition of the SNIP II-6-74 wind velocity was averaged over a 2-minute period, because of the basis of the valuation data of meteorological observations taken at vane measurements and return period had been set equal to 5 years [27].
In the transition to anemometer observations at meteorological stations averaging interval has been increased to 10 minutes, which reduced the value of the wind velocity averaged over a 2-minute intervals. Accordingly, characteristic values of wind pressure have been decreased. Table 2 shows the values of the velocity flow rates from SNIP II-6-74 and standard values of wind pressure from SNIP 2.01.07-85* (SP 20.13330.2011 [26]). Wind pressure is set for 7 climatic regions.
Table 2. Standard values of the flow velocity rate (standard values of wind pressure)
|
Wind region |
Ia |
I |
II |
III |
IV |
V |
VI |
VII |
|
w 0 , kPa (SNiP II-6-74) |
- |
0,27 |
0,35 |
0,45 |
0,55 |
0,70 |
0,85 |
1,00 |
|
w 0 , kPa (SNiP 2.01.07-85, SP 20.13330.2011) |
0,17 |
0,23 |
0,30 |
0,38 |
0,48 |
0,60 |
0,73 |
0,85 |
The calculated average value of the wind load is defined as the multiplication of the standard value and the safety coefficient for load γ f . Earlier, it was taken as 1.2 in SNIP II-6-74. In SNIP 2.01.07-85 calculated values of wind loads are stored the same as in the previous edition of SNIP II-6-74. For this coefficient γ f was increased to 1.4. Table 3 shows the calculated values of the average component of wind pressure w m at 10 m above the ground level (wind pressure). The top line - normative values SNIP II-6-74, multiplied by 1.2, at the bottom - the values on SNIP 2.01.07-85 (SP 20.13330.2011), multiplied by a safety coefficient of 1.4. In view of rounding errors on the calculated values of the old and new standards are almost equal.
Table 3. Calculated values of the flow velocity rate (calculated values of wind pressure)
|
Wind region |
Ia |
I |
II |
III |
IV |
V |
VI |
VII |
|
w m , kPa (SNiP II-6-74) |
- |
0,324 |
0,42 |
0,54 |
0,66 |
0,84 |
1,02 |
1,2 |
|
w m , kPa (SNiP 2.01.07-85, SP 20.13330.2011) |
0,238 |
0,322 |
0,42 |
0,532 |
0,672 |
0,84 |
1,022 |
1,19 |
Hence, the perception of increased reliability of the design under the current SNIP 2.01.07-85 (SP
20.13330.2011) in comparison with the previous version of the guideline (single period of excess increased in 10
times). In fact, there was a substitution of the calculated value of wind velocity, which is caused by changing of methods for the averaged component measurement (increasing of averaging interval in 5 times).
Nature of wind action
Wind as a natural phenomenon is the movement of the air masses caused by the pressures difference in the atmosphere. Any pressure drops between various points relate to the difference in the air temperature because of its uneven heating. Air currents flow from a high to a low-pressure zone.
Since wind is a stream of air masses, the motion obeys the law of Bernoulli [1]:
p v 2 / 2 + p0 = p v 2 /2 + P i (8)
where v 0 and v 1 – velocities at two different flow cross sections, p 0 and p 1 – pressures in the same sections, ρ – air density.
Represent the formula (8) as:
P i - P o = P v0/2 1 - ( vi/vo ) 2 (9)
The coefficient of proportionality between the excess pressure in the cross sections and the velocity head is called the aerodynamic coefficients:
C = 1 - ( v i /v o ) 2
It determines the amount of dynamic pressure, which converts into the wind pressure and is usually founded experimentally from tests in a wind tunnel [1]. In the other words, the aerodynamic coefficient is the ratio of excess static pressure in one point of the outer surface of the building to the wind dynamic pressure [24]. The value and the sign of the aerodynamic coefficients depend on the location of the point on the facade of the building, on the shape of the building, wind direction and speed, the presence of the neighboring buildings and structures, the terrain.
During the test in the wind tunnel the character of the flow stream and pressure values at characteristic points of a building are determined.
In [24] the process of aerodynamic tests of a model is described well.
Wind tunnel is an installation for reception of man-made uniform rectilinear flow. This stream is formed in the test section, where the investigated model is set. The model is set on the turntable; its orientation under the flow varies with a certain step.
The wind tunnel is an air duct with a driving force of air movement (axial or centrifugal fan, compressor and so on) and a device for creating a uniform flow. Distinguish straight-through and closed wind tunnels and tubes with closed and open working part.
An excessive static pressure or under pressure occurs on the surface of the building model under an airflow action. This pressure is measured by micro manometer coupled by the hose with a probe or a drainage tube, setting on surface of the model. The dynamic pressure of airflow is measured by Pitot tube in the initial section of the working pipe. The value of the aerodynamic coefficient is the ratio of excess static pressure to dynamic.
Hydraulic trays - flat and volumetric – are used to obtain a qualitative picture of the process of airflow of the building. Hydraulic flat tray is a small trough-shaped channel where inflow uniform rectilinear motion of water is organized. Model of building is placed at a vertical wall simulating the ground surface. The flow pattern in the hydraulic flow tray is dimensional (valid for infinitely long building with the normal direction of flow to the facade). Aluminum powder or small paper confetti is used as the indicators for monitoring flow around the structure. Photographing the process model flow with a known exposure, you can get not only the size of the vortex zones, but also the velocity vectors in parts of the stream (along the length of the trace left by confetti).
Volumetric hydraulic trays are applied to study the flow around buildings with finite dimensions in every direction of flow. Volumetric Hydraulic tray is a large extension channel of a rectangular cross section. The front of
Повзун А.О., Бузун Н.И., Зимин С.С. Ветровая нагрузка на здания и сооружения. /
Povzun A.O., Buzun N.I., Zimin S.S. Wind load on buildings and structures. © the tray which the influence of the boundary layer of wall slightly in is used to study the flow around the building. Model of building that installed on a flat base (simulating ground surface) is placed in the water flow immediately behind leveling bars.
It is comfortable to simulate a diffusion processes that determines dissipation ejected pollutants from the building in a volume tray. The paint (for example, a solution of the carcass) is an indicator. The indicator is supplied to the locations of the points of emission of harmful substances to model through capillary tubes.
To quantify use substances with densities close to the density of water as an indicator. It is possible to say about the size of the zone of aerodynamic trace, of air exchange in the region and other characteristics in accordance with the trajectories of separate droplets of indicator - marks recorded on film. The visibility of the process in the bulk hydraulic tray is the main advantage of this tray in front of the wind tunnel.
Thus, the results of measurements in the wind tunnel allow to perform the analysis of the building or structure framework to wind action.
Mathematical simulation
According to research [23], calculations of wind flows and impacts are reduced to the numerical solution of unsteady three-dimensional nonlinear equations of fluid dynamics staged by the Navier-Stokes:
|
d u d u d u d u |
d p |
d 2 u d 2 u d 2 u |
|
p--+ pu--+ pv--+ pw — = |
—- + p |
--T +--T +--T |
|
d t d x d y d z |
d x |
_d x2 d y2 d z2 _ |
|
d v d v d v d v |
d p |
d 2v d 2v d 2v |
|
|
—- + Ц |
T-? + ^-Г + ^-Г |
|
d t d x d y d z |
d y |
d x2 d y d z2 |
dw dw dw dw dp d 2w d 2w d 2w p— + pu--+ pv--+ pw— =---+ц —r +--r +--.
d t d x d y d z d z |_ d x2 d y d z2
In addition, the equation of continuity (conservation of mass) and state must be satisfied:
dp , d(P u ) , 5(p v ) + d(p w ) =() d t d x d y d z ' p = const
Here u, v, w - the required components of the velocity vector (along the axes x, y, z), p - pressure, t - time, μ - dynamic viscosity of air, ρ - density.
The simplification is introduced that wind flows are assumed incompressible and isothermal, mass forces are not considered.
A direct solution of these equations is practically realizable only for very small of flow rates and purely research tasks with the modern possibilities of computers. Therefore, in modern calculation practice the semi-empirical approach dominates. It is based on the decomposition of the rate on the averaged in time and the fluctuating components u i (t) = u i + u' i (t) and the transition to the solution of Navier-Stokes equations “averaged” by the Reynolds:
l( p u j ) + ^( p u i " u j ) = dtv 7 dx
d p d dx^ dx;
^=0, = 0 dx; dx;
where p - average pressure, indexes i = 1,2,3 and j = 1,2,3 correspond to the coordinates x, y, z.
In the stationary solution, the problem comes down to the iterative solution of the system of linear algebraic equations with nodal pressures, velocity components and measures of local turbulence as unknowns. The values averaged over time, the number of which for the considered objects / tasks can reach hundreds of millions are determined.
Unfortunately, the accuracy (or even practical convergence) of stationary calculations is not always satisfactory in situations with a strong vortex formation.
A practical approach to the solution of Navier-Stokes equations consists in that the decision is linked to the Reynolds number (Re), which defines the transition from laminar to turbulent flow. The Reynolds number is determined empirically for each type of the hydrodynamic problems (including tests of buildings models in a wind tunnel)
An important aspect of the solution of the Navier-Stokes equations is a discretization scheme. Processing power of modern computers reduce greatly the requirements for computational grid resources and computers. The dimensions of the computational domain around the building is recommended to limit by the area, which is equal to (at least) 10 heights of "dominant" setting in all directions.
The wind speed profiles corresponding to a specified wind regions and types of terrain [26] are used as the characteristics of the free-stream. The Neumann conditions - an equality to zero of derivatives - are used as the "outside" boundary conditions for the calculation domain. Characteristics of flow turbulence are defined through "sighting" calculations.
To account for the roughness of the walls "natural" modeling (taking into account in the model of the terrain, balconies and window openings, etc.) is recommended to use, although this is not always possible due to the limitations of the power of computer technology.
Method of estimating of peak design loads by averaging coefficients of security of kinetic (turbulent) fluctuations energy is applied because of extremely labor-intensive transient calculations and for minimizing their volume.
According to the experience of real structures calculations the medium pressures are reproduced with the practical accuracy (up to 5%). The kinetic energy of the pulsations in the stationary calculations is often underestimated that could be "compensated" by corresponding increase in the coefficient of security [23].
Aerodynamic loads
There is a need to design the construction considering the peak wind loads on the fences and sites of their fastening in the modern edition of Russian building codes SP 20.13330.2011. Wherein the values of aerodynamic coefficients of a positive pressure or suction, which appear in the equation for calculating the normative value of peak wind loads, should be determined by the results of model tests in the wind tunnel [26].
It is known that self-excited oscillations (self-oscillations) and aerodynamic instability may occur for some flexible structures in the Karman vortex separation from the surface of a bluff body [13, 25]. In according to SP 20.13330.2011 it is necessary to check high and flexible buildings (h/d>10) on a resonant vortex excitations. At the same time, it is recommended to clarify this impact in the model aerodynamic tests.
Conclusions
It should be remembered that the calculation of the wind load as some pressure value on a building or a structure is a supporting task of extensive structure analysis of the dynamic action. In accordance with SP 20.13330.2011, methods of calculation of a building or a structure on a wind effect suggest using of approximate calculation schemes of structures, simplified and generalized types of surrounding buildings and terrain.
Modern construction regulations raise the issue of an aerodynamic instability of buildings under wind effect very indirectly. Theoretical side of various types of this phenomenon can be found in [13]. To understand behavior of a complicated structure such as a high-rise building it is necessary to perform the model test in the wind tunnel especially if it has a non-standard form. There is a need to find alternative methods for dynamic analysis of buildings and structures to wind action due to high resource intensity and difficulty of realization these experiments. In recent years methods of computer simulation of wind effects are developing actively, sophisticated program complexes are creating. They allow setting accurately and close to real conditions the initial data affecting on the further calculation (shape of the building, terrain, nearby buildings, weather conditions, etc.) for obtaining the values of wind load, consistent with the results of aerodynamic testing. Therefore, the study and the modernization of such programs is an actual and important task of aerodynamics of buildings and structures.
Список литературы Ветровая нагрузка на здания и сооружения
- Гордееев В.Н., Лантук-Дященко А.И., Пашинский В.А., Перельмутер А.В., Пичугин С.Ф. Нагрузки и воздействия на здания и сооружения. M.: ASV, 2007. 482 с.
- Лычев А.С. Надежность строительных конструкций. M.: АСВ, 2008. 184 с.
- Райзер В.Д. Теория надежности в строительном проектировании. M.: АСВ, 1998. 304 с.
- Барштейн М.Ф. Динамический расчет высоких сооружений на действие ветра. Справочник по динамике сооружений. M.: Стройиздат, 1972. С. 286-321.
- Барштейн М.Ф. Руководство по расчету зданий и сооружений на действие ветра M.: Стройиздат,1978. 120 с.
- Беспрозванная И.М., Соколов А.Г., Фомин Г.М. Воздействие ветра на высокие сплошностенчатые сооружения M.: Стройиздат, 1976. 185 с. (rus)
- Болотин В.В. Методы теории ветроятностей и теории надежности в расчетах сооружений. M.: Стройиздат, 1982. 351 с.
- Коренев Б.Г., Рабинович И.М. Динамичесеий расчет зданий и сооружений. M.: Стройиздат, 1984. 303 с.
- Бронштейн М.Ф., Бородачев Н.М., Блюмина Л.К. Динамический расчет на специальные воздействия. M.: Стройиздат, 1981. 215 с.
- Реттер Е.И., Стриженов С.И. Аэродинамика зданий. M.: Стройиздат, 1968. 240 с.
- Реттер Е.И. Архитектурно-строительная аэродинамика. M.: Стройиздат. 1984. 296 с. (rus)
- Савицкий Г.А. Ветровая нагрузка на сооружения. M.: Стройиздат, 1972. с. (rus)
- Симиу Е., Сканлан Р. Воздействие ветра на здания и сооружения. M.: Стройиздат, 1984. 360 с. (rus)
- Дубинский С.И. Численное моделирование ветровых воздействий на высотные здания и комплексы. M.: 2010. 198 с. (rus)
- Bitsuamlak G.T., Stathopoulos T., Bedard C. Numerical evaluation of turbulent flows over complex terrains. A review//Journal of Aerospace Engineering, 17(4), 2004. Pp. 135-145.
- Blocken V., Stathopoulos T., Carmeliet J. CFD simulation of atmospheric boundary layer-wall function problems//Atmospheric Environment, 41 (2), 2007. Pp. 238-252.
- Liaw K.F. Simulation of Flow around Bluff Bodies and Bridge Deck Sections using CFD: thesis submits for the degree of PhD. University of Nottingham, 2005. 268 p.
- Ai Z.T., Mak C.M. CFD simulation of flow and dispersion around an isolated building: Effect of inhomogeneous ABL and near-wall treatment//Atmospheric Environment, 77 (10), 2013. Pp. 568-578.
- Kubilaya A., Deromea D., Blockenc B., Carmelieta J. CFD simulation and validation of wind-driven rain on a building facade with an Eulerian multiphase model//Building and Environment, 61 (3), 2013. Pp. 69-81.
- Blocken B., Janssena W.D., HooffaT. CFD simulation for pedestrian wind comfort and wind safety in urban areas: General decision framework and case study for the Eindhoven University campus//Environmental Modelling & Software, 30 (4), 2012. Pp. 15-34.
- Montazeri H., Blocken B. CFD simulation of wind-induced pressure coefficients on buildings with and without balconies: Validation and sensitivity analysis//Building and Environment, 60 (2), 2013. Pp. 137-149.
- Blocken B. 50 years of Computational Wind Engineering: Past, present and future//Journal of Wind Engineering and Industrial Aerodynamics, 129 (6), 2014. Pp. 69-102.
- Сутягин А.Е. Особенности определения расчетных параметров ветровой нагрузки на высотные здания. Высотное строительство. №05-06, 2012-2013. (rus)
- Богословский В.Я., Новожилов В.И., Симаков Б.Д., Титов В.П. Отопление и вентиляция. Часть 2: Вентиляция. M.: Стройиздат, 1976. 439 p. (rus)
- Бирбрайер А.Н. Динамика зданий и сооружений. Воздействие ветра на сооружения. СПб.: Изд-во СПбГПУ, 2008. 113 p. (rus)
- SP 20.13330.2011. Нагрузки и воздействия. Актуализированная редакция СНиП 2.01.07-85.
- СНиП II-6-74. Нагрузки и воздействия.
- Строительная климатология. Справочное пособие к СНиП 23-01-99. M.: НИИСФ РААСН. 2006.
- ENV 1990-1. Eurocode-1: Basis of Design and Action on Structures. Part 1: Basis of Design. Brussels: CEN, 1994. 106 p.
