Влияние внезапного стратосферного потепления в январе 2009 г. на распространение коротких радиоволн в экваториальной ионосфере

Автор: Котова Д.С., Клименко М.В., Клименко В.В., Захаров В.Е., Бессараб Ф.С., Кореньков Ю.Н.
Журнал: Солнечно-земная физика @solnechno-zemnaya-fizika
Статья в выпуске: 4 т.2, 2016 года.
Бесплатный доступ
Впервые рассмотрено влияние внезапного стратосферного потепления (ВСП) 23-27 января 2009 г. на распространение коротких радиоволн в экваториальной ионосфере. Выбранное нами событие происходило на фоне низкой солнечной и геомагнитной активности. Для моделирования изменения среды во время ВСП использовались результаты расчетов, полученные c помощью Глобальной самосогласованной модели термосферы, ионосферы и протоносферы (ГСМ ТИП). Удалось качественно и количественно воспроизвести возмущения полного электронного содержания, полученные по данным наземной сети приемников сигналов навигационных спутников GPS, посредством задания дополнительного электрического потенциала, а также выходных данных модели TIME-GCM на высоте 80 км. Для моделирования изменения лучевых траекторий и поглощения радиоволн использовалась численная модель распространения радиоволн, построенная в приближении геометрической оптики. Показано, что ВСП приводит к ухудшению радиосвязи в экваториальной ионосфере в дневное время.
Внезапное стратосферное потепление, кв-радиосвязь, поглощение радиосигнала, экваториальная аномалия, трехмерное моделирование
Короткий адрес: https://sciup.org/142103621
IDR: 142103621 | УДК: 550.510.535 | DOI: 10.12737/21880
Текст научной статьи Влияние внезапного стратосферного потепления в январе 2009 г. на распространение коротких радиоволн в экваториальной ионосфере
A sudden stratospheric warming (SSW) is a strong, sudden, abrupt increase in temperature, sometimes by 50 K and more, which lasts for a few days in the polar and sub-polar stratosphere in winter. SSW is a large-scale meteorological event associated with global anomalies occurring in the height range from the troposphere and stratosphere to the mesosphere and lower thermosphere. The influence of stratospheric warming events on distribution of meteorological parameters in the troposphere and atmospheric surface layer, and consequently on weather, has been experimentally and theoretically justified [Woollings et al., 2010; Kochetkova et al., 2014; Pogoreltsev et al., 2014]. There are a number of observations of the behavior of mesospheric and lower thermospheric parameters during SSW events, reported, for example, in [Mbatha et al., 2010], but such observations are rare.
The prolonged minimum of solar ( F 10.7 ~ 70) and geomagnetic ( K p < 3) activity in 2007–2009 allows us to examine interrelationships between processes in the middle and upper atmosphere because over that period changes in solar activity and magnetospheric sources had a minimal effect on the variability of upper atmospheric layers. In January 2009, there occurred a strong SSW event, which was unique in its long duration. For this event there are continuous measurements made at the global network of incoherent scatter radars for eleven days, as well as an extensive array of ionosonde observations. Ionospheric effects observed in Russian Asia during the SSW event in winter of 2008–2009 have been discussed in [Polyakova et al., 2014; Shpynev et al., 2015]. Global and mid-latitude ionospheric responses to this event have also been repeatedly studied [Yue et al., 2010; Pancheva and Mukhtarov, 2011; Bessarab et al., 2012; Fagundes et al., 2015]. However, most papers have dealt with the response of the low-latitude ionosphere to the 2009 SSW event [Chau et al., 2010; Goncharenko et al., 2010b] and tried to explain reasons for this response [Goncharenko et al., 2010a; Chau et al., 2011; Fejer et al., 2011; Pedatella et al., 2015; Yigit et al., 2015]. In order to assess the validity and importance of each of the proposed mechanisms of the observed morning enhancement of the equatorial ionization anomaly and the afternoon decrease in the electron density in the equatorial and low-latitude ionospheric regions during the 2009 SSW event, numerous scientific teams carried out theoretical research using global models of the middle and upper atmosphere, which represent the thermosphere–ionosphere system [Fuller-Rowell et al., 2010, 2011; Liu et al., 2010, 2013; Bessarab et al., 2012; Jin et al., 2012]. In all these studies, to greater or lesser degree, researchers qualitatively (not quantitatively) reproduced a low-latitude ionospheric response to the 2009 SSW event. The difference between theoretical and experimental data can be explained by the controversial choice of input model data and by the simplified description of some physical processes. In order to achieve quantitative agreement of calculation results with observations, some researchers assimilated observational data at various stages of modeling of parameters of the middle and upper atmosphere [Wang et al., 2014]. Nevertheless, despite the undeniable progress in modeling the ionospheric SSW effects, there are discrepancies between model results and observational data on the response of the low-latitude ionosphere to the 2009 SSW event [Klimenko et al., 2015; Peddatela et al., 2016]. That is partly why there are still no studies concerning the indirect effect of SSW events (through changes in ionospheric parameters) on HF radio wave propagation. Klimenko et al. [Klimenko et al., 2015] by introducing a source of an additional electric field in the equatorial region managed to qualitatively and quantitatively reproduce the response of the equatorial ionization anomaly to the 2009 SSW event. This allowed us to study, for the first time, changes in ray paths and radio wave absorption during the 2009 SSW event. The results of this study are discussed below.
STATEMENT OF THE PROBLEM
As a model for describing a three-dimensional inhomogeneous and anisotropic medium of HF radio wave propagation, we employ the global self-consistent model of the thermosphere, ionosphere and protonosphere (GSM TIP). This model involves numerical integration of a system of quasi-hydrodynamic equations for continuity, motion, and heat balance for the multicomponent gas mixture consisting of neutral (O 2 , N 2 , O, H) and charged (molecular O 2 +, NO+ and atomic O+, H+ ions, and electrons) particles. At given input parameters, the GSM TIP calculates global distributions of temperature T n , densities of O 2 , 82
N 2 , O, and vectors of the mean mass velocity of the neutral components of Earth’s upper atmosphere, densities, temperatures, and velocities of atomic (O+, H+) and molecular ions, as well as the twodimensional distribution of the electric potential of ionospheric and magnetospheric origin. It has a spatial grid of 5° in latitude and 15° in longitude in the geomagnetic spherical coordinate system with variable step in height. The GSM TIP is described in detail in [Namgaladze et al., 1990]. This model has been repeatedly used to study the ionospheric response to SSW events [Bessarab et al., 2012; Korenkov et al., 2012; Klimenko et al., 2013, 2015, 2016]. The global ionospheric response to the January 23–27, 2009 SSW event [Klimenko et al., 2015, 2016] was simulated using output data from the TIME-GCM model [Liu et al., 2010], such as pressure, temperature, density, zonal and meridional wind speeds at a height of 80 km, as lower boundary conditions in the GSM TIP. Besides, we set an additional electric potential so as to reproduce the zonal electric field at the geomagnetic equator, which causes the vertical electromagnetic plasma drift with velocities observed at the Jicamarca Observatory. The results obtained from the model calculations of total electron content (TEC) disturbances correlate qualitatively and quantitatively with observations (Figure 1). Maximum TEC disturbances over the American longitudinal sector are seen to be formed in the equatorial region at 15:00–17:00 UT. The maximum is in crests of the equatorial ionization anomaly (EIA), where the amplitude of TEC disturbances reaches ~ 4 TECU (1 TECU = 4 · 1012 cm–2). The agreement with the observational data provided grounds for choosing the GSM TIP to calculate the parameters of the medium of radio wave propagation during the 2009 SSW event. The results of model calculations for 15:00 UT in the EIA region were used to study the SSW effect on radio communication due to maximum TEC disturbances in this region during this period as compared to undisturbed one. As quiet day, we chose January 15, 2009.
This study relies on the previously developed consistent algorithm for numerical calculations of radio paths with the aid of models of medium and radio wave propagation (RWP). This algorithm is described in [Kotova et al., 2014, 2015], where it is exploited to examine the effect of geomagnetic storms on HF radio wave propagation. This algorithm interpolates ionospheric and thermospheric parameters at heights from 80 to 800 km in the 3D spatial grid of the GSM TIP into nodes of calculated ray paths in the numerical model of HF radio wave propagation. These thermospheric and ionospheric parameters are required to compute complex refractive indices for ordinary and extraordinary waves in the RWP model. The medium from Earth’s surface to 60 km is considered as homogeneous and unreflective; the medium parameters between 60 and 80 km are calculated using the empirical models of the ionosphere IRI [Bilitza, 2001] and neutral atmosphere MSIS [Hedin, 1991]. Solutions at a height of 80 km are joined to the solutions found with the GSM TIP. Expressions for complex refractive indices are derived from the dispersion relation for anisotropic ionospheric plasma obtained from the expression for the cold plasma dielectric permittivity tensor [Bryunelli, Namgaladze, 1988]. The medium throughout the height interval is considered weakly inhomogeneous, therefore, HF radio wave propagation can be described using the geometrical optics approximation. The 3D numerical RWP model and stages of its development are described in [Kotova et al., 2015]. In addition to the calculation of ray paths, integral and differential absorption, the model allows us to estimate changes in the angle between the ray vector s and the momentum vector p , which shows the development of inhomogeneity in a wave as it propagates into ionospheric layers at each point of calculated ray paths.
RESULTS
In order to choose the position of stations on Earth’s surface, directions and angles of transmission, we plotted maps of isolines of electron density N e of latitude-height cross-sections for three different longitudes both for quiet conditions and for the SSW period (Figure 2). Besides, for the same regions we drew maps of N e disturbances. It is apparent that the most significant N e disturbances occur at F-region heights. SSW is accompanied by an intensification of the equatorial ionization anomaly: N e decreases at the equator, the EIA crests shift from the equator, and N e increases in the EIA crests. As the EIA crests move to the east, this effect in the region of equatorial trough diminishes, and the symmetry of the EIA crests is destroyed (the southern crest is more pronounced than the northern one). There are virtually no model variations in N e below 200 km during SSW events, which is contrary to fact. That is why in calculations without specifying the source of additional electric field, the TEC effects were not reproduced.
The map of isolines of the F2-layer critical frequency disturbances during the warming event occurring in the equatorial region on January 25, 2009 at 15:00 UT shows positions of two hypothetical stations and direction of HF radio wave transmission (Figure 3). It is clearly seen that during the SSW event the critical frequency increases by 1 MHz in the EIA crests at geomagnetic latitudes of ±21°. This suggests that in these regions N e increases at the F2-layer peak height. Figure 3 also depicts a region of N e decrease at the geomagnetic equator and in its vicinity expanding during the SSW event up to the geomagnetic latitudes of ±15°, where negative changes in f o F 2 to –1 MHz are formed, while the critical frequency at the geomagnetic equator remains practically unchanged.
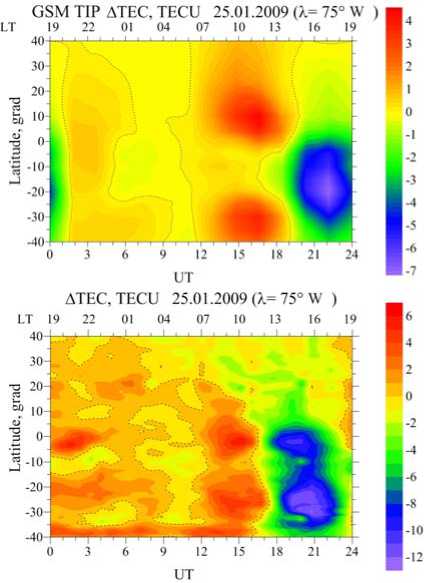
Figure 1 . TEC disturbances in the American longitudinal sector (75 ° W) during the day in the range of latitudes from –40° to 40° as inferred from calculations made with the GSM TIP ( a ) and from observations made by satellite navigation systems ( b )
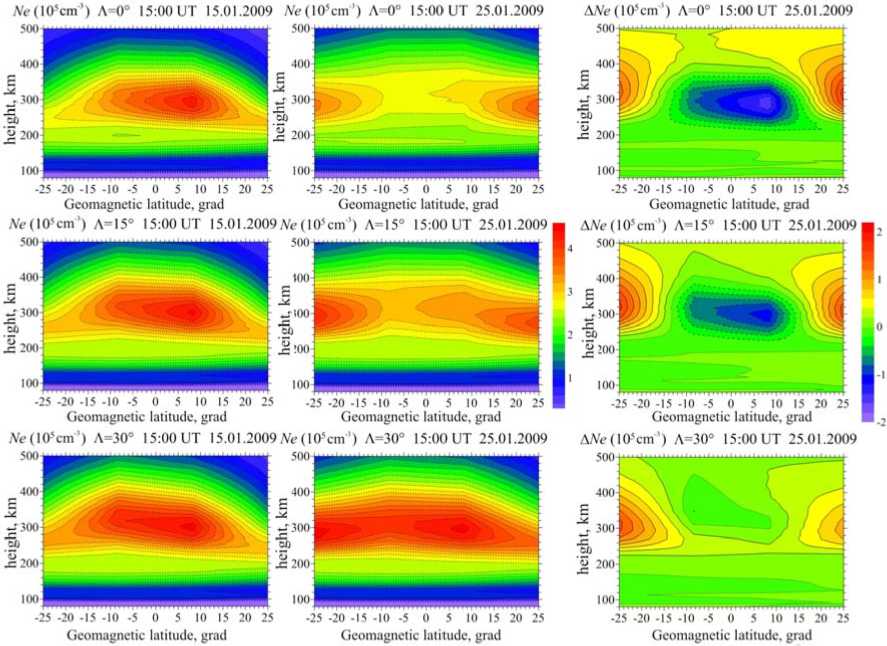
Figure 2 . Height-latitude cross-sections of electron density profiles at geomagnetic longitudes of 0° ( a – c ), 15° ( d – f ), and 30° ( h – j ) in the range of geomagnetic latitudes from –25° to 25°. The N e profiles are calculated by the GSM TIP for 15:00 UT on January 15 ( a , d , h ) and January 25 ( b , e , i ). N e disturbances on January 25 versus January 15 ( c , f , j )
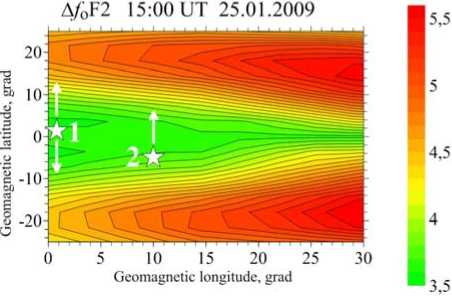
Figure 3. Map of isolines of the f o F2 disturbances in the Cartesian geomagnetic coordinate system “longitudelatitude” in the equatorial ionosphere during the January 25, 2009 SSW event, as compared to the quiet day of January 15, 2009 for 15:00 UT. HF radio wave propagation was calculated from hypothetical transmission stations (asterisks). Arrows indicate selected directions of HF radio wave propagation
The first station transmits a signal with different frequencies at different elevation angles α northward and southward (azimuth β=0° and 180°). Its coordinates are φ=10° S, λ=69° W, Φ=1.4°, Λ=0.8°, where φ, λ, Φ, and Λ are geographic and geomagnetic latitude and longitude respectively. The second station with coordinates φ=16.2° S, λ=59.4° W, Φ=–5°, Λ=10° transmits only northward. This choice stems from the fact that we are interested in the effect of displacement of EIA crests on RWP.
Figures 4 and 5 show the results of model calculations of changes in ray paths of HF radio waves for the first station, received for a set of frequencies and elevation angles α under quiet conditions, and their changes during the SSW event. The calculations were made for January 15 and 25 for the same frequencies and elevation angles. All the plots refer to single-hop paths of radio waves propagating in the ordinary mode. Figure 4 illustrates these paths in coordinates “geomagnetic latitude–height”; and Figure 5, in the geomagnetic coordinates “latitude-longitude”. This demonstrates the 3D character of the RWP.
Figure 4 shows that on January 25, the number of paths going into the ionosphere increases as compared to January 15. At the same time, these paths are refracted at F2-layer heights (~ 320 km). The radio wave propagation distance changes, and the height of reflection increases from 30 km for 6 MHz to 42.5 km for 8.5 MHz. It may be noted that the ray paths reflected below 180 km remain unchanged. This is likely not the case. What is the reason for this? We can try to explain this by the fact that, after setting an additional electric potential, in model calculations we reproduced the observed velocities of the electromagnetic drift at F-region heights, but not the effects of the electric field in the lower thermosphere and ionosphere due to the lack of consideration of the molecular ion transport. Finally, based on the current level of our knowledge about the formation of the ionospheric SSW effects and taking into account the insufficient number of available experimental data obtained at heights of the stratosphere, mesosphere, and lower thermosphere in general and during SSW events in particular, it is still impossible to say what changes in parameters of the neutral atmosphere at these heights cause such changes in thermospheric parameters at 80 km, by considering which as lower boundary conditions in the model of Earth’s upper atmosphere would allow us to adequately describe low-latitude ionospheric SSW effects at F-region heights.
Figure 5 illustrates the effect of the dynamics of EIA crests on the ray-path changes. Projections of ray paths on Earth’s surface are bent toward decreasing gradient of N e (to the west) as they approach boundaries of the EIA crests at geomagnetic latitudes Φ=±10°. It is apparent that during the SSW event radio wave paths deviate from the great-circle arc much more considerably than under quiet conditions. These deviations do not exceed 0.15° in longitude. Nevertheless, in the transition from angles in degrees to distances in kilometers, we obtain a deviation of ~17 km.
Let us consider some rays propagating northward (Figure 6) and southward (Figure 7) by representing them against the isolines of N e whose profiles were obtained along each ray path. Figure 6 depicts projections of the calculated paths of radio waves with a frequency of 8.5 MHz and an elevation angle α=30° in the geomagnetic latitude–height plane against N e for January 15 and 25. In these figures, dashed lines indicate changes in the integral attenuation in dB along the path. Figure 6, c illustrates the behavior of the differential attenuation (dashed lines) for two days of interest along ray paths, which are given for clarity. It is apparent that N e in the northern EIA crest during the SSW event decreases. The crest moves away from the equator. The F2-layer peak height rises by ~ 30 km. This provides a more visible manifestation of the F1 layer. So, if in quiet conditions we can see reflection at ~ 220 km, during the SSW event at 261 km. Both under quiet conditions and during the SSW event there occurs refraction in the F1 layer and reflection from the F2 layer. On January 25 as compared to January 15, the arrival point shifts by 4° in latitude on Earth’s surface. The analysis of the figures with signal attenuation shows that during the 86
warming event absorption slightly increases. So, at the same 8° geomagnetic longitude during the SSW event, the integral attenuation increases by 2% as compared to quiet conditions. Maximum values of differential attenuation (dB/km) on January 25 are 7% larger than those on January 15. The attenuation reaches maximum values in the lower ionospheric layers D and E. These regions are characterized by non-reflective absorption when the attenuation is large, while ray distortion is small [Bryunelli, Nam-galadze, 1988]. In the region of reflective absorption (near the turning point of ray path) the expected increase in differential attenuation is not observed. This is due to the fact that in both the cases, the radio wave propagates not in the region of the F2-layer peak height – it is reflected from the regions with lower N e .
For a 6 MHz radio wave propagating at 180° azimuth at an elevation angle of 45° (Figure 7), the differential attenuation also increases by 7 %. Due to the frequency decrease, a radio wave is more strongly absorbed, and the maximum integral attenuation is by 6 dB larger than that in Figure 6. If we now consider, as in the previous case, the attenuation at Φ=–3°, we again obtain an increase of about 4 % during the SSW event.
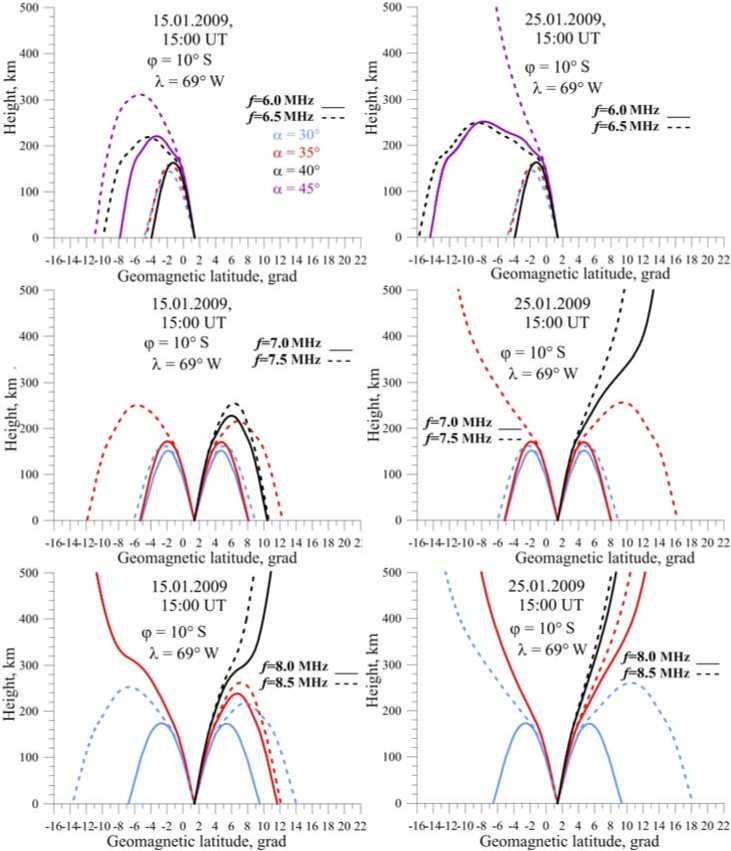
Figure 4. Ray structures of ordinary mode in the coordinates “geomagnetic latitude-height” obtained from the model calculations for January 15 (a, c, e) and January 25 (b, d, f) for radio wave propagation with different frequencies and elevation angles
Geomagnetic latitude, grad , , Geomagnetic latitude, grad , Geomagnetic latitude, grad
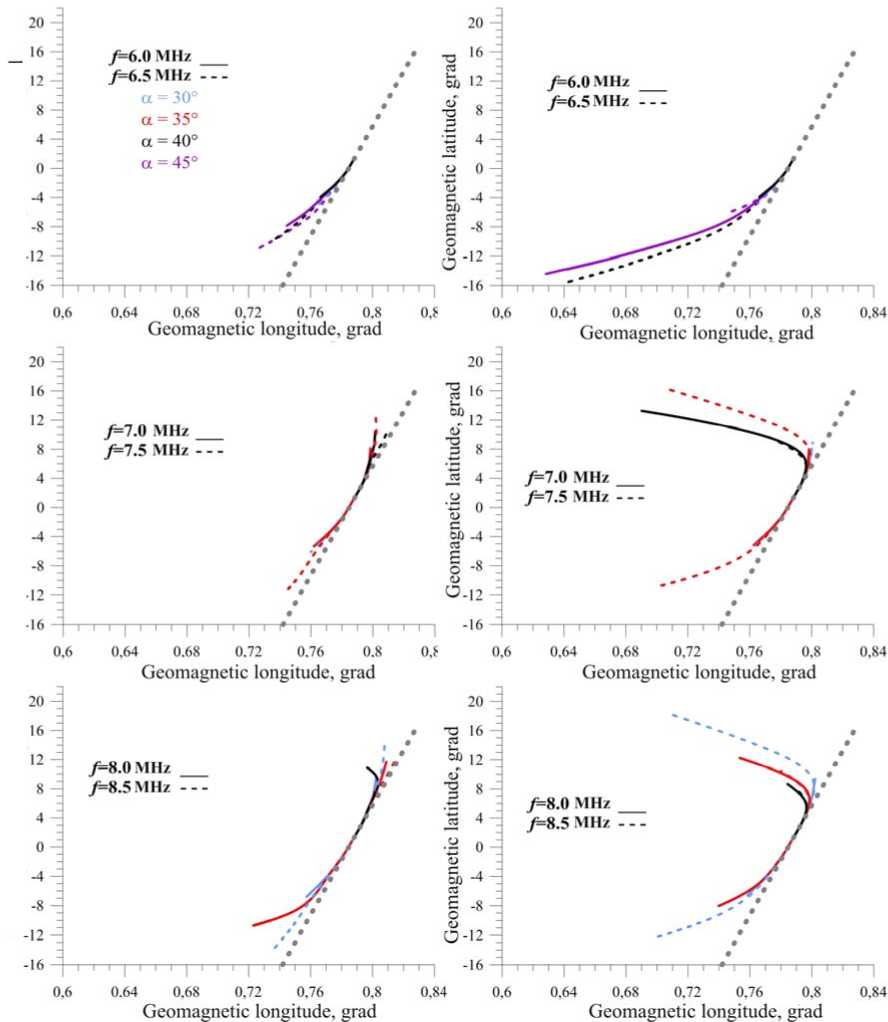
Figure 5 . The same as in Figure 4 in the geomagnetic coordinates “longitude-latitude”. Longitude-latitude deviation of ray paths from the great-circle arc (gray dashed lines) at given azimuths β=0° and β=180°
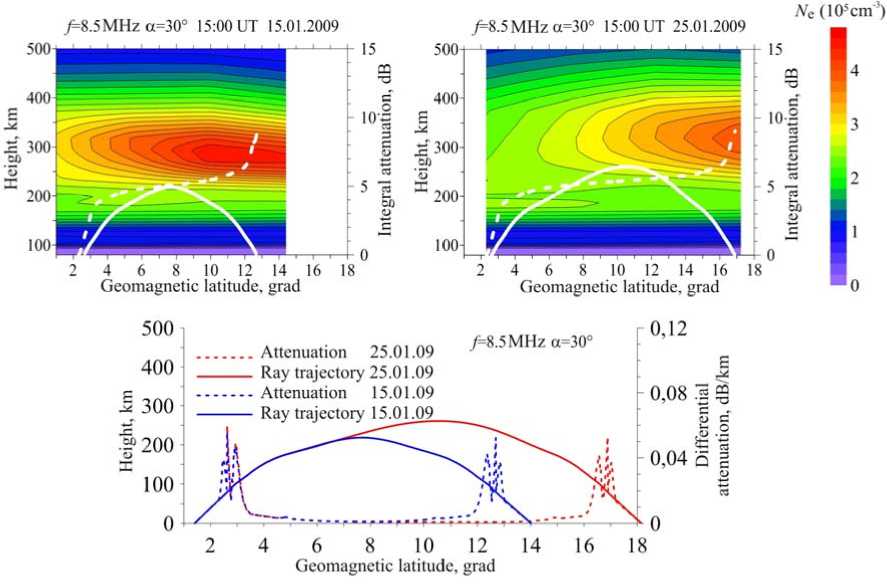
Figure 6 . Calculated ray paths (white solid lines) and integral attenuation (white dashed lines) of the radio wave with f =8.5 MHz and α=30° under quiet conditions on January 15 (top left panel) and during the SSW event on January 25 (top right panel). Isolines of N e are drawn along paths. The bottom panel shows the differential attenuation along each ray path
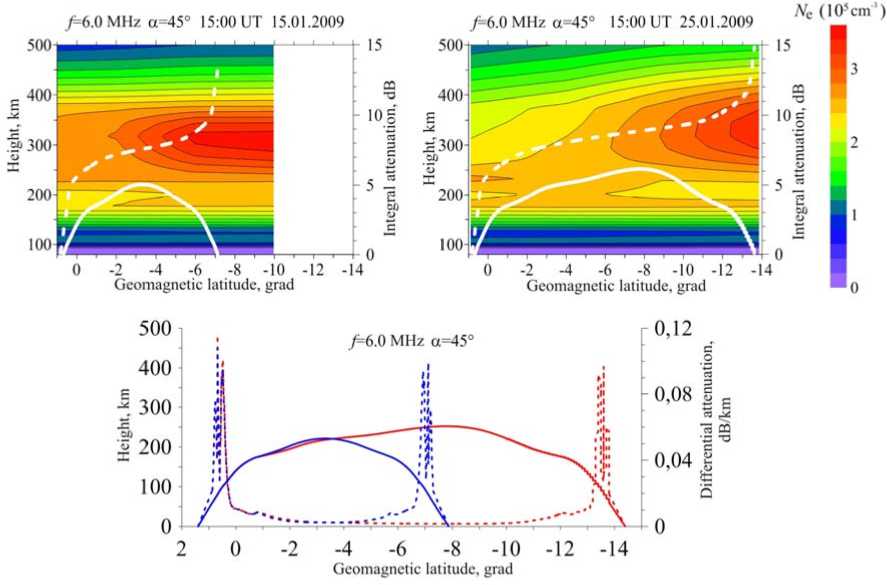
Figure 7 . The same as in Figure 6 for the radio wave with f =6 MHz and α=45°
The behavior of N e shows that during the SSW event the southern EIA crest shifts away from the equator, the F2-layer peak height rises by ~15 km, the F1 layer better manifests itself and more strongly affects radio wave propagation: refraction occurs at 170 and 210 km, and reflection at 250 km, which is ~30 km higher than that under quiet conditions. The refraction at 170 km has also an effect on the differential attenuation, where we can observe a slight increase in absorption (in this case, the plot for January 25 is higher than that for January 15). This suggests that the radio wave propagates at this height in the vicinity of the F1-layer peak height. We can note an increase in differential attenuation in the region of reflective absorption (it is different from zero).
Let us now consider the results obtained for the second hypothetical station. We will not consider them as thoroughly as for the first station because the same trends were obtained for the second station: during a warming event the number of ray paths arriving at Earth’s surface decreases, the operating frequency decreases, and the range of single-hop paths increases. Examine only one example for the frequency of 8.5 MHz and the elevation angle of 30° (Figure 8), similar to the results presented in Figures 6 and 7. Isolines of N e indicate the presence of two EIA crests, which shift from the equator during the warming event. The N e decrease at the equator deepens. This leads to the fact that the ray path of interest, which comes to Earth’s surface under quiet conditions, passes through the ionosphere during the SSW event, refracting on its way in the F1 and F2 layers, and, deviating from the EIA crest, goes upward. It is evident that in the vicinity of Φ=6° there is an increase in differential attenuation caused by propagation occurring in the region where N e is maximum for the path. Analyzing the plot, we can say that the maximum attenuation takes place in regions of non-reflective absorption. For this case, also during the SSW event, there is a slight (~ 3%) increase in absorption as compared to quiet conditions.
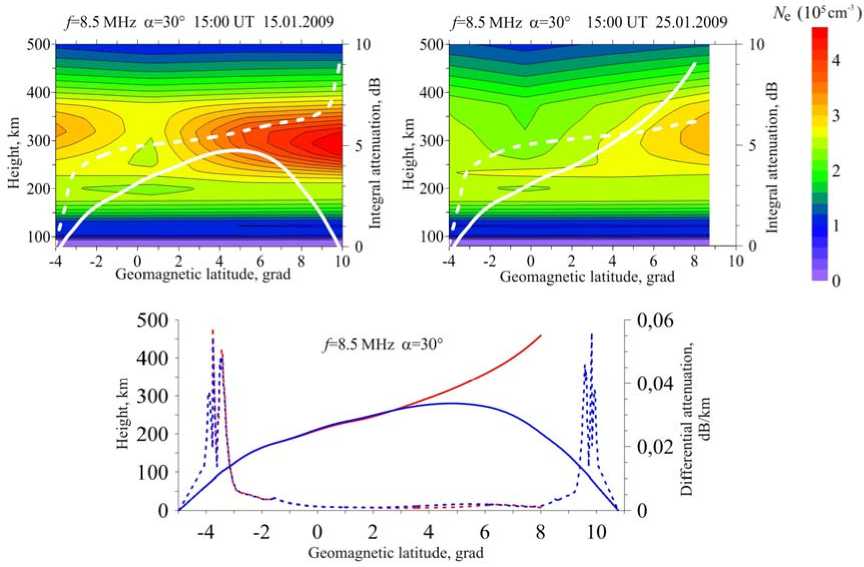
Figure 8. The same as in Figure 6 for the second station transmitting radio waves with f =8.5 MHz, α=30°, and β=0°
CONCLUSION
We have examined peculiarities of ray paths of HF radio wave propagation in the ionosphere during the January 23–27, 2009 SSW event. During this event, the electron density in the equatorial anomaly crests decreased, thus increasing the number of paths passing through the ionosphere and the length of one jump (by approximately 4° in latitude). We have shown that during the warming event, deviation of ray paths from the great-circle arc increased as compared to quiet conditions. The calculation results indicate that during the 2009 SSW event, the attenuation slightly increased by 5%, most likely due to changes in the composition of the neutral atmosphere during the warming event.
However, the question remains open about the correct modeling of the medium during the SSW event at heights below 180 km.
The study was supported by the Russian Foundation for Basic Research (RFBR), grant No. 14-0500578. The work was conducted under the project “Physical mechanisms of the formation of response of the upper atmosphere and ionosphere to processes in the lower atmosphere and on Earth’s surface” (state task of the Ministry of Education and Science of the Russian Federation, the competitive part, task No. 3.1127.2014/K).
Список литературы Влияние внезапного стратосферного потепления в январе 2009 г. на распространение коротких радиоволн в экваториальной ионосфере
- Брюнелли Б.Е., Намгаладзе А.А. Физика ионосферы. М.: Наука, 1988. 528 с.
- Клименко М.В., Клименко В.В., Кореньков Ю.Н. и др. Моделирование отклика системы термосфера-ионосфера на внезапные стратосферные потепления 2008 и 2009 гг.//Космич. исслед. 2013. Т. 51, № 1. С. 62-72.
- Клименко М.В., Клименко В.В., Бессараб Ф.С. и др. Использование моделей средней и верхней атмо-сферы для описания возмущений полного электронного содержания, вызванных стратосферным потеплением 2009 года//Химическая физика. 2016. Т. 35, № 1. С. 41-48.
- Котова Д.С., Клименко М.В., Клименко В.В., Захаров В.Е. Численное моделирование влияния гео-магнитной бури 2-3 мая 2010 г. на распространение коротких радиоволн в ионосфере//Изв. ВУЗов. Радиофизика. 2014. Т. LVII, № 7. С. 519-530.
- Котова Д.С., Захаров В.Е., Клименко М.В., Клименко В.В. Развитие модели распространения коротких радиоволн в ионосфере//Химическая физика. 2015. Т. 34, № 12. С. 62-71.
- Кочеткова О.С., Мордвинов В.И., Руднева М.А. Анализ факторов, влияющих на возникновение стра-тосферных потеплений//Оптика атмосферы и океана. 2014. № 8. С. 719-727.
- Намгаладзе А.А., Кореньков Ю.Н., Клименко В.В. и др. Глобальная численная модель термосферы, ионосферы и протоносферы Земли//Геомагнетизм и аэрономия. 1990. Т. 30, № 4. С. 612-619.
- Погорельцев А.И., Савенкова Е.Н., Перцев Н.Н. Внезапные стратосферные потепления: роль нор-мальных атмосферных мод//Геомагнетизм и аэрономия. 2014. Т. 54, № 3. С. 387-403.
- Bessarab F.S., Korenkov Yu.N., Klimenko M.V., et al. Modeling the effect of sudden stratospheric warming within the thermosphere-ionosphere system//J. Atmos. Solar-Terr. Phys. 2012. V. 90-91. P. 77-85.
- Bilitza D. International Reference Ionosphere 2000//Radio Sci. 2001. V. 36, N 2. P. 261-275.
- Chau J.L., Aponte N.A., Cabossa E. et al. Quiet time ionospheric variability over Arecibo during sudden stratospheric warming events//J. Geophys. Res. 2010. V. 115. A00G06 DOI: 10.1029/2010JA015378
- Chau J.L., Goncharenko L.P., Fejer B.G., Liu H.L. Equatorial and low latitude ionospheric effects during sudden stratospheric warming events//Space Sci. Rev. 2011. DOI: 10.1007/s11214-011-9797-5.
- Fagundes P.R., Goncharenko L.P., de Abreu A.J., et al. Ionospheric response to the 2009 sudden stratospheric warming over the equatorial, low, and middle latitudes in the South American sector//J. Geophys. Res.: Space Phys. 2015. V. 120. P. 7889-7902 DOI: 10.1002/2014JA020649
- Fejer B.G., Tracy B.D., Olson M.E., Chau J.L. Enhanced lunar semidiurnal equatorial vertical plasma drifts during sudden stratospheric warmings//Geophys. Res. Lett. 2011. V. 38. L21104 DOI: 10.1029/2011GL049788
- Fuller-Rowell T., Wang H., Akmaev R., et al. Forecasting the dynamic and electrodynamic response to the January 2009 sudden stratospheric warming//Geophys. Res. Lett. 2011. V. 38. L13102 DOI: 10.1029/2011GL047732
- Fuller-Rowell T., Wu F., Akmaev R., et al. A whole atmosphere model simulation of the impact of a sudden stratospheric warming on thermosphere dynamics and electrodynamics//J. Geophys. Res. 2010. V. 115. A00G08. DOI: 10.1029/2010JA015524.;
- Goncharenko L.P., Chau J.L., Liu H.-L., Coster A.J. Unexpected connection between the stratosphere and iono-sphere//Geophys. Res. Lett. 2010a. V. 37. L10101. DOI: 10.1029/2010GL043125.
- Goncharenko L.P., Coster A.J., Chau J.L., Vallandares C.E. Impact of sudden stratospheric warming on equatorial ionization anomaly//J. Geophys. Res. 2010b. V. 115. A00G07 DOI: 10.1029/2010JA015400
- Hedin A.E. Extension of the MSIS thermospheric model into the middle and lower atmosphere//J. Geophys. Res.: Space Phys. 1991. V. 96. A2. P. 1159-1172.
- Jin H., Miyoshi Y., Pancheva D., et al. Response of migrating tides to the stratospheric sudden warming in 2009 and their effects on the ionosphere studied by a whole atmosphere-ionosphere model GAIA with COSMIC and TIMED/SABER observations//J. Geophys. Res. 2012. V. 117. A10323 DOI: 10.1029/2012JA017650
- Klimenko M.V., Klimenko V.V., Bessarab F.S., et al. Study of the thermospheric and ionospheric response to the 2009 sudden stratospheric warming using TIME-GCM and GSM TIP models: First results//J. Geophys. Res. 2015. V. 120. N 9. P. 7873-7888 DOI: 10.1002/2014JA020861
- Korenkov Yu.N., Klimenko V.V., Klimenko M.V., et al. The global thermospheric and ionospheric response to the 2008 minor sudden stratospheric warming event//J. Geophys. Res. 2012. V. 117. A10309 DOI: 10.1029/2012JA018018
- Kotova D.S., Klimenko M.V., Klimenko V.V., et al. Using IRI and GSM TIP model results as environment for HF radio wave propagation model during the geomagnetic storm occurred on September 26-29, 2011//Adv. Space Res. 2015. V. 56. N 9. P. 2012-2029 DOI: 10.1016/j.asr.2015.05.009
- Liu H.-L., Wang W., Richmond A.D., Roble R.G. Ionospheric variability due to planetary waves and tides for solar minimum conditions//J. Geophys. Res. 2010. V. 115. A00G07 DOI: 10.1029/2009JA015188
- Liu H., Jin H., Miyoshi Y., Fujiwara H., Shinagawa H. Upper atmosphere response to stratosphere sudden warming: Local time and height dependence simulated by GAIA model//Geophys. Res. Lett. 2013. V. 40, P. 635-640. DOI:10.1002/grl.50146.
- Mbatha N., Sivakumar V., Malinga S.B., et al. Study on the impact of sudden stratosphere warming in the upper mesosphere -lower thermosphere regions using satellite and HF radar measurements//Atmos. Chem. Phys. 2010. V. 10. P. 3397-3404.
- Pancheva D., Mukhtarov P. Stratospheric warmings: The atmosphere-ionosphere coupling paradigm//J. At-mos. Solar-Terr. Phys. 2011. V. 73. N 13. P. 1697-1702. DOI: 10.1016/j.jastp.2011.03.006.
- Pedatella N.M., Fang T.-W., Jin H., et al. Multimodel comparison of the ionosphere variability during the 2009 sudden stratosphere warming//J. Geophys. Res.: Space Phys. 2016. V. 121. P. 7204-7225 DOI: 10.1002/2016JA022859
- Pedatella N.M., Maute A. Impact of the semidiurnal lunar tide on the midlatitude thermospheric wind and ionosphere during sudden stratosphere warmings//J. Geophys. Res.: Space Phys. 2015. V. 120. P. 10,740-10,753. DOI: 10.1002/2015JA021986.
- Polyakova A.S., Chernigovskaya M.A., Perevalova N.P. Ionospheric effects of sudden stratospheric warmings in eastern Siberia region//J. Atmos. Solar-Terr. Phys. 2014. V. 120. P. 15-23 DOI: 10.1016/j.jastp.2014.08.011
- Shpynev B.G., Kurkin V.I., Ratovsky K.G., et al. High-midlatitude ionosphere response to major stratospheric warming//EPS. 2015. V. 67, N 18 DOI: 10.1186/s40623-015-0187-1
- Wang H., Akmaev R.A., Fang T.-W., et al. First forecast of a sudden stratospheric warming with a coupled whole-atmosphere/ionosphere model IDEA//J. Geophys. Res. Space Phys. 2014. V. 119. P. 2079-2089 DOI: 10.1002/2013JA019481
- Woollings T., Charlton-Perez A., Ineson S., et al. Associations between stratospheric variability and tropo-spheric blocking//J. Geophys. Res. 2010. V. 115. D6. DOI: 10.1029/2009JD012742.
- Yiğit E., Medvedev A.S. Internal wave coupling processes in Earth’s atmosphere//Adv. Space Res. 2015. V. 55, N 5. P. 983-1003 DOI: 0.1016/j.asr.2014.11.020
- Yue X., Schreiner W.S., Lei J. et al. Global ionospheric response observed by COSMIC satellites during the January 2009 stratospheric sudden warming event//J. Geophys. Res. 2010. V. 115. A00G09 DOI: 10.1029/2010JA015466
