Voice Analysis for Telediagnosis of Parkinson Disease Using Artificial Neural Networks and Support Vector Machines

Author: Saloni, R. K. Sharma, Anil K. Gupta
Journal: International Journal of Intelligent Systems and Applications(IJISA) @ijisa
Article in issue: 6 vol.7, 2015.
Free access
Parkinson is a neurological disease and occurs due to lack of dopamine neurons. These dopamine neurons manage all body movements. Parkinson patients have difficulty in doing all daily routine activities, and also have disturbed vocal fold movements. Using voice analysis disease can be diagnosed remotely at an early stage with more reliability and in an economic way. In this paper, we have used 23 features dataset, all the features are analyzed and 15 features are selected from the total dataset. As in Parkinson tremor is present in the voice box muscles, so the variation in the period and amplitude of consecutive vocal cycles is present. The feature dataset selected consist of jitter, shimmer, harmonic to noise ratio, DFA, spread1 and PPE. Various classifiers are used and their comparison is done to find out which classifier is perfect in this environment. It is concluded that support vector classifiers as the best one with an accuracy of 96%. In the neural network classifiers with different transfer functions, there is tradeoff among the performance parameters.
Parkinson Disease, Voice Analysis, Feature Selection, Feature Classifier
Short address: https://sciup.org/15010721
IDR: 15010721
Text of the scientific article Voice Analysis for Telediagnosis of Parkinson Disease Using Artificial Neural Networks and Support Vector Machines
Published Online May 2015 in MECS
Diagnosis of Parkinson disease is very difficult and no diagnostic lab tests are available. Neurological tests and brain scans are done to diagnose it. These methods are very expensive and need high level of expertise. Some physical diagnosis can also be done but patients are required to be observed for a long time and this diagnosis give results when almost 80% of dopamine gets ended.
Voice of the person shows changes at an earlier stage, so diagnosis of Parkinson using voice analysis can be done at an earlier stage. Reduced in voice level by approx 10 db, whispering, breathiness, tremors, shifting to higher tones are some voice characteristics visible in PD voice. This method is very reliable and of very ultra low cost. Method is completely computerized and no medical professionals are required. As the PD patients have difficulty in clinical visits, in this voice analysis method no clinical visits are required. This method can be done telephonically, so the telediagnosis of the disease can be done by voice analysis with very less costs and efforts. Voice analysis for diagnosis of disease is not only limited to Parkinson but it can be used for many other diseases. Voice nodules, Reinke’ edema, asthma can also be diagnosed using this method. Various classifiers are used in such type of diagnosis. With the help of classifiers accuracy and reliability of diagnosis increases.
Multi-Layer Perceptron neural network and Support Vector Machine with linear and puk kernel function were used for classifying PD effected persons and healthy persons. A hybrid technique taking the advantage of both methods is proposed and achieved an accuracy of 90% [1]. In Artificial neural network 70% data as training data and 30% as testing data was used and 93.2% accuracy was achieved. The dataset consist of 23 features and MLP, RBF neural networks are used and their performance comparision is done [2]. By using maximum-relevanceminimum-redundancy criteria features are selected on the basis of mutual information measures between the features and support vector machines are used for building a predictive model [3]. Features are selected on the basis of information gain and twenty two attributes are reduced to sixteen and 83.3% accuracy is achieved with back propagation Multi layer perceptron network [4]. Various features subsets can be prepared using different feature selection criteria that are divergence, Bhattacharya distance and scatter matrices. The subset which gives maximum accuracy is selected [5]. In [6] sixteen features are extracted from the dataset using student’s t-test.Multi layer perceptron network and radial basis function(RBF)network are used for the classification.RBF gives better result. In [7] eleven attributes are selected using correlation filter and then classification is done. Fuzzy C mean clustering and pattern recognition is used for classifying normal speaking person and speakers with PD. Genetic algorithm is used for feature selection. In genetic algorithm solutions are represented by chromosomes until acceptable results are obtained. Crossover and mutation process is done to get new chromosomes. With genetic algorithm for feature selection and support vector machine for classification 94.5% accuracy is achieved [8]. When genetic algorithm with KNN classification method is applied 98.2% performance is obtained [9].The selected features by ANFC which were the combination of linear and non linear features are more powerful for classification than genetic algorithm [10]. The fuzzy K-nearest neighbor (FKNN) with principal component analysis (PCA) to construct the most discriminative new feature set is used for PD diagnosis [11]. In this paper extended database is used with more features. Four feature selection algorithms LASSO, Mrmr, RELIEF, and LLBFS are used with two statistical classifier: random forest and support vector machine [12]. In this paper, we have used the feature dataset of Parkinson disease. Feature selection and classification is used to classify healthy and pathological datasets. An optimum feature dataset is selected and an accuracy of 95.9% is observed.
-
II. Material and Method
The dataset used in this paper was created by Max little of the University of Oxford with the NCVS (National centre for voice and speech) collaboration. The dataset consists of phonation from 23 Parkinson and 8 control subjects. The sustained phonation of vowel ‘a’ was recorded for duration of 36 seconds. Phonations were recorded for six times and total 195 was recorded with a head mounted microphone (AKG CS420) positioned 8cm from lips. The subjects age range from 46-85 years. The recordings are made at a sampling frequency of 44.1 KHz with 16 bit resolution. All samples were digitally normalized in amplitude before feature calculations [13]. Fig. 1 represents the healthy and Parkinson speech signals.
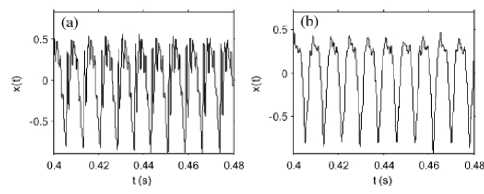
Fig. 1. Two selected examples of speech signals. (a) Healthy. (b) Parkinson. The horizontal axis is time in seconds and the vertical axis is signal amplitude [13].
Disease detection model as shown in Fig. 2 includes various stages from voice recording to the final result. Feature extraction, selection and classification are the main steps. Feature extraction is basically to find out the characteristics that represent a particular voice. In feature selection processs only those features are selected which shows variation among healthy and Parkinson subjects. The classification process includes training and testing steps. The performance parameters of the classifier show the success or failure of the detection system.
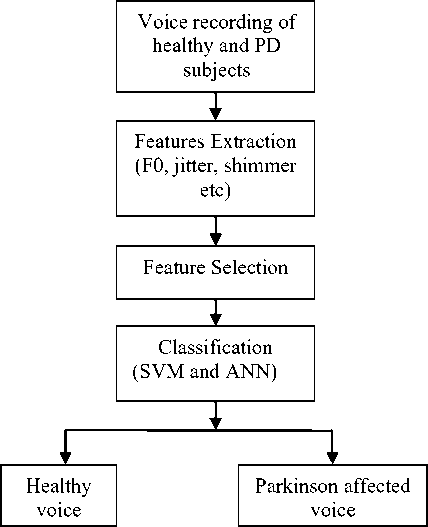
Fig. 2. Parkinson’s detection model
-
III. Feature Extraction
For all 195 phonations voice features are extracted. For feature extraction only first half of the recordings are considered and second half is rejected. Because the second half of the recording is influenced by reduced lung pressure. Various traditional measures and nonstandard measures are extracted. The data set consists of 22 features. Feature set is like this [Fo(Hz), Fhi(Hz), Flo(Hz), Jitter(%), Jitter(Abs), RAP, PPQ, Jitter:DDP, Shimmer, Shimmer(dB), Shimmer:APQ3, Shimmer: APQ5, APQ , Shimmer:DDA, NHR, HNR, RPDE, DFA, spread1, spread2, D2, PPE].
All traditional measures are calculated using PRAAT software. The vocal fold vibration frequency is known as fundamental frequency. The perturbation in the frequency and amplitude in successive vocal fold cycles is termed as jitter and shimmer respectively. Jitter causes the roughness in voice and shimmer causes the varying loudness. Jitter is percentage change in cycle duration between cycles and mathematically expressd as
N - 1
N
Z T - T i -.1
i = 1
Jitter (%) =
N
1 T
N Z
Shimmer is percentage change in speech amplitude between cycles and expressed as
shimmer =
N -1
N - 1
Zl A i - A i -11
i = 1
N 1A N Z
classifiers and robust to noise. It is a binary classifier and to do a multi-class classification, pair-wise classifications can be used. Cases where linear separation is not possible kernel functions like polynomial, RBF, Sigmoidal are used [15].
Harmonic-to-noise is the ratio of size of periodic component to size of aperiodic component in speech signal and measured using estimates of signal to noise by calculation of autocorrelation of each cycle. D2 is the correlation dimension between the signal and its first time delay embedded signal whereas the RPDE (Recurrence Period Density) is the measure of periodicity of the reconstructed signal after embedding time delay. DFA (Detrended Fluctuation Analysis) is the log-log plot of the time scales l and amplitude variation f (l). Non linear measure of fundamental frequency variation is defined in terms of spread 1 and spread 2. The logarithmic scale of pitch sequence is explained as semitone pitch p(t) where t is the time. The entropy of relative semitone variation is known as pitch period entropy (PPE). All these parameters show variation for the healthy and parkinson’s case. Next features are selected among these to get best classification among the two groups
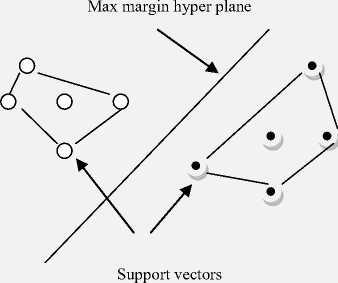
Fig. 3. Maximum margin plane and support vectors[15]
-
IV. Feature Selection And Classification
Feature selection is the step which reduces the dimensionality of data by selecting only a subset of measured features to create a model. Feature are selected which have more separable values than others and a new feature data subset is prepared which contains 15 features. [ Jitter(%), Jitter(Abs), RAP, PPQ, Jitter:DDP, Shimmer, Shimmer(dB), Shimmer:APQ3, Shimmer:APQ5, APQ , Shimmer:DDA, HNR, DFA, spread1, PPE]. Feature selection often increases classification accuracy by eliminating noise features.
Various Feature classifiers are used and their performances are compared. Supervised classification task usually involves with training and testing data which consist of some data instances. Each instance in the training set contains one target values and several attributes. The goal of training step is to produce a model which predicts target value of data instances in the testing set . 75% of the data is used for training purpose and rest 25% is for testing. Out of 195 observations, 146 are used for training (110 parkinson +36 healthy) and 49 is used for testing. Target data is also prepared. Various classifiers that are used are described below.
-
A. Support Vector Machines
Support vector machines builds a model using set of training examples each marked to its category and then used for classification. In this classifier, one hyperplane that represent the largest separation between the two classes is selected. Always maximum margin hyperplane is selected. Maximum margin hyper plane is a plane from which distance to the nearest data point on both side is maximized. These nearest data points are known as support vectors. Support vector machine is very accurate
B. Artificial Neural Network
An artificial neural network (ANN) is the mirror of biological neural network like brain. An ANN consists of artificial neurons. Connections between neurons have assigned a weight. Every neuron sum all the values it receive and then modifies the value based on its transfer function. So the transfer function translates the input signal to output signal. Following types of transfer functions are used in this paper.
1) Tansig Transfer Function:
Tan sigmoid transfer function generates output between -1 and +1. The transfer function is represented by following equation
B, =----------------- k (1 + exp( - 2 Ak )) - 1
Where Ak is the sum of weighted inputs in kth layer for a neuron. The graph for tansig transfer function is shown in Fig. 4.
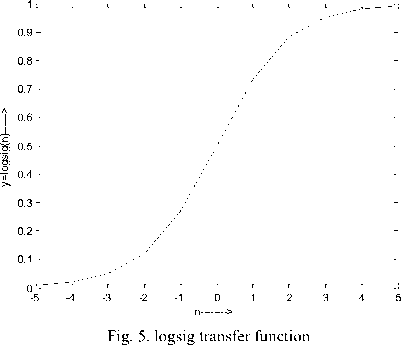
2) Logsig Transfer Function:
In the logsigmoid transfer function neuron output is always positive whereas input goes from negative to positive values. The equation is given as
B, =----------- k 1 + exp( - A^ )
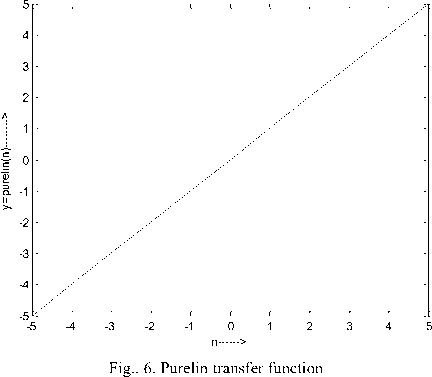
3) Purelin Transfer Function:
Purelin is a linear function, it generates output same as input. Graph and equation is given below.
Bv = Av kk
In the training process of ANN, the weights of the connections are adjusted, so that the difference between targeted output and predicted output is minimum. Here we have used feed forward back propagation learning algorithm, in which weights of the last layer are updated
first. We have considered MSE (mean square error) as the performance criteria in these practices.
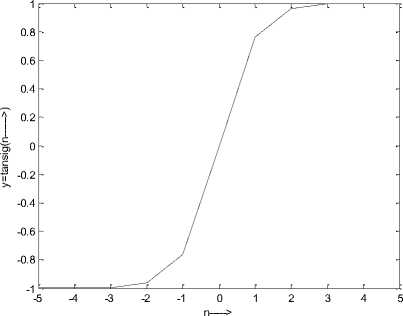
Fig. 4. Tansig transfer function
D. Classifier Performance
Classifiers performance can be compared using confusion matrix and some other parameters. The confusion matrix template is given below. True positive (TP) term represent the correct Parkinson disease samples classified and true negative (TN) represent correctly healthy samples classified. False negative (FN) means Parkinson samples classified as healthy and false positive (FP) means healthy sample as parkinson’s sample[16].
Table 1. Confusion matrix
Prediction Outcome
Actual value
True
Positive
False
Negative
False positive
True
Negative
In ANN performance of prediction is improved with an increasing number of neurons until a asymptote is reached because it increase the risk of overfitting[14].
-
C. Linear and Quadratic classifier
Linear and quadratic classifier is a machine learning system which classifies the two or more categories, by a linear and quadratic surface respectively.
Parameters are described as follows
TP
Senstivity =-------- *100
TP + FN
TN
Specificity =
TN + FP
(TP + TN )
Overallaccuracy = *
( TP + TN + FP + FN )
-
V. Observation and Result
In Parkinson disease tremor is present and it begins in one arm or hand. Within 1-2 years, the other arm is likely to be affected. Very occasionally, it may also spread to involve the legs. The voice, jaw or face may also be involved and as a result make speaking difficult. People with the disease may slur their words or stammer so quickly that they are hard to understand. Others may speak very softly, talk in a monotone. So, effect of this disease can easily be seen in the voice characteristics.
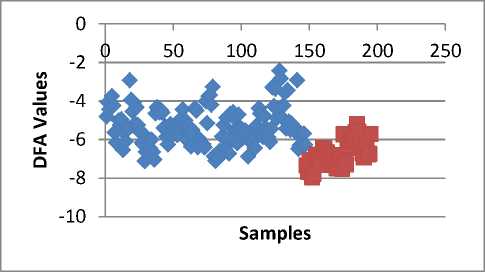
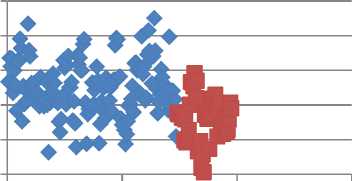
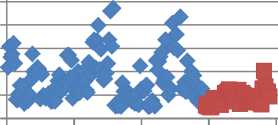
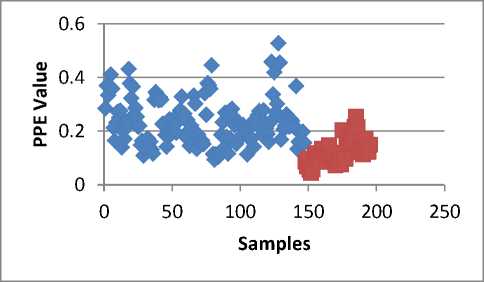
Parkinson voice has tremor in it and it is visible in jitter and shimmer values as shown in Fig. 7 (a), (b), (c). Jitter represents the frequency perturbation and jitter values are higher in parkinson subjects than the healthy one. Same results are observed in case of shimmer which is the amplitude perturbation. The harmonic to noise ratio values are high for the healthy one. The nontraditional measures show appreciable differentiation between the two classes. All the three features DFA, Spread1 and PPE have higher values for parkinson subjects than the healthy one. These are shown in Fig. 8. These Elevated values are because of the variations in consecutive cycles.
Various classifiers are used and their performances parameters are as explained above are shown in Fig. 9. For all classifiers same training and test data sets are used. Support vector machine classifier, artificial neural network with three different transfer functions (transig, logsig, purelin), linear and quadratic classifier are used. The confusion matrix and all performance parameters are calculated for all above mentioned classifiers. Support vector machine classifier gives maximum accuracy of 95.9%. The linear and transig artificial neural network classifier have the accuracy of 87.7%. Specificity and sensitivity is also explained for the classifiers. Specificity is 100% for the classifiers except quadratic and ANN(transig) classifier.
The comparisons of our result with some literature papers are tabulated in Table 2. The accuracy achieved in this proposed paper is very encouraging one. The accuracy achieved in this paper is 96%, on other hand in literature it is 90%, 93.2%, 92.7%, 83.3%.This accuracy shows the significant change in the voice of Parkinson subjects as compare to healthy one.
(a)
ш □ го >
ш
0.04
0.03
0.02
0.01
Nwiv*
0.5
з 0.4
> 0.3
"го 0.2 го
Q. 0.1 ю
0 50 100 150 200 250
Samples
0 100 200 300
Samples
0.14
ш 0.12
го 0.1
* 0.08
Е 0.06
Е 0.04
5 0.02
(a)

0 50 100 150 200 250
(b)
(c)
Fig. 8. (a), (b), (c) represent the DFA, spread1 and PPE values distribution for □ healthy and Parkinson subjects.
ш
го
се
Samples
(b)
Table 2. Comparision table
References Voice Analysis for Telediagnosis of Parkinson Disease Using Artificial Neural Networks and Support Vector Machines
- A. David Gill and B. Magnus Johnson, “Diagnosing Parkinson by using Artficial Neural Network and Support Vector Machines,” Global Journal of Computer Science and technology, vol. 9, pp. 63-71, 2009.
- F. S. Gharehchopogh and P. Mohammadi, “A Case Study of Parkinson Disease using Artificial Neural Network, vol. 73, 2013, pp.1-6.
- C.O. sakar and O. Kursun, “Telediagnosis of Parkinson’s Disease Using Measurements of Dysophonia, J Med Syst, Vol 34, 2010, pp. 591-599.
- A. Khemphila and V. Boonjing, “Parkinson Disease Classification Using Neural Network and Feature Selection” WASET, Vol 6, 2012, pp.15-18.
- H. K. Rouzbahani and M. R. Daliri, “Diagnosis of Parkinson’s Disease in Human using Voice Signals,” Neuroscience, Vol 2, pp 12-19, 2011.
- U. Rani and M. S. Holi, “Analysis of speech characteristics of neurological disease and their classification” Computing Communication & Networking Technologies (ICCCNT), pp.1-6, 2012.
- I. Rustempasic and M. Can, “Diagnosis of parkinson’s disease using fuzzy C-means clustering and pattern recognition” Southeast Europe Journal of Soft Computing, pp.42-49, 2013.
- M. Shahbakhi, D. T. Far and E. Tahami, “ Speech Analysis for Diagnosis of Parkinson’s Disease Using Genetic Algorithm and Support Vector Machine,” J. Biomedical Science and Engineering, vol. 7, pp. 147-156, 2014.
- R. A. Shirvan and E. Tahami, “Voice Analysis for Detecting Parkiinson’s Disease using Genetic Algorithm and KNN Classification Method”IEEE, 2011,pp 278-283. M. Shahbakhi, D. T.Far, “Linear and Non-linear speech Features for Detection of Parkinson’s Disease” BMEiCON,2013.
- M. Shahbakhi, D. T.Far, “Linear and Non-linear speech Features for Detection of Parkinson’s Disease” BMEiCON,2013.
- H. L. Chen, C. C. Huang, X. G. Yu, X. Xu, X. Sun,G. Wang, S. J. Wang, “An Efficient diagnosis system for detection of Parki nson’s disease using fuzzy K- nearest neighbor approach” Expert System With Application,40, pp-263-271, 2013.
- A. Tsanas, Max A. Little, P. E. Macsharry, “Novel Speech Signal Processing Algorithm for High-Accuracy Classification of Parkinson’s Disease, IEEE Transaction on biomedical engg,Vol. 59,2012, pp 1264-1271.
- Max A. Little, P. E. Macsharry, E. J. Hunter, J.Sielman, L. O. Raming, “Suitability Of Dysophonia Measurements for Telemonitoring of Parkinson’s Disease, IEEE Transaction on biomedical engg,Vol. 56,2009, pp 1015-1022.
- D. Reby, S. Lek, I.Dimopoulos, J. Joachim, J. Lauga, S. Aulagnier, “ Artficial neural networks as a classification method in behavioural sciences” Behavioural Processes, 40, 1997,pp 35-43.
- Saloni, R.K. Sharma and A.K. Gupta, “ Disease detection using voice analysis: a review” International Journal of Medical Engineering and Informatics (IJMEI), Vol. 6, No. 3, 2014, pp 189-210.
- Saloni, R.K. Sharma and A.K. Gupta, “ Classification of High Blood Pressure Persons VsNormal Blood Pressure Persons Using Voice Analysis” I.J. Image, Graphics and Signal Processing, 2014, 1, 47-52.
