Wavelet transform procedure as the basis for complete automatic interpretation of the cardiac cycle phase structure

Author: Fedorov Vladimir, Mamberger Konstantine
Journal: Cardiometry @cardiometry
Section: R&D engineering in cardiometry
Article in issue: 1, 2012.
Free access
Aims The article aims at describing the basic principles of cardiometry - a fundamentally new scientific field which enables the accurate measurement of cardiovascular system parameters. Materials and Cardiometry is based on the mathematical model of hemodynamic methods processes. The model is described by G. Poyedintsev and O. Voronova equations. The variable values in these equations are the cardiac cycle phase durations recorded on the ECG. Results An innovative mathematical model of hemodynamics providing the creation of an innovative indirect method of cardiovascular system parameters measurement was developed. The ECG processing is performed by means of the wavelet transform for detecting the boundaries of the cardiac cycle phases. Conclusion The innovative method of cardiovascular system diagnostics enables to measure 7 main hemodynamic parameters using noninvasive technology for qualitative evaluation of 12 functions of cardiovascular system performance and general assessment of coronary flow status. One of the problems the model of hemodynamics deals with is identifying the boundaries of the cardiac cycle phases. To identify the boundaries of the cardiac cycle phases the method of finding the extrema on the initial ECG and the differentiated ECG basing on the wavelet transform was used.
Cardiometry, cardiology, ecg, hemodynamics, wavelet transform
Short address: https://sciup.org/148308718
IDR: 148308718
Text of the scientific article Wavelet transform procedure as the basis for complete automatic interpretation of the cardiac cycle phase structure
Aims The article aims at describing the basic principles of cardiometry – a fundamentally new scientific field which enables the accurate measurement of cardiovascular system parameters. Materials and methods Cardiometry is based on the mathematical model of hemodynamic processes. The model is described by G. Poyedintsev and O. Voronova equations. The variable values in these equations are the cardiac cycle phase durations recorded on the ECG. Results An innovative mathematical model of hemodynamics providing the creation of an innovative indirect method of cardiovascular system parameters measurement was developed. The ECG processing is performed by means of the wavelet transform for detecting the boundaries of the cardiac cycle phases. Conclusion The innovative method of cardiovascular system diagnostics enables to measure 7 main hemodynamic parameters using noninvasive technology for qualitative evaluation of 12 functions of cardiovascular system performance and general assessment of coronary flow status. One of the problems the model of hemodynamics deals with is identifying the boundaries of the cardiac cycle phases. To identify the boundaries of the cardiac cycle phases the method of finding the extrema on the initial ECG and the differentiated ECG basing on the wavelet transform was used. Keywords Cardiometry ≈ Cardiology ≈ ECG ≈ Hemodynamics ≈ Wavelet transform Imprint Vladimir N. Fedorov, Konstantine K. Mamberger. Wavelet transform procedure as the basis for complete automatic interpretation of the cardiac cycle phase structure; Cardiometry; No.1; November 2012; p.126-132; doi:10.12710/cardiometry.2012.1.125131 Available from:
According to Fourier analysis any complex oscillation (similar to arterial pressure pulse waves) can be represented as a set of sinusoidal components. As every sinusoidal oscillation of this set (called harmonic curve) has its frequency and amplitude and all the oscillations are phase-shifted against the others, the signal presented in the form of amplitude-time description can be shifted into an equivalent form which will be expressed through amplitude-frequency description, and this signal can be regenerated into amplitude-time description. It results in constructing a graph of the intensity of oscillations depending on their frequency.
This mode of decomposition means that mathematical operations on sinusoidal functions representing different harmonic curves are relatively simple. E.g., basing on the described below simple theory, for every sinusoidal wave of arterial pressure it is possible to calculate the corresponding sinusoidal wave of the flow rate. Each of these waves is characterized by its frequency, amplitude and phase. Then, adding together all sinusoidal waves of flow rate it is possible to build a complex combined flow rate wave and compare it with the test wave value. In an equivalent manner, if the shape of the pressure wave in a certain location is known it is possible to calculate the shape of the pressure wave or the blood flow velocity in a different location of the arterial system. It is possible though only if geometry and elastic properties of the arteries in the corresponding location of the system are known, and the specifics of every sinusoidal component can be calculated. (The discrepancy between the theoretical possibilities and practical implementation are defined to a great extent by our incomplete knowledge of geometry and arterial elastic properties). The main limitation of the mentioned utilization of Fourier analysis is determined by the fact that the method uses “Fourier window” that cannot be adapted to the local signal properties. As a result, on the low-frequency spectral region the frequency resolution disappears and on the high-frequency spectral region the time resolution disappears. So the analysis appears to be rather correct only in case when the system under investigation is linear. If the system is not linear the certain harmonic curves are not independent and the addition of the sinusoidal waves does not make it possible to predict the properties of the complex wave. This is a very important limitation that should be considered.
At present for establishing diagnosis the doctor uses the method of time interval measurement of the marked ECG peaks and their amplitudes as well as analyzes their frequency and periodicity.
The frequency of ECG cycles is time-dependent and Fourier transform can not be used for synchronous description of frequency and time representation of the signal. In this case the use of the time-frequency ECG transform is justified.
Materials and methods
Among all the existing transforms the wavelet transform is the best for the ECG analysis. Wavelets represent a family of local functions of time and frequency. All the functions in the family are derived from one function by means of its shifting and extension along the time axis (so that the functions “follow each other”).
Why are Fourier transform and Fourier series a good but in many cases nonsufficient mathematical tools for physical interpretation of the processes when their characteristic processes are analyzed?
As for the ECG signals, physical interpretation using the given Fourier transform procedure is not possible. The use of the wavelet transform proved to be rather efficient when minor deviations in the ECG signal should ne traced. There is a number of research papers concerning the use of the wavelet transform for the ECG evaluation. These research papers can be divided in two groups: those dealing with diagnosticating the signs of the heart disease with its further definition and those dealing with the ECG analysis for identifying the peak points with small amplitude and their location on the recorded ECG [2, 3].
The method of wavelet decomposition possesses a wide range of possibilities for signals analysis. The method is used for filtering [4] as well as time and frequency location of extrema. Thus, the method is a powerful tool for characteristics identification [5]. Soliton wave (structurally stable solitary wave propagating in nonlinear medium, moving and preserving its structure) is the element of the wavelet basis. Thus, it is the function which is properly localized, decreasing and tending to zero beyond the certain interval.
The basis functions of the wavelet transform should possess the following characteristics which are specified in the research literature. E.g. [6], wavelet transform is a scalar product of the analyzing wavelet in the given scale and the analyzed signal. The decomposition coefficients contain information about the analyzing wavelet and the analyzed signal.
The choice of the analyzing wavelet is determined by the information that should be extracted from the signal. Each wavelet possesses distinguishing characteristics in the time and frequency dimension. Thus, with the aid of different wavelets it becomes possible to define and mark particular characteristics of the analyzed signal.
The real bases are often formed on the ground of the derivative of the Gaussian function.
Thus, the wavelet
V ( x ) =
(1 - x2 e 2
)
named “Mexican Hat” (or MHAT-wavelet) is in proportion to the
second derivative of the Gaussian function.
MHAT-wavelet having a narrow power spectrum and two moments tending to zero (zero time and first moment) is used for analyzing compound signals.
For ECG data analysis from 5 to 7 peak points are used. Peak points P, Q, R, S, T, L, J rather fully characterize the cardiac muscle performance. However, in case of some diseases the localization of specific peak points on the ECG curve is difficult to define which causes the necessity to exploit additional methods for the ECG data analysis. As far as MHAT-wavelet possesses narrow power spectrum it was chosen as the basis function.
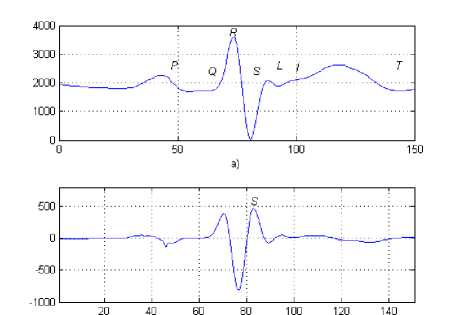
Part of the ECG curve of the normal patient (a) and the differential ECG (b) with marked peak points are shown in Fig.1.
b)
Figure 1. Part of the ECG curve of the normal patient: initial ECG (a) and differential ECG (b) with marked peak points.
Peak points P, Q, R, S are of great importance for establishing diagnosis, but if R, S peak points location is easily identified on the ECG curve, identifying location of peak point P and especially of peak point Q is often problematic. Use of the wavelet transform enables to find the solution of the given problem. The fact is that the wavelet transform identifies the local signal characteristics in the time series at different scale coefficients. Fig.2 shows the signal wavelet spectrogram where the vertical stripes correspond to local characteristics; concentration of the light wavelet spectrogram regions corresponds to local extrema, and concentration of the dark wavelet spectrogram regions corresponds to depressions.
Absolute Values of Ca,b Coefficients for a = 1 2 3 4 5
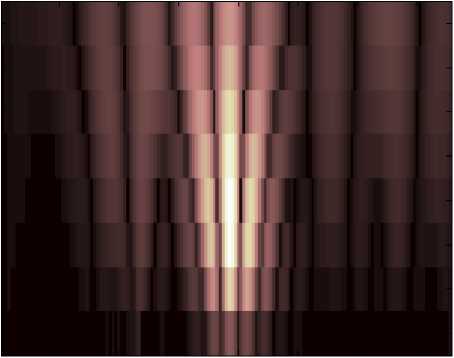
20 40 60 80 100 120 140
time, (or space.) b
Figure 2. Wavelet spectrogram of the ECG part.
The more intense is the ECG characteristic the more accurately it is marked on the wavelet spectrogram. Herewith such characteristics as minor discontinuities, alteration of the first and second derivatives signs, etc. are marked. All these characteristics are not properly marked by Fourier transform.
Fig. 3 shows the ECG curves after using the wavelet transform for a differentiated ECG.
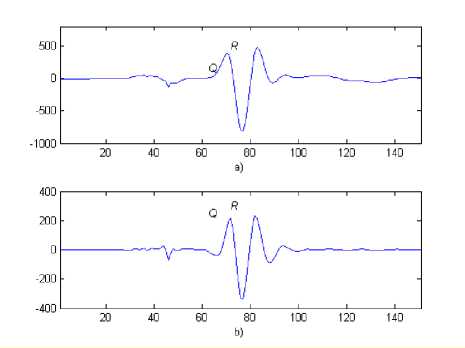
Figure 3. Differentiated ECG: a) initial ECG; b) ECG after the wavelet transform.
Let us consider peak point Q . After the use of the wavelet transform a depression which is characteristic of the peak point Q can be seen. It enables identifying the peak point on the ECG using the standard methods of signal processing.
Results
The method of wavelet transform for analysis of the cardiac cycle phases recorded on the ECG was investigated. The received results show the possibility of discovering and defining the local extrema on the boundaries of the cardiac cycle during the automatic ECG evaluation. On the basis of these results the method of obtaining the local extrema automatically (in the process of the ECG data processing) was developed.
Discussion and conclusions
The method enables the noninvasive measurement of 7 basic hemodynamic parameters for qualitative evaluation of 12 functions of cardiovascular system performance and general assessment of coronary flow status [7].
Statement on ethical issues
Research involving people and/or animals is in full compliance with current national and international ethical standards.
Conflict of interest
None declared.
Author contributions
All authors contributed equally to this work. K.K.M. read and met the ICMJE criteria for authorship. All authors read and approved the final manuscript.
References Wavelet transform procedure as the basis for complete automatic interpretation of the cardiac cycle phase structure
- Ahmed N., Rao K.R. Orthogonal Transforms for Digital Signal Processing. Springer-Verlag (Berlin, Heiderberg, New York), 1975, 248 pages.
- Saritha C., Sukanya V.,Murthy Y.N. ECG Signal Analysis Using Wavelet Transforms. Bulg. J. Phys. 2008 (Vol. 35): 68-77.
- Fazlul Haque A.R.M., Md. Hanif Ali, M. Adnan Kiber and Md. Tanvir Hasan. Detection of Small Variations of ECG Features Using Wavelet. ARPN Journal of Engineering and Applied Sciences 2009 (Vol. 4, No 6): 27-30.
- Ivo Provazn´ık and Jiˇr´ı Kozumpl´ık. Wavelet transform in electrocardiography data compression. International Journal of Medical Informatics 1997, 45 (1-2):111-128.
- Cuiwei Li, Chongxun Zheng, and Changfeng Tai. Detection of ECG characteristic points using wavelet transforms. IEEE Trans. Biomed. Eng. 1995, 42(1): 21-28.
- Coifman R., Meyer Y. and Wickerhauser M.V. 1992. Wavelet Analysis and Signal Processing 'Wavelets and their Applications', ed. Ruskai M. B. et al., Jones and Bartlett: 153-178.
- Rudenko M., Voronova O. & Zernov V. Theoretical Principles of Heart Cycle Phase Analysis. Fouqué Literaturverlag. ISBN 978-3-937909-57-8, Frankfurt a/M. München -London -New York, 2009.
