Web Video Object Mining: A Novel Approach for Knowledge Discovery

Автор: Siddu P. Algur, Prashant Bhat
Журнал: International Journal of Intelligent Systems and Applications(IJISA) @ijisa
Статья в выпуске: 4 vol.8, 2016 года.
Бесплатный доступ
The impact of social Medias such as YouTube, Twitter, and FaceBook etc on the modern world is led to huge growth in the size of video data over the cloud and web. The evolution of smart phones/Tabs could be one of the reasons for increasing in the rate of huge video data over the web. Due to the rapid evolution of web videos over the web, it is becoming difficult to identify popular, non-popular and average popular videos without watching the content of it. To cluster web videos based on their metadata into 'Popular', 'Non-Popular', and 'Average Popular' is one of the complex research questions for the Social Media and Computer Science researchers'. In this work, we propose two effective methods to cluster web videos based on their meta-objects. Large scale web video meta-objects such as- length, view counts, numbers of comments, rating information are considered for knowledge discovery process. The two clustering algorithms-Expectation Maximization (EM) and Distribution Based (DB) clustering are used to form three types of clusters. The resultant clusters are analyzed to find popular video cluster, average popular video cluster and non-popular video clusters. And also the results of EM and DB clusters are compared as a step in the process of knowledge discovery.
Meta-objects, Web Videos, Clustering, YouTube, Expectation Maximization, Distribution Based Clusters
Короткий адрес: https://sciup.org/15010816
IDR: 15010816
Текст научной статьи Web Video Object Mining: A Novel Approach for Knowledge Discovery
Published Online April 2016 in MECS
YouTube is recognized as one of the most successful user-generated video sharing sites nowadays. YouTube has over a billion users — almost one-third of all people on the Internet — and every day people watch hundreds of millions of hours on YouTube and generate billions of views [1]. In order to facilitate users to find interesting videos from a large number of videos, YouTube provides different features/meta-objects such as – view counts, rate, ratings, number of comments, favorites, key words, information regarding likes and dislikes etc.
The objective of this study is to cluster web videos into three clusters based on meta-objects and to analyze the resultant clusters to find popular, average popular and non-popular videos as a knowledge discovery process using Expectation Maximization (EM) and Distribution Based (DB) clustering approach.
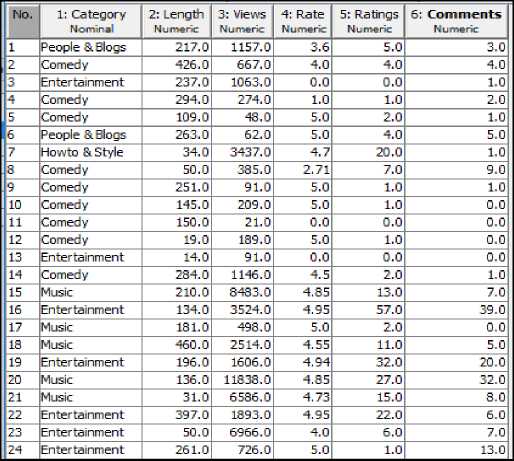
This work is continuation of our previous works [2] [3] [4] to discover knowledge from web videos using metaobjects. To succeed in the proposed objective of the work, large scale web video meta-objects are extracted from the standard YouTube dataset website [5]. This meta-objects includes various attributes such as- ‘Category’, ‘View Counts’, ‘Rate’, ‘Number of Comments’, ‘Avg Ratings’ and ‘Length’ of each web videos.
The schematic structure of the dataset is represented in Fig.1
The main contributions of our work are as follows:
-
• For the large scale web video metadata object dataset, train the dataset using EM and DB semisupervised clustering approach with number of clusters as three by choosing nominal values of the attribute ‘Category’. .
-
• The trained/built semi-supervised clustering models using EM and DB are tested for large scale web video metadata object dataset.
-
• The resultant semi-supervised clusters of EM and DB are analyzed in depth to discover knowledge from web videos.
Many clustering models/algorithms and data mining machine learning tools are developed in recent years. Using different data mining algorithms and machine learning tools such as R programming and WEKA, it is possible to clustering the web videos based on their features/meta-objects.
The rest of the paper is organized as follows: The section 2 represents related works on the clustering of web videos, section 3 represents proposed web video clustering methodology, section 4 represents performance evaluation analysis of cluster models and comparison of efficiency of cluster models, and finally section 5 represents conclusion and future enhancements.
-
II. Related Works
This section represents some related previous works which are implemented to cluster web videos using metaobjects.
The authors [2], worked on implication of web video descriptive metadata and presented a useful and proficient method for extraction and construction extraction of web video descriptive metadata. The presented method recognized the effectiveness of constructing the descriptive metadata with timeline for some domain specific web videos. The work of [2] also recommended the construction of event specific and objects specific metadata and which are considered to be very useful. With the proposed descriptive metadata model, users may process the video contents effectively and efficiently
In the work of [3], the authors proposed effective method to classify web videos based on meta-objects. The work of [3] used Random Tree and J48 Classification algorithms to classify large scale web videos based on 16 different categories of videos. The efficiency of the classification models is found good; however, the efficiency of J48 classification model is found less as compared to Random Tree Classification Model.
In order to improve the classification accuracy of J48 classification model built in the research work [3], the authors [8] proposed and experimented on the same dataset by using data discrimination technique. The result of the experiment of [8] is found good. Also all the considered meta-objects are predicted using navie Bayesian and J48 Classification Models.
In the work of [4], effective attempts are made to unsupervised cluster the web videos based on metaobjects such as – category, view counts, length, number of comments, and rating information. The clusters are made to form automatically using unsupervised Expectation Maximization and Distribution Based clustering approach. Effective clustering models were built using EM and DB algorithms and applied on large scale web video metadata object dataset. Various clusters were formed according to the values web video metaobjects. The each resultant clusters are analyzed in depth and normal distribution of each numerical metadata object within clusters are found. Also we [4] found, the log likelihood of EM and DB cluster models. Difficulties were arrived to discover popular, average popular and non-popular videos.
The authors Renjie Zhou, Samamon Khemmarat, Lixin Gao [9] have made a depth study on the influence of related video recommendation system based number of view counts of web videos. By considering the measurement of view counts, the authors found that the related video recommendation accounts for about 30% of overall view counts. Also, the authors strongly disputed that this is the most vital view source for the majority of videos. By finding how video view counts are determined by the recommendation system, the authors found a strong correlation between the number of view count of a video and the average view count of its top referrer videos, and also discovered that, the position of a video on a related video list plays a significant role in the click through rate of the web video. The assessment of the blow of the video recommendation system on the diversity of video views results in the presence of YouTube recommendation facilitates to increase the diversity of web video views in aggregation, meaning that, YouTube recommendation helps viewers to find out more videos of their concern rather than the popular videos.
The authors Jose San Pedro, Stefan Siersdorfer, and Mark S [10] conducted a study on previously unexplored content based links between videos in web videos (YouTube). The authors [10] proposed a methodology to generate Visual Affinity Graphs, by exposing different types of visual relationships between elements in the network. More than 38, 000 videos, comprising over 2, 800 hours, were downloaded and analyzed. The resulting visual affinity graphs showed a noticeable amount of redundancy in the set, with over a third of the results being visually linked to others. The most common kind of relationship was duplication, accounting for 15.80% of the test collection.
In accordance with clustering of web videos, the authors C.F-Hsu, James C., and E. Khabiri [11] proposed by means of comment term normalization and key term extraction via KL-Divergence for distilling noisy comments. The authors [3] also developed an incremental insertion component for updating the comments-based hierarchy. The advantage of this technique is- resources can be efficiently placed in the hierarchy. This is because, comments arise and without the need to re-generate (potentially) the expensive hierarchy. The experimental study over YouTube provides proof that the proposed approach can lead to comments-based video management in social video sharing websites such as YouTube-like environment.
Xu Cheng, Cameron Dale, and Jiangchuan Liu [12] proposed a detailed analysis of the characteristics of YouTube, which is known to be most popular Internet short video sharing website. Through investigating the massive amounts of data collected in a 3-month period, the authors [12] verified that, while sharing certain similar features with traditional video repositories, YouTube reveals many exclusive characteristics, particularly in access pattern, length distribution, and growth trend. Such traits establish new challenges and opportunities for optimizing the performance of small video sharing services. The authors [12] also examined the social network among YouTube videos, which has most unique and interesting characteristics, and is substantially contributed to the achievement/success of new generation of service. Also the authors [12] found that the systems of interrelated videos, which are selected based on user-generated content, have both small-world uniqueness of a short characteristic path length linking any two videos, and a large clustering coefficient indicating the grouping of videos. This uniqueness can be exposed to assist the design of novel caching or peer-to-peer approach for short video sharing.
The experimental results of C. Ramachandran, R.Malik, Xin Jin and Jing Gao [8] showed that the Video- Mule has a good accuracy, precision and recall than individual classifiers and clustering algorithms. Also in future the authors [13] have strategy to expand the evaluation process with data from other video-sharing websites using Video-Mule.
The authors Alex Hindle, Jie Shao Dan Lin, Jiaheng Lu and Rui Zhang [14] developed a web video search system which has extra post-processing functionality of clustering results. This facilitates users to recognize their preferred videos more suitably. The planned information integration framework of [14] is- first attempt to examine the fusion of the diverged information from different sources for clustering. The major infrastructure of the proposed system is completed and is readily extendible to integrate and check other video clip and text comparison algorithms, as well as clustering algorithms, which may be further look up the quality of clustering.
The authors [15] defined a method to produce Visual Affinity Graphs, revealing dissimilar kinds of visual associations between elements in the network. Approximately 38,000 videos, comprising over 2,800 hours, were taken from the website and analyzed. The resultant visual affinity graphs showed considerable quantities of noise/redundancy in the set, with over a third of the results were visually linked to others. The experiments of classification and clustering showed that the supplementary information obtained by automatic tagging can considerably improve the automatic structuring and organization of content; The primary user assessment point outs an information gain for viewers of the videos.
-
III. Proposed Methodology
In this section we present novel methodology of the proposed web video clustering approach. The web video meta-objects are extracted from standard web video database website [5]. A typical structure of web video metadata object dataset is presented in Table 1. In the Table 1, the attribute ‘Category’ is nominal and contains 16 different classes of web videos [3]. The remaining attributes are numeric and represents features of each web videos. For experimental purpose, out of the total 47697 metadata object dataset, 60% are used for training and remaining 40% are used for testing the cluster model built using Expectation Maximization and Distribution Based clustering methods. The cluster results of each considered meta-objects are analyzed in depth for knowledge discovery.
Table 1. Structure of Web Video Metadata Object Dataset
The system model of the proposed technique is represented in Fig. 1, and it consists of the following components:
-
A) Web Video Meta-objects Collection Process
-
B) Data Refinement Process
-
C) Clustering Process
-
D) Result Analysis and KDD Process
-
A) Web Video Meta-objects Collection Process
The different kind of web video meta-objects are extracted using InforExtractor tool [7] and web video meta-objects are then stored in a disk [6] with CSV or ARFF file format for experimental purpose.
-
B) Data Preprocessing and Refinement Process
The raw web video metadata objects are then preprocessed to conduct effective proposed experiments. The summary of the web video metadata object dataset is shown in Table 2. The Table 2 contains Box Plot representation of each attributes of web video metadata object dataset. For experimental convenience, we consider limits of 1st quadrant data as non-popular, limits of 2nd and 3rd quadrant data as average popular, and limits of 4th quadrant data as popular videos. In each attribute missing values are present as shown in the Table 2. To handle numeric missing values in the web video metadata object dataset, it is necessary to plot normal distribution graph for each numeric attribute. The normal distribution graph decides the way of filling the numeric missing values via mean or median.
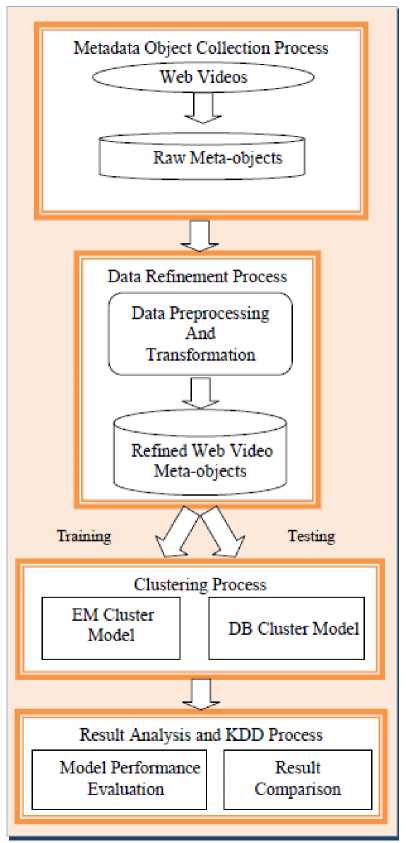
Fig.1. System model of the proposed methodology
The normal distribution graphs of each numeric attribute are shown in Fig. 2. The behavior of normal distribution is identified in each numeric attributes. The web video metadata attributes ‘Length’, ‘Views’, ‘Ratings’, ‘Comments’ are positively skewed and the attribute ‘Rate’ is negatively skewed. In the cases of positive and negative skewed data distributions, we need to employ with median of the numeric attributes to fill the missing values. Hence, the median of each numeric attribute is replaced with missing values present in the dataset.
Also in the case of missing values present in the nominal attributes, we consider most repeated values present in the attribute and is found ‘Music’. The categorical feature ‘Music’ is replaced with missing values present in the nominal attribute ‘Category’. It is observed from the normal distribution of each numeric attribute, the density of attributes ‘Views’, ‘Ratings’ and ‘Comments’ exhibits same pattern, whereas the density of ‘Length’ and ‘Rate’ exhibits different patterns. This shows shat, the attributes’ ‘Views’, ‘Ratings’ and ‘Comments’ exhibits similar patterns. To uncover the relationship among the web video metadata attributes an attempt is made to find the correlation matrix of the numeric attributes and is presented in Table 3 and Fig.3.
From the Table 3 and Fig. 3, it is observed that, the metadata attributes ‘Views’, ‘Ratings’ and ‘Comments’ are strongly correlated and the metadata attributes ‘length’ and ‘rate’ are weakly correlated to other attributes. Hence, for the proposed clustering experiment, the metadata attributes’ ‘Views’, ‘Ratings’ and ‘Comments’ are significant and the attribute ‘Rate’ exhibited interesting patterns and is considerable for the experiment.
-
C) Clustering Process
The proposed work uses Expectation Maximization and Distribution Based clustering approach to cluster web video objects automatically. Our previous work [4] was unsupervised clustering of web video meta-objects using Expectation Maximization and Distribution Based approach. Difficulties were arrived to discover the knowledge from web videos due to many clusters were formed randomly. Five and three clusters were formed while using Expectation Maximization and Distribution Based Clustering models respectively.
To overcome from this problem, we propose semisupervised clustering approach by giving limitation for number of clusters in both clustering approach. The limitation is fixed for three clusters.
The EM algorithm decides three clusters to generate by cross validation method. In this experiment, the training set is split randomly into 10 folds.
The number of folds is fixed to 10, as long as the number of instances in the training set is not smaller 10. If this is the case the number of folds is set equal to the number of instances.
The remaining clustering procedure (Maximization step) of Expectation Maximization clustering method is same as described in our previous work [4].
Distribution Based clustering approach uses the local Distribution of points to determine the clusters [4]. In a cluster shape of radius ε around a point x, called the ε -neighborhood of x can be compute as follows:
N ε (x) = Bd (x, ε) = {y | δ(x, y) ≤ ε}
Here δ(x, y) is the Euclidean distance between x and y.
In a web video metadata object database D, for any web video metadata object value x ϵ D, we say that x is a core point if there are at least minimum y metadata object values in its neighborhood. In other words, x is a core object value if | N ε (x) | ≥ y, where y is a user-defined local Distribution or frequency threshold. In this experiment, the value of y is set to 3. i.e., the number of cluster is set to 3. A border object value is defined as -object value that does not meet the y frequency or threshold. That is, it has | Nε (x) | < y, and is belongs to the neighborhood of some core object value z, i.e., x ϵ N (z).
The remaining clustering procedure of Density Based clustering method is same as described in our previous work [4].
-
D) Result Analysis and KDD Process
In Data Mining strategy, the performance evaluation and result analysis are significant steps to discover the knowledge. In this work we are discovering popular videos, average popular videos and non-popular videos after formation of clusters using EM and DB clustering models. In this step, the resultant clusters will be analyzed in depth to find which cluster contains popular, average popular or non-popular videos in maximum numbers. In each cluster outlier videos are removed for better result. The log-likelihood of each cluster model will be compared and presented.
-
IV. Experimental Results and Discussion
This section is focused on in-depth study of cluster analysis of web video meta-objects. The metadata object ‘Category’ which has different 16 nominal classes, is chosen for cluster evaluation. The 60% of the web video metadata object dataset are trained and 40% are tested for the evaluation and knowledge discovery from cluster objects.
Table 2. Summary of web video metadata object dataset
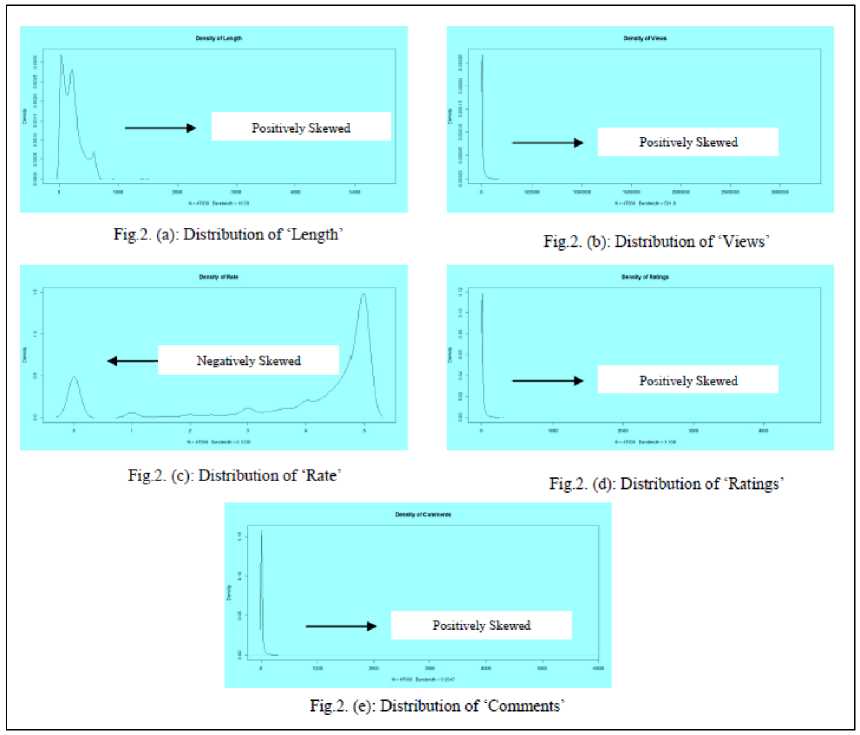
Fig.2. Distribution of Numeric Attributes
|
Summary |
Length |
Views |
Rate |
Ratings |
Comments |
Category (Nominal) |
|
Min. |
0.0 |
1 |
0.0 |
0.0 |
0.0 |
NA |
|
1st Qu. |
83.0 |
579 |
3.67 |
2.0 |
1 |
NA |
|
Median |
194.0 |
2220 |
4.69 |
6.0 |
4 |
NA |
|
Mean |
223.5 |
11342 |
3.87 |
20.93 |
18.23 |
NA |
|
3rd Qu. |
296.0 |
8176 |
5.0 |
17.0 |
13 |
NA |
|
Max. |
5412.0 |
3281256 |
5.0 |
4629 |
5772 |
NA |
|
Missing Values |
48 |
57 |
65 |
37 |
40 |
37 |
|
Std Dev |
216.5 |
34748.7 |
1.7 |
67.3 |
70.7 |
NA |
Table 3. Correlation Matrix of Metadata Object Attributes
|
Length |
Views |
Rate |
Ratings |
Сопле nt s |
|
|
Length |
1.00000000 |
0.01809850 |
0.15129101 |
0.09103675 |
0.04003817 |
|
Views |
0.01809850 |
1.00000000 |
0.09119978 |
0.61875332 |
0.44539376 |
|
Rate |
0.15129101 |
0.09119978 |
1.00000000 |
0.12776561 |
0.08509241 |
|
Ratings |
0.09103675 |
0.61575332 |
0.12776561 |
1.00000000 |
0.74859224 |
|
Coimments |
0.04003817 |
0.44539376 |
0.08509241 |
0.74859224 |
1.00000000 |
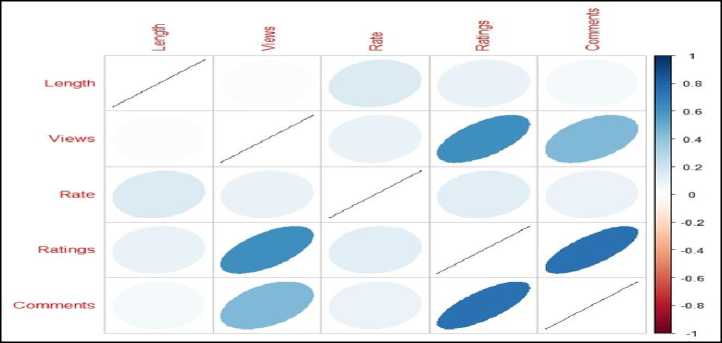
Fig.3. Correlation Matrix graph representation of web video Meta object dataset
Table 4. Cluster Results using EM and DB Models
|
Sl.No |
Category |
Total Instances |
Metadata Object Cluster Assignments |
|||||
|
Cluster 0 |
Cluster 1 |
Cluster 2 |
||||||
|
EM |
DB |
EM |
DB |
EM |
DB |
|||
|
1 |
People & Blogs |
3637 |
615 |
776 |
753 |
806 |
2306 |
2092 |
|
2 |
Comedy |
2885 |
607 |
516 |
504 |
847 |
1774 |
1522 |
|
3 |
Entertainment |
11474 |
2136 |
1554 |
1479 |
2417 |
7859 |
7503 |
|
4 |
How-to & Style |
2017 |
265 |
348 |
324 |
454 |
1428 |
1215 |
|
5 |
Music |
13974 |
2781 |
1450 |
1419 |
2039 |
9774 |
10485 |
|
6 |
Sports |
2821 |
433 |
447 |
420 |
557 |
1968 |
1817 |
|
7 |
News & Politics |
1559 |
303 |
284 |
276 |
352 |
980 |
923 |
|
8 |
Film & Animation |
4631 |
1143 |
367 |
361 |
717 |
3127 |
3547 |
|
9 |
Nonprofits & Activism |
130 |
20 |
21 |
23 |
24 |
87 |
85 |
|
10 |
UNA |
238 |
143 |
5 |
3 |
80 |
92 |
153 |
|
11 |
Travel & Events |
878 |
89 |
258 |
257 |
147 |
532 |
473 |
|
12 |
Autos & Vehicles |
686 |
102 |
144 |
136 |
174 |
448 |
368 |
|
13 |
Education |
532 |
58 |
138 |
137 |
112 |
337 |
282 |
|
14 |
Pets & Animals |
878 |
115 |
183 |
185 |
238 |
578 |
457 |
|
15 |
Gaming |
429 |
43 |
117 |
116 |
101 |
270 |
211 |
|
16 |
Science & Technology |
891 |
59 |
302 |
291 |
184 |
541 |
405 |
|
Total Instances |
47697 |
8912 |
6910 |
6684 |
9249 |
32101 |
31538 |
|
Table 5. Normal Distribution of Clusters
|
Sl.No |
Meta-objects |
Normal Distribution |
Cluster 0 |
Cluster 1 |
Cluster 2 |
|||
|
EM |
DB |
EM |
DB |
EM |
DB |
|||
|
1 |
Views |
Mean |
47837.34 |
13490.14 |
593.07 |
1699.48 |
3831.0 |
11040.85 |
|
Std Deviation |
81425.66 |
42531.37 |
868.42 |
9558.62 |
4816.6 |
37120.74 |
||
|
2 |
Rate |
Mean |
4.4 |
4.8 |
0 |
0.14 |
4.39 |
3.33 |
|
Std Deviation |
0.69 |
0.24 |
1.67 |
0.39 |
0.95 |
0.611 |
||
|
3 |
Ratings |
Mean |
85.94 |
26.63 |
0 |
0.85 |
7.8 |
15.34 |
|
Std Deviation |
140.37 |
76.35 |
67.18 |
7.18 |
7.6 |
50.54 |
||
|
4 |
Comments |
Mean |
77.14 |
21.69 |
0.52 |
1.53 |
6.16 |
18.69 |
|
Std Deviation |
152.63 |
76.41 |
1.05 |
9.5 |
7.10 |
74.14 |
||
The Table 4 and Table 5 represent cluster result obtained by the Expectation Maximization and Density Based Clustering approach. During the clustering process three cluster objects are automatically formed namely, Cluster 0, Cluster 1 and Cluster 2 and distribution of each category of all the formed clusters is shown in Figure 3. In the Figure 4, X-axis represents serial number of 16 different web video categories as listed in the Table 3. And Y-axis represents number of instances of respective web video categories. The properties of each clustered object are discussed as follows:
-
A) Cluster Analysis
The dataset contains ‘Music’, ‘Entertainment’, ‘and ‘Films and Animation’ category videos in large numbers. The ‘cluster 0’, ‘Cluster 1’, and ‘Cluster 2’ contains all 16 web video categories built by the EM and DB cluster models. The probability of ‘Cluster 2’ is found high as compared to the probability of ‘Cluster 0’ and ‘Cluster 1’.
The Fig. 5 shows normal distribution curves of each web video metadata object attributes (viz. ‘Comments’, ‘Rate’, ‘Ratings’, ‘Views’) in terms of standard deviation and mean. It is observed from the normal distribution curves that, the normal distribution is high in ‘Cluster 0’ whereas, the normal distribution is very low in ‘Cluster 1’ and is intermediate in ‘Cluster 2’.
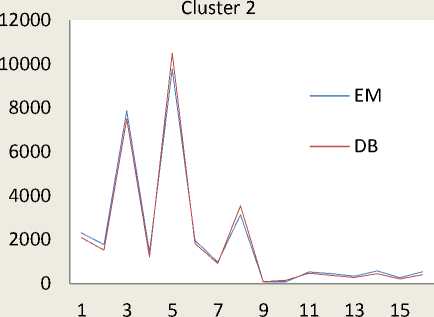
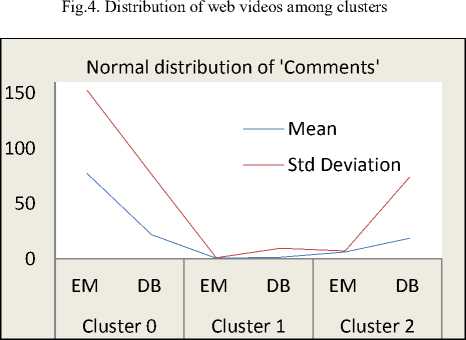
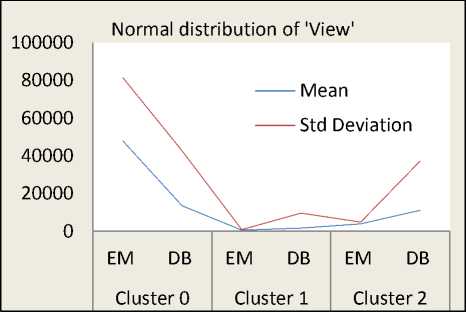
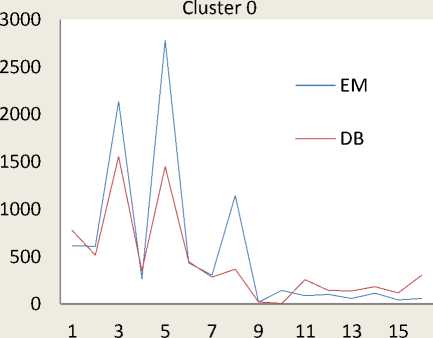
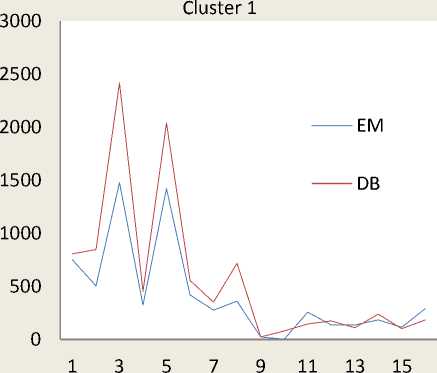
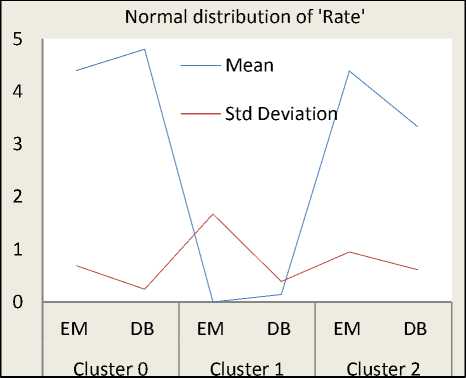
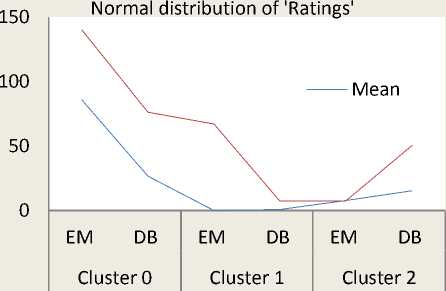
Fig.5. Normal Distribution of Metadata Attributes
From this fact, we explore that, most of the web videos which are having high view counts, high ratings, high rates, and large numbers of comments are found in ‘Cluster 0’.
Similarly, most of the web videos which are having less view counts, less ratings, less rates, and less numbers of comments are found in ‘Cluster 1’.
Also, most of the web videos which are having intermediate view counts, intermediate ratings, intermediate rates, and average numbers of comments are found in ‘Cluster 2’.
Hence, from this experimental results and analysis, the ‘Cluster 0’ is referred as ‘Popular Videos’, the ‘Cluster 1’ is referred as for ‘Non-Popular Videos’, and the ‘Cluster 2’ is referred as ‘Average-Popular Videos’. The Fig.6 shows the scatter plot – matrix of cluster assignments using web video meta-objects. In the Fig.6, the clusters with green color represents ‘Popular Videos’ (i.e. ‘Cluster 0’), the clusters with red color represents ‘Average Popular Videos’ (i.e. ‘Cluster 2’) and the cluster with black color represents ‘Non-Popular Videos’ (i.e. ‘Cluster 1’).
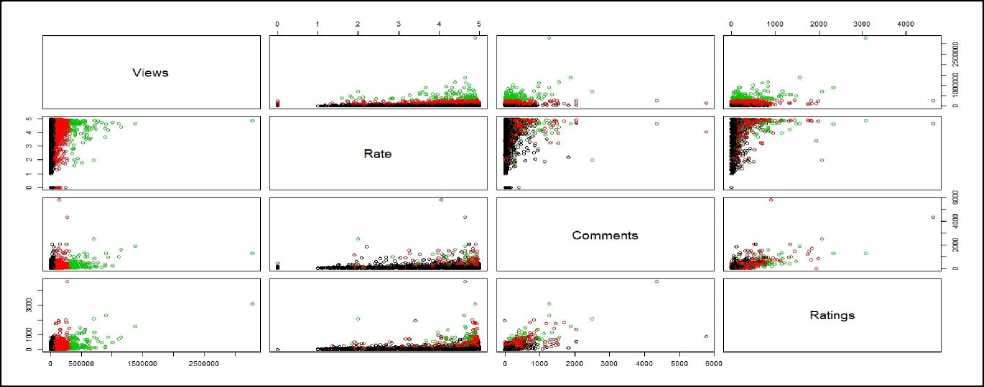
Fig.6. Visualization of cluster assignments of web videos using Meta-Objects
-
V. Conclusion and Future Work
In this work, effective attempts are made to cluster web videos based on meta-objects such as – category, view counts, length, number of comments, and rating information. The clusters are made to form automatically using unsupervised Expectation Maximization (EM) and Density Based (DB) clustering approach. Effective clustering models were built using EM and DB algorithms and applied on large scale web video metadata object dataset. Different clusters were formed according to the numeric values of the web video meta-objects. The each resultant clusters are analyzed in depth and normal distribution of each numerical metadata object within clusters are found. Also we found, Popular, Average Popular and Non-Popular web videos present in the clusters. The future work is to enhance this experiment to detect and extraction of outlier/abnormal web videos among large scale web video dataset.
Список литературы Web Video Object Mining: A Novel Approach for Knowledge Discovery
- Statistics of YouTube in official website: www.youtube.com
- Siddu P. Algur, Prashant Bhat, Suraj Jain, “Metadata Construction Model for Web Videos: A Domain Specific Approach”, International Journal of Engineering and Computer Science, December 2014.
- Siddu P. Algur, Prashant Bhat, “Metadata Based Classification and Analysis of Large Scale Web Videos”, International Journal of Emerging Trends and Technologies in Computer Science, May-June 2015
- Siddu P Algur, Prashant Bhat, “Web Video Object Mining: Expectation Maximization and Distribution Based Clustering of Web Video Metadata Objects”, International Journal of Information Engineering and Electronic Business, MECS Publishers Volume 8, N1, January 2016.
- Dataset for "Statistics and Social Network of YouTube Videos", Simon Fraser University: http://netsg.cs.sfu.ca/youtubedata/
- Siddu P. Algur, Prashant Bhat, Suraj Jain, “The Role of Metadata in Web Video Mining: Issues and Perspectives”, International Journal of Engineering Sciences & Research Technology, February-2015.
- Chirag Shah, Charles File, “Infoextractor – A Tool for Social Media Data Mining”, JITP 2011.
- Siddu P Algur, Prashant Bhat, “Web Video Mining: Metadata Predictive Analysis Using Classification Techniques”, International Journal of Information Technology and Computer Science, MECS publishers, [Accepted, September 2015].
- Renjie Zhou, Samamon Khemmarat, Lixin Gao, “The Impact of YouTube Recommendation System on Video”, ACM 978-1-4503-0057-5/10/11, November 2010.
- Jose San Pedro, Stefan Siersdorfer, and Mark S, “Content Redundancy in YouTube and its Application to Video Tagging, ACM Transactions, Online Reference: http://www.l3s.de/~siersdorfer/sources/2011/TOIS-2011-youtube%28pre-print%29.pdf
- C.F-Hsu, James C., and E.Khabiri, “Hierarchical Comment Based Clustering”, ACM 978-1-4503-0113-8/11/03, March 2011.
- Xu Cheng, Cameron Dale, and Jiangchuan Liu, “Understanding the Characteristics of Internet Short Video Sharing: YouTube as a Case Study”, arXiv:0707.3670v1 [cs.NI] 25 Jul 2007.
- C. Ramachandran, R.Malik, Xin Jin and Jing Gao “VideoMule: A Consensus Learning Approach to Multi-Label Classification from Noisy User-Generated Videos”, ACM, MM’09, October 19–24, 2009
- Alex Hindle, Jie Shao Dan Lin, Jiaheng Lu and Rui Zhang “Clustering Web Video Search Results based on Integration of Multiple Features”, World Wide Web, Springer, 2011.
- J.S.Pedro, Stefan Siersdorfer and Mark Sanderson, “Content Redundancy in YouTube and its Application to Video Tagging”, ACM Transactions on Information Systems, March 2011.
