Welfare of the population as an indicator of modernization potential of the territory

Author: Rossoshanskii Aleksandr Igorevich, Belekhova Galina Vadimovna
Journal: Economic and Social Changes: Facts, Trends, Forecast @volnc-esc-en
Section: Young researchers
Article in issue: 5 (35) т.7, 2014.
Free access
The article presents the results of a research into population's welfare as the basis of modernization processes. The authors carried out a comprehensive analysis of statistical and sociological data and highlighted the specifics of welfare in Russia and in the Vologda Oblast in terms of formation and use of money income; they also revealed the proportion of the population who are objectively ready to economic modernization. The authors revealed the emerging positive trends that show increasing involvement of the population in the savings-and-credit models. However, the scale of changes is not so great, and it covers only a small part of highly well-off population. In order to assess regional specifics, the authors grouped the RF subjects according to the level of income inequality of the population and other parameters of welfare that have an impact on the modernization potential of a territory. Judging by the indicators of the selected four groups of regions, the largest socio-economic potential of modernization is observed in the subjects with high income inequality...
Welfare of population, incomes and expenses, socio-economic inequality, modernization
Short address: https://sciup.org/147223652
IDR: 147223652 | UDC: 330.59(470.12) | DOI: 10.15838/esc/2014.5.35.22
Text of the scientific article Welfare of the population as an indicator of modernization potential of the territory
Modernization is сurrently becoming a high priority for those countries and regions that seek to enhance their economic development, because it is widely recognized that improvement, progress and innovation are important driving forces of growth. That is why Russia also considers economic modernization as a priority. At that, many research works aim to assess the degree of readiness of the Russian population to modernization. The diversity of approaches in these studies is determined by ultimate goals and by the data used. For example, E.M. Avramova [1] indicates that the conclusion concerning the readiness of a society for modernization can be made on the basis of the information about the presence of a mass layer with a relatively high level of financial welfare. M.K. Gorshkov [5], using the results of a public opinion monitoring, shows the influence of social inequality on the system modernization of economy; this influence, in his opinion, is manifested in the establishment of a sustainable “culture of inequality”, in the increase of apathy and civic passivity in certain strata of the population, in the development of confrontation, intolerance, and political extremism. N.E. Tikhonova [13], on the basis of the allocation of normative and moral systems of the population concerning the basic principles of relations in the system “individual–society–state”, distinguishes the modernist-oriented groups, which are then evaluated from the viewpoint of the potential contribution of each group to modernization processes. The ambiguity of these findings, as well as the difference in researchers’ estimates with regard to the readiness of the Russian society for modernization has determined the need for consideration of this matter.
In a broad sense, the goal of modernization is to build a strong country in economic, political, military, scientific, and other spheres along with the growth of people’s welfare [10] that is a necessary condition for the formation of modernization potential and a result of progressive transformations. Therefore, the growth of welfare can be considered one of the main criteria for allocating the part of the population that is willing to get involved in the implementation of modernization processes.
In the last few years there was much talk about the sustained growth of people’s incomes and the expansion of their financial opportunities. It is associated with implementation of modernization-oriented government programs. However, the situation is not so simple, and it is proved by the analysis of the level, structure and distribution of money incomes.
Indeed, in 2000–2012 the average per capita incomes in Russia increased considerably (tab. 1). For instance, in 2012 in the Vologda Oblast they amounted to 18125 rubles, which is 2.6 times higher (in comparable prices) than the same indicator at beginning of the period under consideration. The 2.9-fold growth is observed in Russia as a whole. Such dynamics results from a continuous wage increase (especially in public sector employees) and a significant improvement of pensions provision beginning from 2008.
The growth of incomes is also confirmed by the data of sociological surveys carried out in the Vologda Oblast1 (tab. 2) . There is an increase in the share of the population that can be characterized as wealthy and rich according to the assessment of their incomes; and the share of those characterized as extremely poor and poor is reducing. These trends were particularly pronounced in 2004–2008. For example, the share of the “extremely poor” and the “poor” decreased
Table 1. Dynamics of incomes in the Russian Federation and in the Vologda Oblast in 2000–2012*
|
Indicators |
2000 |
2005 |
2007 |
2008 |
2009 |
2010 |
2011 |
2012 |
2012 to 2000, times |
|
Russian Federation |
|||||||||
|
Average per capita money income, rubles |
7991 |
15005 |
19109 |
20259 |
20775 |
20978 |
22061 |
23058 |
2.89 |
|
Average monthly accrued wages, rubles |
7787 |
15824 |
20614 |
23056 |
22929 |
23963 |
25250 |
26629 |
3.42 |
|
Average monthly accrued pensions, rubles |
2431 |
4373 |
4725 |
6085 |
6386 |
8453 |
8742 |
9154 |
3.77 |
|
R/P 10% ratio, times |
13.9 |
15.2 |
16.8 |
16.6 |
16.6 |
16.6 |
16.2 |
16.4 |
– |
|
Gini Coefficient |
0.395 |
0.409 |
0.422 |
0.421 |
0.421 |
0.421 |
0.417 |
0.420 |
– |
|
Vologda Oblast |
|||||||||
|
Average per capita money income, rubles |
6856 |
12077 |
15741 |
15995 |
14849 |
15597 |
16397 |
18125 |
2.64 |
|
Average monthly accrued wages, rubles |
8683 |
16289 |
19362 |
20608 |
20270 |
20770 |
21467 |
22649 |
2.61 |
|
Average monthly accrued pensions, rubles |
2966 |
4820 |
5643 |
6098 |
7706 |
8751 |
9018 |
9414 |
3.17 |
|
R/P 10% ratio, times |
8 |
8.7 |
12.6 |
12.5 |
11.5 |
11.7 |
11.4 |
12.0 |
– |
|
Gini Coefficient |
0.318 |
0.329 |
0.383 |
0.382 |
0.370 |
0.373 |
0.369 |
0.376 |
– |
* Population incomes are given in comparable prices of 2012.
Source: Rossiiskii statisticheskii ezhegodnik: stat. sbornik [Russian Statistical Yearbook: Statistical Collection]. Rosstat. Moscow, 2013. 717 p.
Table 2. Distribution of the Vologda Oblast population according to the assessment of personal income in 2000-2013, (as a percentage of the total number of respondents)
|
Year |
Population groups according to the assessment of personal income |
||||
|
Extremely poor |
Poor |
Needy |
Well-off |
Rich |
|
|
2000 |
16.0 |
46.8 |
31.5 |
4.2 |
1.4 |
|
2001 |
14.3 |
44.8 |
32.7 |
6.1 |
2.1 |
|
2002 |
13.0 |
41.6 |
36.0 |
6.3 |
3.1 |
|
2003 |
12.8 |
39.5 |
37.3 |
7.9 |
2.5 |
|
2004 |
10.0 |
37.3 |
43.2 |
7.1 |
2.4 |
|
2005 |
6.5 |
35.5 |
47.8 |
8.8 |
1.4 |
|
2006 |
4.4 |
35.3 |
49.1 |
9.6 |
1.6 |
|
2007 |
4.9 |
31.3 |
51.0 |
10.8 |
2.1 |
|
2008 |
3.2 |
27.2 |
58.2 |
9.1 |
2.3 |
|
2009 |
6.2 |
33.7 |
51.9 |
7.1 |
1.1 |
|
2010 |
5.5 |
30.3 |
54.1 |
8.6 |
1.5 |
|
2011 |
4.5 |
29.4 |
53.9 |
10.5 |
1.7 |
|
2012 |
3.7 |
28.8 |
55.9 |
10.2 |
1.5 |
|
2013 |
4.9 |
27.5 |
55.2 |
11 |
1.4 |
|
2013 to 2000, times* |
-3.27 |
-1.7 |
1.75 |
2.62 |
1 |
* Increment (+), decline (-).
Source: sociological surveys of the Vologda Oblast population, conducted by ISEDT RAS in 2000–2013.
by more than 1.5 times (with a considerable 3% decline in the share of the “poor”, reaching in 2008 the minimum value for the entire observational period). The “needy” has become the dominant group by 2013 (55% versus 31.5% in 2000). The share of the “well-off” has amounted to 11% of the oblast population – vs. 4%, respectively. The “extremely poor” and the “poor” made up one third (against 63% in 2000), while the share of “rich” citizens after minor fluctuation has established itself at the level of 20002 (1.4%).
Stabilization of the socio-economic situation and growth of income had a positive impact on the social mood of the population : according to the monitoring conducted by ISEDT RAS, it can be said that the Vologda Oblast residents have normal, stable condition (69% in 2013, against 29% in 1998), and they do not feel stress, anger, fear and depression, as in the late 1990s (26.5% against 64%, respectively; fig. 1 ). However, this positive trend in social mood is characteristic only for the averaged data on population. The assessment of the emotional state of the
Figure 1. Dynamics of the psychological condition of the poorest residents of the Vologda Oblast in 1998–2013, (as a percentage of the total number of respondents)
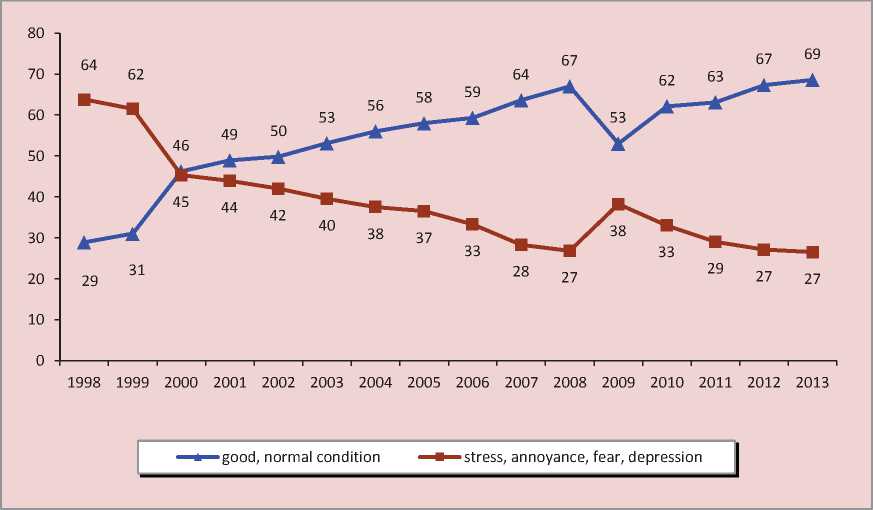
Source: ISEDT RAS public opinion monitoring, 1998–2013.
region’s residents in terms of income groups shows that positive judgments on the part of the poorest groups of citizens began to appear somewhat later (since 2005, whereas in the group of the most well-off – since 1999), they were less common (on average 41% vs. 69% among the most well-off) and lasted for a relatively short time, having settled in 2013 at the level of average values of 2000 (45%; fig. 2 and 3 ).
In addition, despite the positive dynamics of the average level of money incomes, it can be noted that social polarization and differentiation, resulting from accelerated growth of the highest incomes, have not decreased, but they continue to grow, as evidenced by constant upward dynamics of the Gini coefficient and the ratio of the average income of the richest 10% to the poorest 10% (see tab. 1).
Earned incomes, i.e. wages and entrepreneurial income, constitute the basis of money receipts in Russia, as well as in all industrialized countries. The key role here belongs to labor remuneration: according to official statistics its share in in the structure of incomes of the Vologda Oblast residents in the last decade is about 50%, although it is gradually reduced (52% in 2000, 47% in 2012, tab. 3 )3.
Figure 2. Dynamics of the psychological condition of 20% of the poorest residents of the Vologda Oblast in 1998–2013, (as a percentage of the total number of respondents)
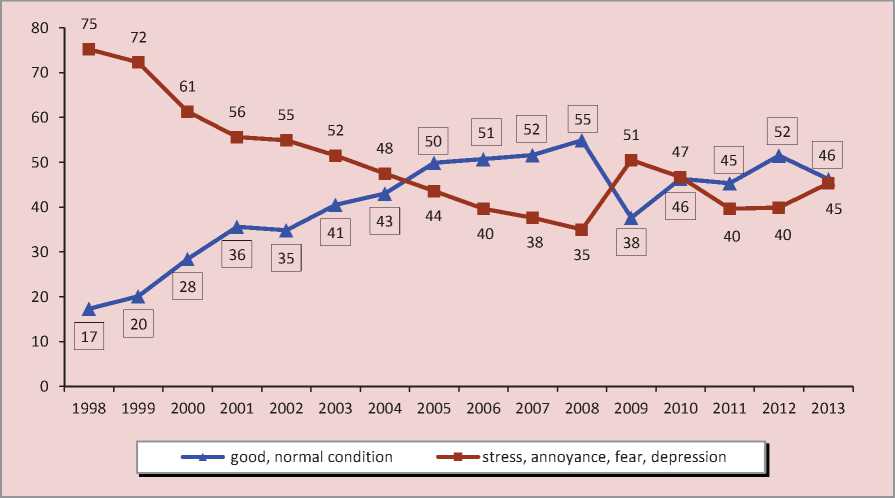
Note. The data on the option “good, normal condition” are framed. Source: ISEDT RAS public opinion monitoring, 1998–2013.
Figure 3. Dynamics of the psychological condition of 20% of the most well-off residents of the Vologda Oblast in 1998–2013, (as a percentage of the total number of respondents)
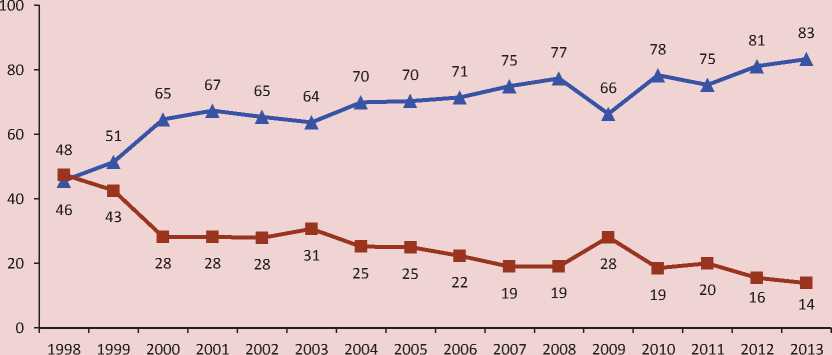
* good, normal condition —^—stress, annoyance, fear, depression
Source: ISEDT RAS public opinion monitoring, 1998–2013.
Table 3. Structure of incomes of the Vologda Oblast population in 2000–2012
|
Income sources |
2000 |
2005 |
2007 |
2008 |
2009 |
2010 |
2011 |
2012 |
|
Incomes |
100 |
100 |
100 |
100 |
100 |
100 |
100 |
100 |
|
Including: |
||||||||
|
labor remuneration |
52.1 |
55.7 |
49.2 |
52.8 |
49.7 |
48.0 |
48.6 |
47.1 |
|
income of workers and employees of enterprises and organizations (excluding labor remuneration) |
2.5 |
1.6 |
1.7 |
1.7 |
1.6 |
1.5 |
1.8 |
1.9 |
|
from entrepreneurial activity |
10.1 |
10.1 |
8.8 |
10.0 |
11.5 |
10.9 |
10.6 |
9.3 |
|
social payments |
14.8 |
17.7 |
15.4 |
17.3 |
21.3 |
24.7 |
24.7 |
24.9 |
|
from property |
4.3 |
6.0 |
4.9 |
3.9 |
3.1 |
3.3 |
3.1 |
4.0 |
|
from sales of currency |
2.3 |
1.4 |
0.8 |
0.7 |
1.5 |
1.0 |
0.7 |
0.6 |
|
other income |
13.9 |
7.5 |
19.2 |
13.6 |
11.3 |
9.6 |
10.5 |
12.2 |
|
Source: Statisticheskii ezhegodnik Vologodskoi oblasti: stat. sbornik [Statistical Yearbook of the Vologda Oblast: Statistical Collection]. Vologdastat. Moscow, 2013. 371 p. |
||||||||
We should point out a significant increase in the contribution of social transfers in total money receipts of the population. Their share has been significantly increasing since 2008 (17.3%), reaching in 2012 a quarter of the total income. This stems from the fact that the increase of social payments was an attempt of the Russian Government to equalize income security at different stages of the life cycle of households. Moreover, the volume of social payments was increasing due to both social benefits and pensions.
However, as evidenced by the replacement rate, the amount of retirement benefits is small and it still does not provide adequate replacement of wages; and this is one of the barriers to modernization. In Russia, the replacement rate is defined as the ratio of average retirement pension to average monthly wage; in international practice – as the ratio of pensions to pre-retirement wages. It should be noted that neither of the two indicators provides a full description of the situation: the former says nothing about the differentiation of pensions or their relationship to wages and experience, and the latter does not take into account the change in pensions after their initial establishment. The International Labor Organization (ILO) proposes to consider 40% of the lost earnings as the target value for establishing the old-age pension. But this standard, adopted in 1952 in a completely different socio-economic situation, has lost its relevance, as evidenced by international comparison (tab. 4).
The average replacement rate for the member-states of the Organization for Economic Cooperation and Development (OECD) is 58%. Its value varies significantly even among the developed countries of the OECD. The maximum replacement rates are often observed in the countries with incomes below average, and the lowest replacement rates – in the wealthiest countries. For example, in Greece the figure is 1.5 times higher than in the UK, Japan or the U.S. (excluding voluntary insurance) [4].
Table 4. Replacement rates in different countries in 2013
Country Rate, % Country Rate, % Netherlands 91.4 Canada 51.0 Israel 86.7 (76.8)* New Zealand 50.1 Denmark 83.7 Poland 48.8 Austria 76.6 Chile 45.5 (36.6) Spain 73.9 Mexico 44.7 Iceland 73.8 Ireland 44.2 Hungary 73.6 Korea 43.9 Italy 71.2 Germany 42.0 Slovak Republic 67.9 Belgium 41.4 Turkey 66.8 USA 41.0 Greece 64.0 Slovenia 40.6 Australia 60.2 (55.8) UK 37.9 Czech Republic 59.9 Japan 37.5 Luxembourg 59.3 On average across OECD 57.9 (57.2) France 59.1 Saudi Arabia 100 (87.5) Switzerland 58.4 (57.6) Argentina 96.2 (88.9) Sweden 55.6 China 82.5 (65.1) Estonia 55.3 India 60.4 (56.3) Portugal 55.0 Brazil 57.5 (52.3) Finland 54.8 Indonesia 14.1 (13) Norway 52.3 Republic of South Africa 11.8 * 86.7 (76.8) – in men and in women, respectively. Source: Pensions at a Glance 2013: Retirement-Income Systems in OECD and G20 Countries. Available at:
The ratio between the average pensions and wages in Russia exceeded 35% for the first time in 2010, but in the end of 2012 it was 34%. The replacement rate is somewhat higher in the Vologda Oblast than in the country as a whole, and it was 43% in 2012 (fig. 4) .
However, the achieved level of the indicator is still lower than that in many other countries. For example, developed countries (Germany, Belgium), where the replacement rate for “mandatory’ pensions is relatively low compared to that in Russia, as a rule, have a widespread system of voluntary pension insurance, which provides a high overall level of pension payments. The full replacement ratio (including voluntary schemes) is comparable with the Russian only in few countries (Mexico, South Korea, Japan).
At present, only a small number of Russian citizens uses additional pension provision, that is why it is possible to predict the preservation of the relatively low level of old-age pensions compared with that in other countries, and a likely reduction of financial capabilities of elderly people.
Figure 4. Dynamics of the replacement rate in the Russian Federation and in the Vologda Oblast in 2000–2012
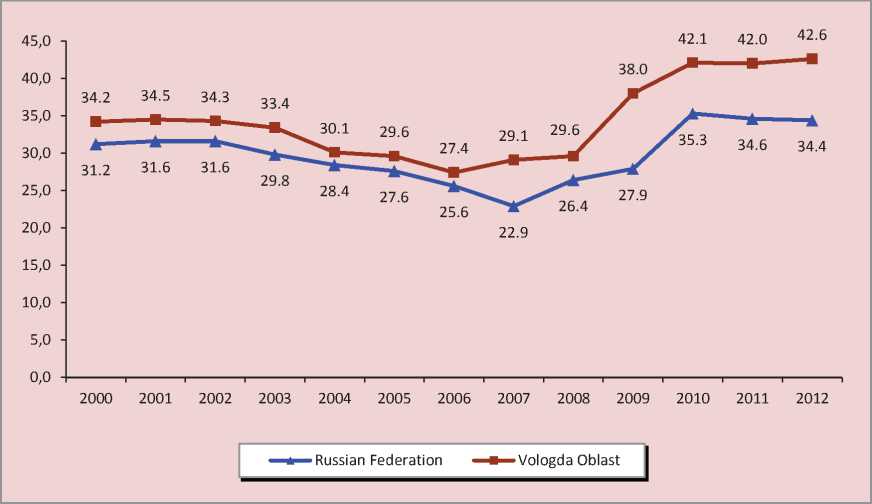
Source: Rossiiskii statisticheskii ezhegodnik: stat. sbornik [Russian Statistical Yearbook: Statistical Collection]. Rosstat. Moscow, 2013. 717 p.
An important indicator of modernization success is the share of entrepreneurial income in the population’s total income structure. Development of entrepreneurship is considered by most experts as a driving force of modernization. However, during the period of the most rapid economic growth the role of this type of incomes declined slightly, and now their share is a little more than 9% (nationwide and in the Vologda Oblast).
According to ISEDT RAS polls, the proportion of the Vologda Oblast population engaged in entrepreneurship as their main type of activity is not more than 6%. In this case, first, the majority is engaged in entrepreneurship through the exploitation of personal subsidiary plots (PSP); and second, the representatives of the high-income group do not obtain income from the sales of agricultural products. Here it should be emphasized that the PSP is not a sign of modernization and development.
The readiness of the population to modernization processes can be estimated by the share of property income. According to Rosstat, property incomes and financial assets in Russia as a whole make up only 5–10% of the total income of the population, and they are even lower in the Vologda Oblast. Moreover, if we look at the dynamics of this indicator, it declined to 4% in 2012 (see tab. 3).
Thus, income generation based on new principles different from those that were used in the Soviet period is characteristic only for
3–5% of the oblast population (in Russia – about 8%). At the same time, 20–25% of the population in developed countries consider property and entrepreneurship incomes to be important sources of their earnings [12]. Taking into account the fact that in the postperestroika years the total share of these types of income reached 20–23% (for example, 22.9% in Russia and 20.4% in the Vologda Oblast in 1995), we can talk about the possible potential for increasing the contribution of these types of income in the total income structure of Russia’s population. Although in recent years our country has not experienced any institutional or economic changes that would enhance these figures.
Another prerequisite for the success of modernization consists in extensive involvement of the population in the processes of investing and lending . The citizen’s savings traditionally serve as a source of domestic investment in the national economy, therefore they can be considered a resource for economic development. The people use bank deposits and other savings instruments more actively, which indicates the growing trust of the population in the institutions of the financial sector and in the state as a whole, which, in turn, favors the orientation of the economy on the “long” money and transition to the innovation type of development.
The social role of savings is significant as well: it implies a “margin of safety” in a crisis situation, and a support fund for implementing long-term economic strategies associated with investments in education, health, and ultimately, in the development of human potential. Credit behavior, along with the savings behavior, influences the volume of domestic demand and boosts economic activity. That is, the more complex and diverse the practices of financial behavior of the population, the greater their positive impact on the economy and social sphere [7].
Savings amount to about 5–6% in the expenditure pattern of the Vologda Oblast population during the twelve-year period under consideration. In comparison with the early 2000s there has been an increase in the share of compulsory payments and contributions, which include loan payments. The share of expenditures on the purchase of real estate has increased significantly: from 0.7% in 2000 to 2.6% in 2012.
According to ISEDT RAS polls, the involvement of the population in savings and lending stabilized at the level of 20–30% after a significant increase in 2001–2004: 24% of the oblast residents had savings in 2013, and nearly 30% used bank loans [3]. However, it should be noted that the majority of households do not have savings and loans, or they implement the simplest forms of savings and lending behavior. Similar trends in financial behavior are observed in Russia as a whole [1].
The involvement of the population in more complex forms of financial behavior is limited by their financial status. The positive dynamics of incomes since the early 2000s is leveled by insignificant reduction in the population inequality according to their financial status. As can be seen from figure 5 , for more than a decade the incomes of the least wealthy part of the population in the Vologda Oblast and nationwide remained at an almost unchanged level, compared to the subsistence level, which amounted to 80–90% of its value.
Figure 5. Ratio of average per capita money income to the subsistence level in different income groups in 2000–2012, times*
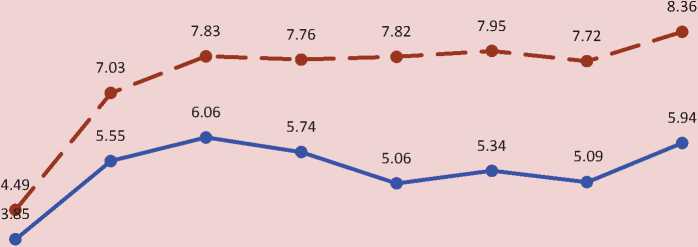
0.84 0.76 0.80 0.77 0.73 0.77 0.750.84
£-=-~—Ь——4г——^+-—-~-=Ь=-=-=-^-=-=-*Ь-а-~-~±
0.57 0.79 0.84 0.83 0.83 0.87 0.85
2000 2006 2007 2008 2009 2010 20112012
■=2^= 20% of the least well-off population in the Vologda Oblast
^^•— 20% of the most well-off population in the Vologda Oblast
— ^ 20% of the least well-off population in the Russian Federation
—^ — 20% of the most well-off population in the Russian Federation
The regional specifics according to the above parameters of well-being that influence the success of modernization process was assessed with the use of the correlation and regression analysis; after that a group of RF subjects was defined according to the degree of income inequality of the population. All the cost parameters of the regions were made suitable for comparison with the help of the indicator of the cost of a fixed set of goods and services.
The relation between the indicators is described by the following multiple regression equation:
y = 6,84+0,0003178 x1 –0,00000000008214 x2 + +0,001865 x3 +0,000319 x4 –0,00000000000004839 x5
F = 19,893; P < 0,00000
R = 0,757; R2 = 0,573
where y is the ratio of the average income of the richest 10% to the poorest 10% (R/P 10% ratio), times;
x1 is the average monthly nominal accrued wages, rubles;
x2 is the average amount of pensions, rubles;
x3 is the share of business income in the total income of the population, %;
x4 is the share of property income in the total income of the population, %;
x5 is the average size of deposit of individuals on ruble accounts in the Savings Bank of the Russian Federation, rubles.
The paired correlation coefficients did not exceed the value of 0.8, i.e. the factor characteristics were selected correctly and there is no close correlation between them. The value of the multiple determination coefficient R2 = 0.573 indicates that a change of the R/P 10% ratio by 57.3% is caused by the influence of the changes in the levels of the factors included in the equation and, respectively, the 42.7% change is caused by the impact of changes of other factors.
Four distinct groups of regions were defined on the basis of the values of R/P 10% ratio. The distribution was based on international values of R/P 10% ratio in such a way that the first three groups were comparable with the threshold values of the ratio in OECD countries (such as the UK – 13.8 times, the USA – 15 times), and the fourth group – with Latin American countries (R/P 10% ratio is at the level of 18 or more times).
In general, we can see a similar trend for all the groups: when R/P 10% ratio increases from group to group, the level of incomes increases, as well as the amount of deposits in the savings bank. However, there are some differences (tab. 5) .
Describing the first group, we emphasize that the values of selected indicators are below the national average, except for the share of entrepreneurial incomes and pensions. The regions of this group include mostly underdeveloped and depressed areas, such as the Republic of Ingushetia and the Republic of North Ossetia-Alania, in which GDP per capita is at the level of third world countries. It is noteworthy that the Vologda Oblast is also in this group. Despite the fact that the indicators of the people’s income differentiation for more than a ten-year period are significantly below the national average, the wages in the region do not reach the national level. However, it should be noted that the financial crisis has had a negative effect on the oblast and changed its status from a donor region to a recipient region [9].
The second group consists of relatively developed subjects: the territories with few settlements and with export-resource orientation, and the so-called agrarian regions. The values of indicators characterizing the standard of living are somewhat higher in this group, but they are levelled by the increase in the financial inequality of the population.
The third group represents more urbanized regions of the Center, North-West, Urals and Siberia. This group also includes the Republic of Dagestan, in which high income differentiation is provided by a high share of social transfers to the population.
The fourth group of subjects, which are characterized by the highest level of inequality (these include the cities of Moscow and Saint Petersburg, the Samara and Tyumen oblasts), also has its distinctive features.
Table 5. Groups of the RF subjects according to the degree of inequality of the population*
|
RF subjects |
Characteristics of the regions |
2007 |
2012 |
|
First group (28 subjects) |
|||
|
Tver Oblast (11.2), Volgograd Oblast, Kostroma Oblast, Altai Republic, Republic of Karelia, Ivanovo Oblast, Vladimir oblast, Karachay–Cherkess Republic, Tyva Republic, Altai Krai, Vologda Oblast, Republic of Mordovia, Kirov Oblast, Republic of Ingushetia, Chuvash Republic, Pskov Oblast, Jewish Autonomous Oblast, Smolensk Oblast, Republic of North Ossetia-Alania, Saratov Oblast, Kamchatka Krai, Ryazan Oblast, Udmurt Republic, Republic of Kalmykia, Kabardino-Balkar Republic, Republic of Khakassia, Tula Oblast, Leningrad Oblast (12.9) |
R/P 10% ratio, times |
11.2 |
12.1 |
|
Average monthly wages, rubles |
10743 |
20376 |
|
|
Average monthly pensions, rubles |
3871 |
9215 |
|
|
Share of income from entrepreneurship, % |
11.8 |
10.1 |
|
|
Share of property income, % |
4.0 |
2.5 |
|
|
Average value of deposits of physical persons in the savings bank of the Russian Federation, rubles |
4521 |
9520 |
|
|
Second group (29 subjects) |
|||
|
Stavropol Krai (13.1), Penza Oblast, Khabarovsk Krai, Arkhangelsk Oblast, Mari El Republic, Amur Oblast, Orenburg Oblast, Tomsk Oblast, Primorsky Krai, Yaroslavl Oblast, Kaliningrad Oblast, Chechen Republic, Ulyanovsk Oblast, Kursk Oblast, Murmansk Oblast, Bryansk Oblast, Lipetsk Oblast, Republic of Adygea, Rostov Oblast, Kurgan Oblast, Chelyabinsk Oblast, Kaluga Oblast, Orel Oblast, Zabaykalsky Krai, Astrakhan Oblast, Nizhny Novgorod Oblast, Republic of Sakha (Yakutia), Voronezh Oblast, Kemerovo Oblast (14.9) |
R/P 10% ratio, times |
13.9 |
13.8 |
|
Average monthly wages, rubles |
12242 |
22804 |
|
|
Average monthly pensions, rubles |
3782 |
9454 |
|
|
Share of income from entrepreneurship, % |
11.2 |
9.8 |
|
|
Share of property income, % |
5.2 |
2.7 |
|
|
Average value of deposits of physical persons in the savings bank of the Russian Federation, rubles |
4768 |
11276 |
|
|
Third group (19 subjects) |
|||
|
Novgorod Oblast (15), Republic of Dagestan Republic of Buryatia, Belgorod Oblast, Sakhalin Oblast, Tambov Oblast, Novosibirsk Oblast, Irkutsk Oblast, Magadan Oblast, Chukotka Autonomous Okrug, Moscow Oblast, Krasnodar Krai, Omsk Oblast, Republic of Komi, Republic of Tatarstan, Krasnoyarsk Krai, Republic of Bashkortostan, Perm Krai, Sverdlovsk Oblast (17.7) |
R/P 10% ratio, times |
16.0 |
16.2 |
|
Average monthly wages, rubles |
13107 |
25354 |
|
|
Average monthly pensions, rubles |
3883 |
9333 |
|
|
Share of income from entrepreneurship, % |
11.8 |
9.8 |
|
|
Share of property income, % |
4.8 |
2.9 |
|
|
Average value of deposits of physical persons in the savings bank of the Russian Federation, rubles |
5014 |
11045 |
|
|
Fourth group (4 subjects) |
|||
|
Saint Petersburg (19.5), Samara Oblast, Tyumen Oblast, Moscow (27.3) |
R/P 10% ratio, times |
22.9 |
21.6 |
|
Average monthly wages, rubles |
15445 |
31759 |
|
|
Average monthly pensions, rubles |
3577 |
8932 |
|
|
Share of income from entrepreneurship, % |
8.6 |
5 |
|
|
Share of property income, % |
8.2 |
7.2 |
|
|
Average value of deposits of physical persons in the savings bank of the Russian Federation, rubles |
7268 |
16776 |
|
|
* Regions are ranked according to R/P 10% ratio for 2012. Compiled according to: Regiony Rossii. Sotsial’no-ekonomicheskie pokazateli: stat. sbornik [Regions of Russia. Socio-Economic Indicators: Statistical Collection]. Rosstat. Moscow, 2013. 990 p. |
|||
The first one is the high values of average monthly wages and bank deposits (the values for this group exceed those in the adjacent, third, group in 1.2 and 1.5 times, respectively). The second feature is the low share of entrepreneurial income in the income structure of the population. The third feature is the important role of property income (7.7% versus 2.8–3.7% in other groups).
It should be noted that according to ISEDT RAS research findings [6] the subjects included in the third and fourth groups mostly have the greatest socio-economic potential for modernization, and it reflects the extent, to which the regional industrial relations, development priorities and social programs are aimed at solving modernization issues.
Thus, the welfare indicators objectively show the modernization potential of a territory. On the one hand, the active introduction and implementation of innovation in all spheres of public life, requiring approp-riate training and initiative of employees, is certainly accompanied by the growth of financial well-being (both due to increase in wages, and more extensive social support).
However, on the other hand, production processes and relationship models that are becoming complex make new demands on human capital and create new differentiation factors, increasing the socio-economic polarization of the population. There are still insufficient values of the indicators that are considered important in the formation of a layer of people who not only understand the necessity of modernization, but are active agents of progressive ideas and behavior. For example, in the Vologda Oblast the total share of well-off and reach individuals according to the assessment of their own revenue is 12.4%, the income from entrepreneurial activity is typical only for 2.7% of the population, the income from property – for 1.9%.
Russian researchers, who study similar issues, come to various conclusions. For instance, E.M. Avraamova notes that the recent small increase in financial well-being of the population is not accompanied by the expansion of socio-economic opportunities. In her opinion, the current socio-economic situation “is ...latently unstable and does not have an explicit public incentive to modernization” [1]. M.K. Gorshkov notes that “social inequality create an environment for confrontation and intolerance; they prevent the achievement of national harmony, generating a wide gap between the society and the authorities”, thereby slowing down the system modernization, economic development, and blocking its transition to the innovation stage [5].
Therefore, a policy aimed to improve the welfare and economic and civic activity of the population, cannot be based only on the growth of wages in certain spheres and on the increase of social transfers. The more so, the current system of distribution relations does not provide for the allocation of any reserves for the implementation of the above actions; it also does not contribute to the reduction of socio-economic inequalities, and enhances the existing disparities (which is indicated by the calculation results obtained with the use of the multiple regression equation).
Therefore, in order to promote continuous and consistent modernization in Russia’s regions, it is necessary to develop a clear public standing and forward-looking policy that takes into account the interests of production and innovation, aims to improve the quality of life, enhance economic activity of the population (also in science-intensive and budget sectors); all this would contribute to the full implementation of the country’s modernization potential.
Cited works
-
1. Avraamova E.M. The Growth of Financial Welfare of the Population: due to What and with What Consequences? Social Sciences and Modernity , 2013, no.1, pp. 5-15.
-
2. Ageeva S.D. Disparities in the Resource Economies of a Federative Type. Region: Economics and Sociology , 2013, no.2(78), pp. 66-88.
-
3. Belekhova G.V. Borrower Behavior of the Population: Modern Aspects (Case Study of the Vologda Oblast). Territorial Development Issues , 2014, no.1(11). Available at: ction=view&file=article&aid=3490
-
4. Butov V.I., Ignatov V.G., Ketova N.P. The Essentials of Regional Economics: Textbook . Rostov-on-Don: Mart, 2000. 448 p.
-
5. Gorshkov M.K. Socio-Political Dimension of the Modernization of Russian Society. Humanitarians of the South of Russia , 2012, no.1, pp. 23-32.
-
6. Gulin K.A. On the Issue of Socio-Economic Modernization of Russian Regions. Economic and Social Changes: Facts, Trends, Forecast , 2012, no.4, pp. 42-58.
-
7. Report on Human Development in the Russian Federation for 2011 . Ed.by A.A. Auzan and S.N. Bobylev. Moscow: PROON v RF, 2011. 146 p.
-
8. Zarubina N.N. Human Resources of the Russian Modernization: towards a New Research Paradigm. Herald of MGIMO-University , 2010, no.6(15), pp. 7-14.
-
9. Kostyleva L.V. Inequality of the Population of Russia: Trends, Factors, and Regulation: Monograph . Under the supervision of V.A. Ilyin, Doctor of Economics, Professor. Vologda : ISERT RAN, 2011. 223 p.
-
10. Modernization of Russia: Conditions, Prerequisites, Chances: a Collection of Articles and Materials . Issue 2. Ed. by V.L. Inozemtsev. Moscow: Tsentr issledovanii postindustrial’nogo obshchestva, 2009. 272 p.
-
11. Shabunova A.A., Gulin K.A., Lastochkina M.A., Solov’eva T.S.. Modernization of the Region’s Economy: SocioCultural Aspects: Monograph . Vologda: ISERT RAN, 2012. 158 p.
-
12. Ovcharova L.N., Pishnyak A.I., Popova D.O. Changes in Income and Consumption of Households in Russia: from Poverty to the Middle Class. SPERO , 2013, no.18, pp. 7-36.
-
13. Tikhonova N.E. Human Potential of the Russian Modernists and Prospects for Modernization in Russia. Terra Economicus, 2012, vol. 10, no. 1, pp. 135-146.
-
14. Shabunova A.A., Rossoshanskii A.I. Standard of Living of the Population as an Indicator of Modernization Processes. In the World of Scientific Discoveries , 2013, no.12.1(48), pp. 127-150.
References Welfare of the population as an indicator of modernization potential of the territory
- Rossiiskii statisticheskii ezhegodnik: stat. sbornik . Rosstat. Moscow, 2013. 717 p.
- Pensions at a Glance 2013: Retirement-Income Systems in OECD and G20 Countries. Available at: http://www.oecd.org/pensions/pensionsataglance.htm
- Regiony Rossii. Sotsial'no-ekonomicheskie pokazateli: stat. sbornik . Rosstat. Moscow, 2013. 990 p.
- Avraamova E.M. Rost material'noi obespechennosti naseleniya: blagodarya chemu i s kakimi posledstviyami? . Obshchestvennye nauki i sovremennost' , 2013, no.1, pp. 5-15.
- Ageeva S.D. Neravenstvo v resursnykh ekonomikakh federativnogo tipa . Region: ekonomika i sotsiologiya , 2013, no.2(78), pp. 66-88.
- Belekhova G.V. Kreditnoe povedenie naseleniya: sovremennye aspekty (na primere Vologodskoi oblasti) . Voprosy territorial'nogo razvitiya , 2014, no.1(11). Available at: http://vtr.isert-ran.ru/file.php?module=Articles&action=view&file=article&aid=3490
- Butov V.I., Ignatov V.G., Ketova N.P. Osnovy regional'noi ekonomiki: ucheb. posobie . Rostov-on-Don: Mart, 2000. 448 p.
- Gorshkov M.K. Sotsial'no-politicheskoe izmerenie modernizatsii rossiiskogo obshchestva . Gumanitarii Yuga Rossii , 2012, no.1, pp. 23-32.
- Gulin K.A. K voprosu o sotsial'no-ekonomicheskoi modernizatsii rossiiskikh regionov . Ekonomicheskie i sotsial'nye peremeny: fakty, tendentsii, prognoz , 2012, no.4, pp. 42-58.
- Doklad o razvitii chelovecheskogo potentsiala v Rossiiskoi Federatsii za 2011 g. . Ed.by A.A. Auzan and S.N. Bobylev. Moscow: PROON v RF, 2011. 146 p.
- Zarubina N.N. Chelovecheskie resursy rossiiskoi modernizatsii: k novoi paradigme issledovaniya . Vestnik MGIMO-Universiteta , 2010, no.6(15), pp. 7-14.
- Kostyleva L.V. Neravenstvo naseleniya Rossii: tendentsii, faktory, regulirovanie: monografiya . Under the supervision of V.A. Ilyin, Doctor of Economics, Professor. Vologda: ISERT RAN, 2011. 223 p.
- Modernizatsiya Rossii: usloviya, predposylki, shansy: sbornik statei i materialov . Issue 2. Ed. by V.L. Inozemtsev. Moscow: Tsentr issledovanii postindustrial'nogo obshchestva, 2009. 272 p.
- Shabunova A.A., Gulin K.A., Lastochkina M.A., Solov'eva T.S. Modernizatsiya ekonomiki regiona: sotsiokul'turnye aspekty: monografiya . Vologda: ISERT RAN, 2012. 158 p.
- Ovcharova L.N., Pishnyak A.I., Popova D.O. Izmeneniya v dokhodakh i potreblenii rossiiskikh domashnikh khozyaistv: ot bednosti k srednemu klassu . SPERO, 2013, no.18, pp. 7-36.
- Tikhonova N.E. Chelovecheskii potentsial rossiiskikh modernistov i perspektivy modernizatsii v Rossii . Terra Economicus, 2012, vol. 10, no. 1, pp. 135-146.
- Shabunova A.A., Rossoshanskii A.I. Uroven' zhizni naseleniya kak indikator modernizatsionnykh protsessov . V mire nauchnykh otkrytii , 2013, no.12.1(48), pp. 127-150.
