Wetlands Spatial-Temporal Distribution Multi-Scale Simulation Using Multi-Agent System

Author: Huan Yu, Kong Bo, Shuqing Zhang, Xin Pan
Journal: International Journal of Intelligent Systems and Applications(IJISA) @ijisa
Article in issue: 9 vol.4, 2012.
Free access
The simulation of wetland landscape spatial-temporal distribution not only can reveal the mechanisms and laws of landscape evolution, but achieve the sustainable land use as well as provide supports for wetland conservation and management. In this report, the inland freshwater wetlands in the Sanjiang Plain of China were selected for wetland landscape changing process simulation studies. Results showed that both visual effects of simulation and prediction were good and the total accuracy co-efficiency of points to points was also significantly high (above 82%), which demonstrated the feasibility and effectiveness of wetland landscape spatial-temporal distribution simulation using Multi-Agent System (MAS). Scales exerted influence on visual effects, simulation accuracies and statistics of landscape index. Scale effects were obvious during simulation process using MAS. It was demonstrated that 60m was the best scale for simulation. It was shown that contagion index lines were exponential distribution while accuracy lines were lognormal distribution with the scale rising, which provided a reference for scale effect assessment and simulation scale selection.
Multi-Agent System, Multi-Scale, Wetlands, Spatial-Temporal Distribution, Simulation
Short address: https://sciup.org/15010303
IDR: 15010303
Text of the scientific article Wetlands Spatial-Temporal Distribution Multi-Scale Simulation Using Multi-Agent System
Published Online August 2012 in MECS
Transformation of the Earth surface receives much attention by geophysicists worldwide, as a process itself; land cover change has huge impacts on ecosystems, biodiversity, and the global climate [1]. Wetlands are integral parts of the global ecosystem as they can prevent or reduce the severity of floods, feed ground water, and provide unique habitats for flora and fauna [2]. However, under dual pressures of natural factors (such as climate change) and the growing intensity of human activities/disturbance, wetland area shrinks drastically in recent decades, ecological functions degrade obviously, which lead to a series of ecological and environmental problems[3]. Close attention should be paid to the accelerating reduction, loss or change of wetland coverage before it gets even worse.
Landscape digital reconstruction and spatial-temporal distribution simulation based on multi-period regional land coverage can help to understand the mechanisms and laws of landscape succession, to recognize the relationship between human activities and landscape changes, then predict the future trend of the landscape, and ultimately provide strategies to decision-maker for wetland conservation and management. As a tool for analyzing complex natural systems, multi-agent model is especially suitable for simulation of various policies and impact on specific environment of individual decision. Conclusion resulted from such simulation studies can provide decision support for management and development of natural resources and sustainable utilization [4]. Currently, the multi-agent technology has been widely used in simulation of urban, agricultural land use change, and natural resource management [5-11]. The suitability for wetland landscape change simulation should be tested as well. The inland freshwater wetlands in the Sanjiang Plain, Northeast of China was selected for this simulation study, in order to verify the feasibility and effectiveness of wetland landscape spatial-temporal evolution simulation using MAS and provide a new technical idea and method for wetland landscape change simulation and protection, experiment of wetland landscape shrinking process simulation was carried out based on multi-temporal land use and other ancillary geographic data.
In addition, the scale problems are widespread in nature. Many phenomena and processes involve multiscale features or scale effects. At the same time, observations (measurements) of the phenomenon or process are also on different scales (resolutions), the scales are often unavoidable especially in the field of geosciences. Scales in the field of geosciences have many connotations. From the remote sensing point of view, scale is the measurement of space scope, interval time and spectral width [12]. In surveying and cartography, the scale is usually being described as the ratio of distance in map and the actual distance expressed. Nonetheless, from ecology point of view, scale refers to the ecosystem size or dynamic time interval, which is always expressed as size and magnitude [13, 14]. In this research, we define the scale as the smallest area unit and time interval of various data sources in the course of spatial-temporal evolution simulation. In this report, MAS technology is introduced into the simulation of wetland landscape changes process through the resolution changes to achieve multi-scale data acquisition. The scale effects of simulation are observed, with which a reference for scale choice will be concluded.
This paper is organized as follows: In Sections 2, the detail situation of study area will be introduced. Data and methods will be presented in Section 3. Process of simulation model construction will be introduced in Section 4 and a discussion on the simulation results will be carried out in Section 5. At last, Section 6 will discuss about the conclusion.
-
II. Study Area
The Sanjiang Plain, locates in the Northeastern region of China, is one of the largest freshwater wetland in the country (Figure 1). Since the end of the 1950s, large-scale development in the Sanjiang Plain marsh land has occurred [15]. By 2003, about 80% of natural wetlands had been converted to farm land for agriculture and progressive loss of wetland is
continuing [16]. With a local population of 7.8 million in this region, of which 53.4% is engaged in farming, the Sanjiang Plain has become an important grain and bean production region for China [17]. The regional climate is mild humid to subhumid continental monsoon feature. The average temperatures range from -18°C in January to 21–22°C in July with a frost-free period of 120–140 days. Annual precipitation is somewhere around 500–650 mm with 80% occurring from May to September. Most of the rivers at the area have riparian wetlands supporting meadow and marsh vegetation. Sedge (Carex spp.) is the dominant plants with Phragmites spp. scattered across some part of the landscape [3].
The study area is limited within 47°21′42″ – 48°15′9″North Altitude and 133°25′52″ – 134°33′37″ East Longitude in the Northeast of Sanjiang Plain at (Figure 1). Several factors have been taken into consideration when this region is chosen to start our experimental: Firstly, the Sanjiang Plain is one of the largest marsh distribution region; Secondly, it is a typical representation in the global temperate wetland ecosystems; Thirdly, due to the relative cold weather, deep surface waters, large marsh patches, and sparse population, reclamation of marsh lands in this region is relatively late; and Fourthly, experimental area contains two national nature reserves and three major river systems: Honghe Reserve and Sanjiang Reserve respectively and Yalv River, Nongjiang River and Bielahong River, which keep the study area a relatively natural original scenery in Sanjiang Plain. In addition, during the process of development and utilization in recent decades, the conflict between people and land is obvious a constant game of war. Wetland degradation process under the disturbance by human activities is representative, which makes it suitable for carrying out simulation of wetland landscape spatial-temporal evolution.
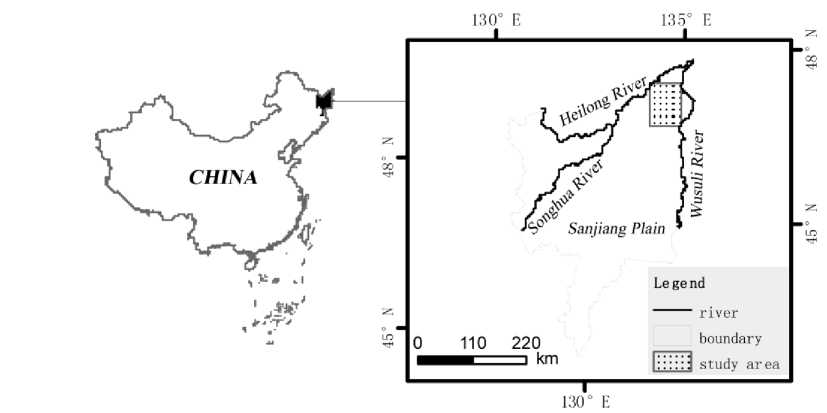
Fig. 1 Location of the study area in Sanjiang Plain, China
-
III. Data and Methods
-
A. Data
To complete the simulation using MAS, land use data were collected during three year period (1995, 2000, 2006).The 1995 and 2000 data sets are used in decision ruling on transformation, while 2006 data set is used to verify predicted results. Each land use data set contains 5 types of covers such as water, farmlands, resident area, forest and wetlands. The data of soil, topography, terrain, location and other thematic parameters are sorted to formulate the transformation probability under the influence of many geographical conditions. The soil data represent 22 different types; topography data
contains 14 types of landforms; River distance is a grid file that reflects the distance to rivers and road distance reflects the distance to road. The units of river distance, road distance and DEM (Digital Elevation Model) data are meters, and the slope is degree. In addition, the existing data collections previously includes planning, feasibility reports, scientific research reports, maps and documentation of Honghe National Natural Reserve and Sanjiang National Natural Reserve, meteorology, hydrology, groundwater observations and other statistical records are available for reference in our research. The detail of each dataset is listed in table 1. All of the data were co-registered and formatted as GRID format under ArcGIS 9.3.
Table 1 List of data description
|
Name |
Content |
Resolution |
Time |
Source |
Size |
|
Soil |
Spatial distribution of soil types |
30m-180m |
1985 |
Digitizing |
8.41MB |
|
Landform |
Spatial distribution of geomorphologic types |
30m-180m |
1985 |
Digitizing |
8.41MB |
|
River distance |
Distance to rivers |
30m-180m |
1998 |
Euclidean distance calculation |
33.66MB |
|
Road distance |
Distance to roads |
30m-180m |
1998 |
Euclidean distance calculation |
33.66MB |
|
DEM |
Digital Elevation Model |
30m-180m |
1986 |
Digitizing |
33.66MB |
|
Slope |
Spatial distribution of slope |
30m-180m |
1986 |
Calculated from DEM |
33.66MB |
|
Land use |
Spatial distribution of land cover types |
30m-180m |
1995 |
TM image classification |
16.82MB |
|
Land use |
Spatial distribution of land cover types |
30m-180m |
2000 |
TM image classification |
16.82MB |
|
Land use |
Spatial distribution of land cover types |
30m-180m |
2006 |
TM image classification |
16.82MB |
-
B. Methods
The construction of environmental factors layer, the definition of roles and conduct rules, the definition of agent interaction logic were used to complete the simulation models establishment, and Microsoft Visual Studio 2008 software was used to finish simulation programming. Finally, the accuracy and scale effects evaluation of simulation results was completed through visual identification, points to points comparison, landscape index statistic and sensitivity analysis methods.
Visual identification is a direct observation of differences between simulation and actual results in landscape spatial distribution. Points to points comparison method overlaps actual land use and cover type map of experimental simulation in year 2000 and 2006. Contagion (CONTAG) index is applied on landscape level to measure whether the landscape is gathered distribution. It approaches zero (0) when the patch types are maximally disaggregated and interspersed, while it reaches 100 when all patch types are maximally aggregated. Sensitivity analysis is a method of evaluating sensitivity degree of model (or system) state or output for parameters or changes in surrounding conditions. It can be used for qualitative or quantitative evaluation of model parameter error’s impact on model results and can be used to analyze the database error’s impact on the GIS analysis results. This is generally accepted as a useful tool for the evaluation of model uncertainty[18-20]. We added some random error to original space variable and analyzed the error’s impact on simulation results to achieve the sensitivity analysis of simulation results for data quality. To explore the relationship between stability and scale, further observation was made on scale’s impact on the simulation process and results. Algorithm of generating random error was made with the model proposed by Fisher[19].
-
IV. Model Construction
-
A. Analysis of change driving force
The statistic results of land cover change cells between the years of 1995 and 2006 (Figure 2) show that total area of changing from wetland to other cover types is 2402.68 km2. Among which from wetlands to farmlands is 2215.75 km2, the farmlands count about 92.22% of total altered region, the cultivation is the main factor that results in the wetland shrink. These results conform to the conclusion made by previous
reports [21, 16, 22]. The simulation then is focused on the process of changing from wetlands to farmlands. On the other hand, natural reserves within the investigated area also play a key role in preventing wetland shrink through protective and restoring activities. This concept is considered as a knowledge rule that constraints the wetland cover changes.
0 farmland resident forest water
Land cover types
Fig.2. Statistics of changing from wetlands to other cover types
-
B. Construction of environmental factors layer
Environmental factor layer in the model is the natural and social environment of MAS, is the data base for wetlands spatial-temporal evolution simulation, and a key element of the model[23,24]. In this model, environmental factor layer is defined as an integral body including the status of initial land cover, elevation, slope, soil, topography, distance to road, distance to river and other environmental factors.
-
C. Definition of roles and conduct rules
A key issue of multi-agent model construction is how to abstract and descript agents properly[25]. Analysis of experimental area land cover reveals the driving force of regional landscape changes that are caused by human activities. Therefore, the simulation of wetland landscape spatial-temporal evolution using MAS is to link up human activities and agents based on multiagent characteristics. Based on the actual situation of experimental area, three main types of agents are defined as: government, protectors, and farmers.
-
1) Government agent
Government’s own wish is through the planning acts to achieve, while residents are through the coordination with government to affect the probability of land cover conversion[26]. When farmers apply for the government agent to change land cover status, government will consider the current land cover status and future plans to give different probabilities.
The behaviors of the government agent at the area include the government’s macro-management, action planning, and decision-making in response to farmer agent’s application[27]. Due to the simulation time period, government’s macro management and overall planning are often not transparent. Consequently, the behavior of decision-making dictated the outcome. When farmers apply to convert wetlands for agricultural purpose, government agent will give decisions based on current land cover status and future planning of utilization. In practice, the local government always encourages agricultural production to ensure continued economical development. This action directly affects the protection of the wetlands and debases the refuse criterion. And illegal development activities still exist, which also plays down the importance of the government agent indirectly.
-
2) Protector agent
Government’s refuse criterion debasing also contributes to the wetland protector being a prominent player. Protectors who are the staff of national nature reserves in this research prevent farmers from agricultural developing. Protector agent becomes the main driving force of slowing down wetland landscape degradation with the support from government agent. The protective efforts of the protector agent are directly reflected on wetland area changes in specific period of time. It is indicative of a poor effect of protection and a small effect of hindering its degradation on wetland protection if the wetland area reduces enormously and quickly. Thus, an equation assessing the protective effect can be expressed as:
t 1 t 2
Pomit = -marsh----marsh X100% (1)
Amarsh
In which, Pomit is the probability that omit hindering agricultural development, At 1 is the wetland area at time t1, Amt 2 arsh is the wetland area at time t2, Amarsh is the reserve total area.
Formula 1 will be used to assess the protect effect on Honghe and Sanjiang National Nature Reserves separately. When land cover changes within those reserves, the omit probability will be calculated using this equation. The omit probability will be one hundred percent if the position is out the reserves. In such case, it can be expressed as:
J Pomit (if agent is within the reserves)
[ 1 (if agent is out of the reserves)
-
3) Farmer agent
The behaviors of farmer agent can be classified into two categories: development and un-development. This behavior will cause two types of possible results: one is negative behavior that can reduce the wetland area; and the other is positive activity that doesn’t change the land cover. As a reality, farmers perform such activities under the approval of government. In this model, one part of the farmers’ behaviors carry out directly (illegal development), while the other part apply for government agent selectively. The whole behaviors are also affected by protector agent. It must get the approval of government and avoid the hindering effect from protector agent. As a result, the land cover status can be changed eventually.
When the model starts running, the farmers’ probability of development will be calculated by the formula below:
P develop ( i , j ) = ( w 1Eeleva , w 2 E slop , w 3 E soil , w 4 Elanf , w 5 Erivd , w 6 Eroad , w 7 Rdisb )
In which, P ( i , j ) is the change probability for position (i, j); Eeleva , Eslop , Esoil , Elanf , Erivd , Eroad , Rdisb are the environment factors of elevation, slope, soil, landform, distance to river, distance to road and random disturbance; w 1 ,…, w 7 is the influence weight for each factor.
The relation between change probability and every factor, weight is calculated through data mining method. The random disturbance[28] is expressed as:
R dsb = 1 + ( - In 0 ) “
In which, θ is the random number between 0 and 1; α is the parameter that control the size of random disturbance; weight for it is set as 1.
-
D. Definition of interaction logic
Although an agent has certain functions, however, in reality, relying on a single agent can not always describe and resolve complex large-scale problems. Therefore, an application system often includes multiple agents. Each agent is not isolated but an interactive part of the group. Those agents can follow some kind of specific agreement and possess multi-linguistic communication skill to complete a specific task. According to the actual situation of experimental area, logical interaction rules among government agent, protector agent and farmer agent are designed as shown in Figure 3.
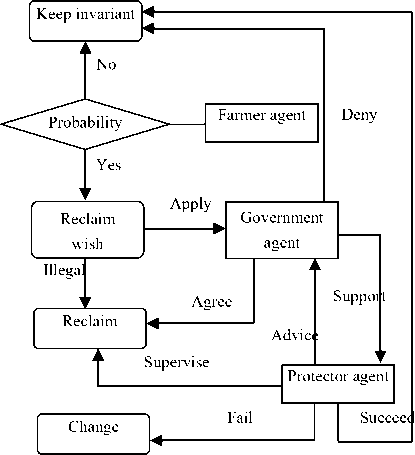
Fig.3 Interaction logistics of multi-agents
During the simulation, land cover status of certain position is determined by government agent, farmer agent and protector agent jointly. First, farmer agent determines whether reclaim wetlands under various environmental conditions. If the farmers wish to do so, a small part of them will illegally reclaim wetlands directly. Furthermore, if they go around obstacles from protectors, the land cover status will be changed. On the contrary, if they are hampered successfully by protectors, then the land cover remains unchanged. The rest majority of them will apply to the government agent to reclaim wetlands. Two total different consequences will result depending on whether the government approval to their petition: if the government approved and they avoided obstacles from protectors, the land cover status would be changed; if not, the land cover status will be unaffected and unchanged.
-
V. Results and Discussion
-
A. Simulation results
Simulation results (Figure 4) were obtained through a programming under Microsoft Visual Studio 2008 software based on simulation model. The simulation results showed that in general each scale in the year 2000 was better than 2006 since decision rules of MAS simulation can only be obtained based on land cover data in two periods. This study was based on 1995 and 2000 data. The decision rules for 2000 to 2006 might not consistent with actual changes and at least was not better than simulation results of 1995 to 2000.
Overall, visual effects of simulation and prediction were all satisfactory due to the application of the technique and method characteristics of multi-agent simulation. First, in specific system and under certain circumstances, the behaviors of system elements are not defined, and the element behaviors depend on not only themselves and their local small environment, but the overall environment of the system. This is often manifested some tendentiousness. MAS has the capacity of simulating complex human behavior and decision-making and of simulating different patterns of behavior and decision-making’s effects on land use dynamics. This characteristic can show that land use activities are choice of human conscious act, which can express the humanity and uncertainty. On the other hand, multi-agent has the mobile characteristic. In order to complete a task, it can move from one node to another node directly overcoming the fixity of Cellular Automata. This fixity can cause original plaque that should be quickly converted to other types may be slowed down because the plaque area is large while smaller plaque can be sped up to take change. This can be resulted in a non-consistent condition with reality. The MAS method overcomes this drawback and improves the simulation results.
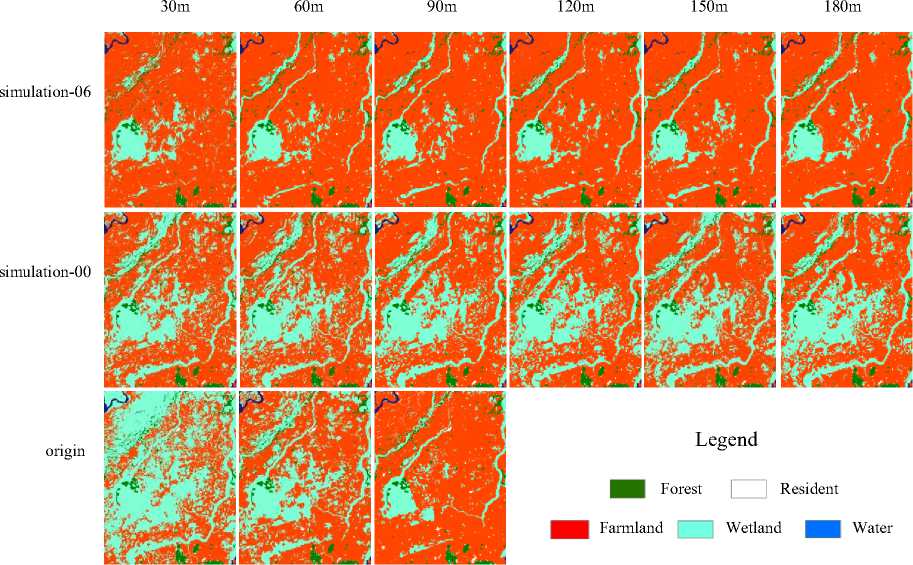
Fig.4 The results of simulation
-
B. Accuracy assessment
For quantitative evaluation of simulation accuracy, we overlapped the simulation result map and the actual land use map of year 2000, 2006 together to gain the simulation accuracy of points to points (Figure 5). The simulation total accuracy of the year 2000 was shown all above 82% and 2006’s were above 85%, thus the effectiveness of MAS was validated effectively.
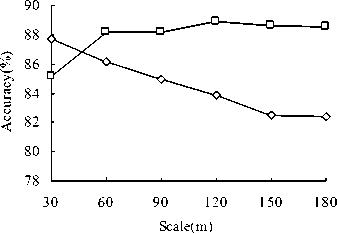
Fig.5 The accuracy of simulation result
Accuracy(%)
(2000) □ Wetlands
□ Farmlands □ Others
Accuracy(%)
Fig.6 The accuracy of each class
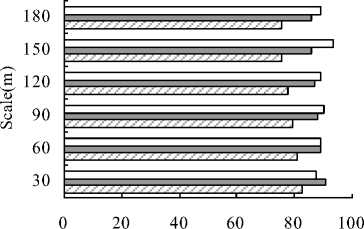
But the points to points accuracy of the year 2006 was higher than the year 2000 except 30m scale, which was contradict with previous prediction. So the specific reasons for this discrepancy need to be further investigated. Further calculation of the accuracy based on correct cellular number of each land cover type and corresponding total number, we obtained the accuracy values of main land cover types in the years 2000 and 2006 (Figure 6).
Accuracy of land cover types statistical results show that types of wetlands are lower than farmlands in 2000, but they present the same law of distribution, that is simulation accuracy decreases continuously with scale increasing (resolution lowering). In 2006, accuracy of wetlands is also lower than farmlands, but they present a different law of distribution in 2000, that is simulation accuracy present up and down irregularly with scale increasing. Overall, the distribution law for 2000 and 2006 are all the same as total accuracy of points to points, and the overall accuracy of simulation are mainly affected by the farmlands. The main reason for this phenomenon is that the area or cellular numbers of farmland landscape are much larger compared with wetlands and other landscapes. Preliminarily, we conclude that points to points method only reflects each cellular scale consistency while ignores the consistency of overall layout. So this method can not serve as a comprehensive assessment of the simulation results alone, combining the visual judgments and other methods might provide more reasonable results.
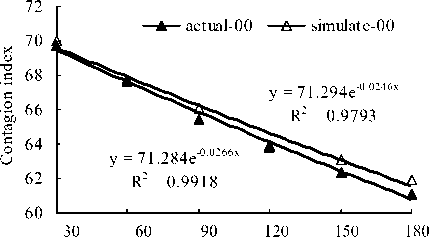
This research calculated the contagion landscape index for actual situation and simulation results in the years 2000 and 2006, as shown in Figure 7. The results showed that indices of actual situation and simulation were decreased continuously with scale increasing. For an objective evaluation of simulation results, using z-test statistics to calculate the differences between actual situation and simulation in the years 2000 and 2006 respectively, z value was calculated as follows[29]:
z = Ц - Ц 2 )/ V 5 12 / n 1 + 5 22 / n 2 (5)
In which, n 1 , n 2 are number of scales; Ц 1 , ц 2 are mean value of indices; s 1 , s 2 are standard deviation for two team of indices.
Through calculation, the z test value for actual situation and simulation in 2000 is 0.25 and 2006’s is 1.7113 that is higher than 2000’s, which is conform to the prediction that simulation results in 2000 are better than that in 2006.
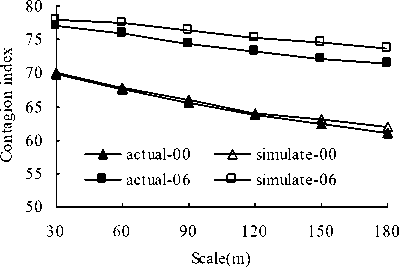
Fig.7 Statistics of contagion index
-
C. Analysis of scale effects
To observe the scale effects of results, simulation accuracy and the landscape index of different scales curves were fitted (Figure 8 and Figure 9). We found that contagion landscape index spread exponentially with the scale increases, while simulation accuracy spread as logarithmic distribution.
Simulation accuracy showed as a regular decline was useful for simulation scale selection. Contagion landscape index showed as a regular decline because grid cell can change the patch boundary complexity and shape, reduce the complexity of land use pattern, engulf a number of smaller patches units with scale increasing. And line shape of simulation accuracy was mainly caused by two sides of reason: one was the scale smaller the more suitable for simulation process, the other was that the accuracy calculation method was sensitive to scale changes, and through the analysis of data that were used to calculate accuracy, the former was determined as the main reason.
-
D. Analysis of simulation stability
As the spatial data of simulation is an abstraction of objective world, which is only an approximation and generalization of the real world, so uncertainty and error of data can not be avoided. For this reason, the ability of resistance to data error became an important aspect for simulation result evaluation. This experiment defined the resistance to negative effect of data error on simulation results as "stability". This model was tested twice: once using the original land use data from remote sensing image classification as initial input; and once adding 20% random error disturbance to initial input. In this way it allowed changing wetlands cell to farmlands or farmlands to wetlands randomly. The results were shown in Figure 10 and Figure 11.
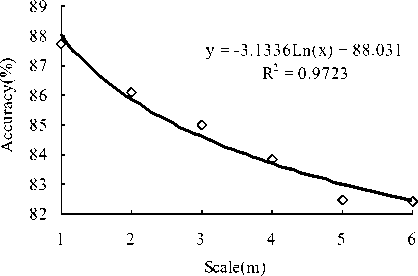
Fig.8 Relation between scale and accuracy
Scale(m)
Fig.9 Relation between scale and landscape index
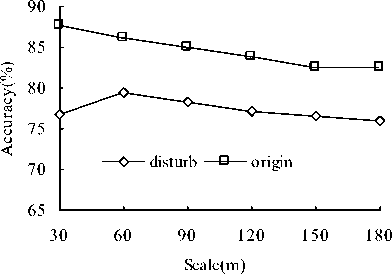
Fig.10 Total accuracy before and after disturbing
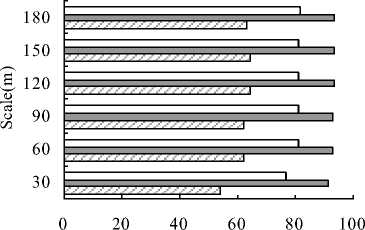
Total accuracy evaluation results (Figure 10) showed that the characteristics of error propagation in the course of MAS simulation. There were still error exists in the absence of disturbance under each scale. When a 20% error disturbance was added to the initial land use map, the error of simulation results increased due to error propagation. However, it was lower than expected 20%. Taking the 30m for example, a 20% error added to the initial land use map increased only 11% simulation error. But it should be noted that the increase of MAS results in 30m scale was larger than that of the other scales, meaning this scale was less stable. While 60m scale accuracy of the simulation was higher than that of the other scales indicating that this scale had the best "stability" in the process of simulation. Class accuracy evaluation results (Figure 11) showed that farmlands were the lowest on 30m scale causing the poor stability. And the random error affecting the farmlands was less than wetlands. In other words, wetlands were the main driving force of error increase.
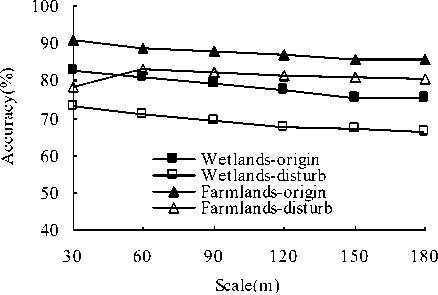
Fig.11 Class accuracy before and after disturbing
The simulation results through calculating the contagion landscape index before and after adding random error disturbance were shown in Figure 12. The results showed that index of simulation added random error disturbance were all smaller than original simulation indicating that the dispersion of core patch type was further increased. Finally, considering combining simulation accuracy, landscape index and "stability", 60m was the optimal scale for MAS simulation. Assuming this scale is suitable for practice, this scale needs to be validated further at other research area. In this report, we have verified the effectiveness and accuracy of this scale.
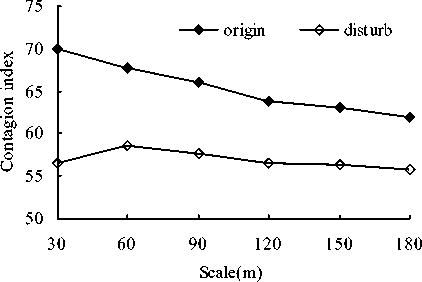
Fig.12 Landscape index before and after disturbing
-
VI. Conclusion
This research chose the inland freshwater wetlands in the Sanjiang Plain, Northeast of China as an ideal experimental region. The experiment of wetland landscape evolution process simulation was carried out based on MAS technique. The results demonstrated that visual effects of two periods (2000, 2006) were both valuable with total accuracy above 82%. The experimental data verified the feasibility and effectiveness of wetland landscape spatial-temporal evolution simulation using MAS, and provides a new technical idea and method for wetland landscape change and protection management.
Through multi-scale analysis of the simulation results, we concluded that scales had influence on visual effects, accuracy assessments and landscape index. For simulation of different scale landscape, the simulation process should be carried out respectively. And contagion index lines showed as exponential distribution but accuracy lines were lognormal with the scale rising. This distribution provides a reference for scale effect assessment and simulation scale selection.
The geographic system is large and complex, introducing MAS into wetland spatial-temporal evolution simulation involves a number of complex factors, many challenges still exist ahead of us to be solved. This research defined only three main types of agents, the types should be increased according to other actual situation. And each type of agent can still be further described in more detail. For example, farmer agent can be further subdivided into three categories according to a variety of indicators: a strong desire to reclaim; a moderate desire to reclaim; and a weak desire to reclaim.
Acknowledgment
This study was supported by the National Natural Science Foundation of China (Grant No. 41101174), the
Strategic Priority Research Program-Climate Change: Carbon Budget and Relevant Issues of the Chinese Academy of Sciences (Grant No. XDA05050105), the High-level Talented Person Foundation of Chengdu University of Technology (Grant No. 2010HJ0070) and the Youth Foundation of Chengdu University of Technology (Grant No. 2010QJ08). We also thank Honghe and Sanjiang National Nature Reserves for providing relative data.
References Wetlands Spatial-Temporal Distribution Multi-Scale Simulation Using Multi-Agent System
- M. R. Jepsen, S. Leisz, K. Rasmussen et al. Agent-based modelling of shifting cultivation field patterns, Vietnam. International Journal of Geographical Information Science, v20, 2006, pp.1067-1085.
- W. J. Mitsch, J. G. Gosselink. Wetlands. Van Nostrand Reinhold Co., New York, 1993.
- Y. Y. Chen. Study of wetlands in china. Jilin Sciences and Technology Press, Changchun, 1995.
- X. Li, Q. S. Yang. Integration of multi-agent systems with cellular automata for simulating urban land expansion. Scientia Geographica Sinica, v27, 2007, pp.542-548.
- W. Loibl, T. Toetzer. Modeling growth and densification processes in suburban regions-simulation of landscape transition with spatial agents. Environmental Modeling & Software, v18, 2003, pp.553-563.
- T. P. Evans, H. Kelley. Multi-scale analyses of a household level agent-based model of land cover change. Journal of Environmental Management, v72, 2004, pp.57-72.
- J. Rouchier, F. Bouquet, M. Require-Desjardins et al. A multi-agent model for describing transhumance in North Cameroon: Comparison of different rationality to develop a routine. Journal of Economic Dynamics & Control, v25, 2001, pp.527-559.
- J. Barros. Simulating urban dynamics in Latin American cities. Proceedings of the 7th International Conference on Geo-Computation, University of Southampton, UK, 2003.
- G. Ziervoge, M. Bithel, R. Washington et al. Agent-based social simulation: a method for assessing the impact of seasonal climate forecast applications among smallholder farmers. Agricultural Systems, v83, 2005, pp.1-26.
- O. Barreteau, F. Bousquet, C. Millier et al. Suitability of Multi-agent simulations to study irrigated system viability: application to case studies in the Senegal River Valley. Agricultural Systems, v80, 2004, pp.255-275.
- J. E. Gross, R. R. J. Mcallister, N. Abel et al. Australian rangelands as complex adaptive systems: A conceptual model and preliminary results. Environmental Modelling & Software, v21, 2006, pp.1264-1272.
- D. J. Marceau, G. J. Hay. Remote sensing contribution to the scale issue. Canadian Journal of Remote Sensing, v25, 2000, pp.349-366.
- B. J. Fu. Theory and application of landscape ecology. Science Press, Beijing, 2001.
- J. G. Wu. Landscape ecology: Pattern, Process, Scale and Hierarchy. Higher Education Press, Beijing, 2000.
- X. T. Liu. Marsh resource and its sustainable utility in the Songnen-Sanjiang Plain. Scientia Geographica Sinica, v16, 1997, pp.451-460.
- H. Y. Liu, S. K. Zhang, X .G. Lv. Wetland landscape structure and the spatial-temporal changes in 50 years in the Sanjiang Plain. Acta Geographica Sinica, v59, 2004, pp.391-400.
- G. Q. Chen, X. H. Ma. A study on the underground and its water balance change after development in the Sanjiang Plain. Scientia Geographica Sinica, v16, 1997, pp.427-433.
- W. A. Lodwick. Developing confidence limits on errors of suitability analysis in GIS. In: Goodchild, M.F, Gopal, S.(eds). Accuracy of spatial databases. Taylor & Francis, London, 1989.
- P. F. Fisher. Modeling soil map-unit inclusions by Monte Carlo simulation. International Journal of Geographical Information Systems, v5, 1991, pp.193-208.
- L. Wu, J. C. Cheng, W. Z. Shi. Data uncertainties in geographic information system. Science of Surveying and Mapping, v31, 2006, pp.13-17.
- K. S. Song, D.W. Liu, Z. M. Wang et al. Land use change in Sanjiang plain and its driving forces analysis since 1954. Acta Geographica Sinica, v63, 2008, pp.93-104.
- X. T. Liu, X. H. Ma. Sanjiang Plain environment change and zoology care. Beijing Scientific Publishing Company, Beijing, 2002.
- J. Guo. Dynamic simulation of vegetation spatial pattern based on multi-agent. MSc Thesis. Beijing Forestry University, Beijing, 2009.
- X. P. Liu, X. Li, B. Ai et al. Multi-agent systems for simulating and planning land use development. Acta Geographica Sinica, v61, 2006, pp.1101-1112.
- J. M. Zhang, B. Wu, T. Y. Shen. Research on dynamic simulation of Beijing land covering & changing by applying agent modeling. Journal of East China Institute of Technology, v27, 2004, pp.80-83.
- X. L. Huang. Research on urban ecological land evolution based on cellular automata and multi-agent. MSc Thesis. Central South University, Changsha, 2008.
- X. Li, J. A. Ye, X. P. Liu et al. Geographical simulation systems: Cellular Automata and Multi-Agent System. Science Press, Beijing, 2007.
- R. White, G. Engelen. Cellular automata and fractal urban form: a cellular modelling approach to the evolution of urban land-use patterns. Environment and Planning A, v25, 1993, pp.1175-1199.
- J. H. Zar. Biostatistical analysis. Prentice-Hall, Englewood Cliffs, 1984.
