A comparative analysis and proposing ‘ANN Fuzzy AHP model’ for requirements prioritization

Author: Yash Veer Singh, Bijendra Kumar, Satish Chand, Jitendra Kumar
Journal: International Journal of Information Technology and Computer Science @ijitcs
Article in issue: 4 Vol. 10, 2018.
Free access
Requirements prioritization is an essential component of software release planning and requirement engineering. In requirement engineering the requirements are arranged as per their priority using prioritization techniques to develop high-quality software’s. It also helps to the decision makers for making good decisions about, which set of requirements should be executed first. In any software development industry a ‘software project’ may have a larger number of requirements and then it is very difficult to prioritize such type of larger number of requirements as per their priority when stakeholder’s priorities are in the form of linguistic variables. This paper presents a comparative analysis of existing seven techniques based on various aspects like: scale of prioritization, scalability, time complexity, easy to use, accuracy, and decision making, etc. It was found from literature survey none of the techniques can be considered as the best one. These techniques undergo from a number of drawbacks like: time complexity, lack of scalability, Negative degree of membership function, inconsistency ratio, rank updates during requirement development, and conflicts among stakeholders. This paper proposed a model called ‘ANN Fuzzy AHP model’ for requirements prioritization that will overcome these limitations and drawbacks. In the investigation of this proposed model, a case study is implemented. Ozcan et al [31] using a FAHP (Fuzzy AHP) with ANN based technique to choose the best supplier based on the multiple criteria. The examination on ANN with FAHP is performed on MATLAB software and outcome evaluated by fuzzy pair-wise comparison matrix with three supplier selection criteria states that the requirements prioritization outcome is better from existing techniques.with higher priority.
Requirements Prioritization, ANN Fuzzy AHP, Requirement Engineering, Supplier Selection
Short address: https://sciup.org/15016254
IDR: 15016254 | DOI: 10.5815/ijitcs.2018.04.06
Text of the scientific article A comparative analysis and proposing ‘ANN Fuzzy AHP model’ for requirements prioritization
Published Online April 2018 in MECS
Prioritization of requirements is a multi-criteria decision making [MCDM] process [1]. The role of requirement prioritization is very important in the process of software development as it enhances the budget control, ordering and software release planning. It is a step to identifying the requirements as per their importance or needs of stakeholders (customers, users, managers etc.) [2, 3]. Stakeholders play very important role in requirements prioritization by comparing them to find out their ranking using weights and scoring system [4].The main focus of requirements prioritization techniques is to implement the highest priority requirements first with respects to several aspects like, quality, cost, risk, and software release time as the part of scheduling [5]. There are lots of advantages of requirements prioritization before design and coding. When stakeholders have lots of preferences and judgments becomes hard to make which preference is the best one. At that time there is a need of requirements prioritization techniques to solve these types of issues. For example, a customer wants to purchase a laptop, it is very easy to pick out if taking only one aspect like ‘price’ in to account, because only one aspect (price) is considered to find that which laptop have the function as per user needs. But when focusing on more aspects like price, size, function, and quality, then it is very complex to take the decision, since a laptop with price and functions as per user’s needs may not contain the good quality and size. There is only one solution to handle this problem, prioritize the customer’s or user’s preferences as per their priority [6]. The techniques of requirements prioritization help stakeholders to prioritize the huge numbers of requirements based on multiple-criteria or several aspects [7].The main objective of this paper is a comparative analysis of existing seven requirement prioritization techniques and proposed an effective ‘ANN Fuzzy AHP Model, which will overcome the limitations of existing techniques. Summarily, the aim of this comparative analysis and the proposing ‘ANN fuzzy AHP Model’ is to illuminate and link the existing verification concerning (1) Prioritization Taxonomies (2) Descriptions of seven requirement prioritization techniques. (3) Comparative study and the limitations (3) Proposed ANN Fuzzy AHP.
Supplier Selection (SS) is a multi-criteria requirements prioritization problem which includes both quantitative and subjective elements. The main objective is to select the best supplier, it is essential to create a tradeoff among the unambiguous and impalpable problems some of which may conflict [8].The aim of the supplier selection is to differentiate the providers with the most astonishing potential for representing an association's requires reliably and at a creditable cost. Determination is an extensive inspection of providers using a classic arrangement of multiple criteria and various aspects. Be that as it may, the stage of detail utilized for looking at potential providers may modify contingent upon a company's requirements.
Although AHP is commonly used for multi-criteria requirements prioritization issues in real situations, it is lacking to simplify unverifiable circumstances in particularly join shrewd correlation organizes. The superior parts of human’s decisions are not spoken to as accurate numbers. Since a part of the measurement criteria are subjective in nature, it is unusually difficult for the leader to state the inclinations utilizing careful mathematical esteems and to provide exact come together insightful correlation judgments [9]. Fluffy assessments in requirements prioritization are enormously important to handle these cons of AHP.
-
II. Prioritization Taxonomies
There are four main classifications of prioritization techniques have been recognized as shown in Fig. 1. Aasem et al. [10]; Voola and Babu [11]; Karlsson et al. [12];Berander and Andrews [13] identified ordinal, nominal, interval and ratio scales or classifications of requirement prioritization techniques.
Ordinal Scale (Where the order matter):-In ordinal scale, order is important but not the differences. The requirement is organized in order so that it is possible to find out which requirement is important than other, but not how much more important. Its result can present an important ranked list of requirements, but they cannot explain how much one requirement is less/more significant than another requirement. It can be used to enhance the nominal scale with information about the ranking of categories or classes. Categorization of each requirement performed according to its value assigned, i.e. mandatory, desirable, and unnecessary. Priorities of requirements can be determined by using numbers such as 1, 2 and 3 where the highest priority requirements are assigned to 1. The calculation in an ordinal scale for the median, percentile and non-parametric statistics are performed by using statistics. This scale assists in the multi-criteria decision making process in a subjective way. It does not present a detailed level of information regarding the importance of the requirements. It is based on qualitative measurement and gets less time. The example of this scale, have we ever filled grades one of those customer service surveys that companies send out? They might raise a query like ‘how was your experience today’ and request you to put the grades on a scale 1-10. Another examples of variables measured on an ordinal scale consist of complexity [easy, medium, and hard] and the order of concluding a race [first place, second place, and so on].
Nominal Scale (Where order not matter) – In this scale requirements are allocated to different priority groups. In one priority group, all the requirements being of equal priority. The mode can be calculated, but not median or mean. It consists of some kind of categorization and classification. All objects are grouped into subgroups and each subgroup is assigned to a certain name or number. No object is allowed to belong to more than one subgroup and there is no ordering among classes. Scores on a math test are reported as numbers, eating breakfast is not numeric. A person eats a healthy breakfast, an unhealthy breakfast, or no breakfast at all. These are not numbers but categories. Nominal scale of measurement deals with variables that are non-numeric or where the numbers have no value. In another way, we can set them in any order, would not matter. We can describe by taking a good example i.e the students who takes a healthy breakfast are -1, the students who takes an unhealthy breakfast are 0, and the students who do not take breakfast are +1. These numbers are just a means to recognize who belongs to which group, but actually do not have value. Another example, think regarding the jersey numbers of the football players’. Is the player having the jersey number 10 a better player than the player wearing the jersey number 76? Jersey numbers of the players have no value, but informing us about the skills of the players; it is just a way to identify them.
Interval Scale (differences between the numbers do matter):- This scale computes the mean, regression; corelation, analysis of variance, standard, and deviation, etc. Interval scale brings the information regarding the range of the intervals between ordered classes, that’s why we can in some logic understand the jump from one class to another. But what if we want to compute something where the distances between the numbers do matter. For example, what if we decide that the hotness of breakfast of a person matters? We think that the student who takes the hottest lunch will perform the best on the English written examination; and the student who takes the coldest lunch will perform the worst.
Ratio Scale (Order and relative difference matter):-Ratio Scale performs the ranking of requirement as well as the relative difference among ordered requirements and proves that how much more/less one requirement is more important than other. It can give the relative variation among requirements. This technique performs all the forms of statistical calculations consist of, geometric mean, harmonic mean; coefficients of variations etc. and ‘mean’ can be calculated. It is fully based on quantitative measurement but it is complex and time consuming. This technique provides a higher level of detailed information concerning relative importance.
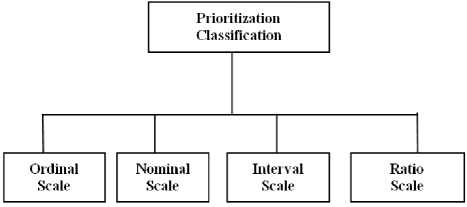
Fig.1. [Prioritization Classifications]
-
III. Description of Seven Requirements Prioritization and Utilized Techniques
In this section we describe the seven requirement prioritization techniques named as:
-
(1) Analytical Hierarchy Process (AHP), (2) Planning Game (PG), (3) Commutative Voting (CV), (4) Cost Value Ranking, (5) Priority Group (6) Binary Search Tree (BST) (7) Fuzzy AHP.
-
A. Analytical Hierarchy Process (AHP):-
AHP is a technique which is used for making the decision on the basis of multi-criteria developed by T.L Saaty in 1980. AHP allows the judges for making decisions about the ranking of the software requirements based on multiple criteria. The key benefit of AHP is its accuracy. This technique uses pair-wise comparison to calculate the relative cost and relative importance of software requirements, in turn to find out the ranking of each requirement as per their priority [14]. It is easy to use due to pair-wise comparison matrix. It consists of following three steps.
-
1. Making a pair-wise comparison.
-
2. Determine the ranking (priority) of software requirements using decision making process.
-
3. Check consistency ratio.
AHP technique is based on ratio scale and not appropriate for huge requirements [15], [16], [17], [18]. This technique does not scale well because the number of pair-wise comparisons using AHP are n*(n-1)/2 (where n is the number of requirements). So the complexity of AHP is O (n²).
-
B. Planning Games (PG):-
- This technique is composed of ranking and numerical assignment technique to accomplish the requirements prioritization. Therefore, this technique called the variation of the numeral assignment technique. In this technique ‘Beck’ proposed that the customer’s requirements are divided into three different groups should have the following names (1) Those group of requirements without which the system will never work, (2) Those group of requirements which are less important but provide high significant business value (3) Those group of requirements that would be valuable to have
-
C. $100 Allocation (Cumulative Voting):-
The hundred dollar method is basically a voting scheme used in brainstorming exercises described by Leffingwell and Widrig in 2003 [20]. This method is pretty simple, straightforward and presents the result on a ratio scale. In this technique ‘n’ requirement takes ‘n’ comparisons like planning game. In this technique 100 dollars are disposed to all stakeholders and they have to divide the amount amongst the requirement as per their priority list. The dollar of each requirement is summed up. The requirement has the highest amount is the most important requirement and having highest priority.
Table 1. Example of Hundred Allocation Method with several stakeholders
|
Requirements |
Stakeholder 1 |
Stakeholder 2 |
Stakeholder 3 |
Total |
|
Milk |
50 |
40 |
60 |
150 |
|
Tea |
30 |
20 |
25 |
75 |
|
Coffee |
10 |
20 |
10 |
50 |
|
Juice |
10 |
20 |
5 |
35 |
D. Cost Value Approach:-
This method was created by J. Karlsson and Kelvin Ryan in 1997 for priorities the requirement [21]. This technique is time consuming and scalability problem due to use of AHP. This ratio scale based technique.
The following steps are used to prioritize the requirements using this approach.
-
1. Requirement specialist first reviews the requirement of the candidates.
-
2. Users and Customers use the AHP technique to compute the relative weight of the user requirements
-
3. Decision makers apply the AHP technique to
-
4. Decision makers use the AHP technique to
-
5. The cost value diagram is the use of the stakeholders as the intangible guide for discusses and compares of the candidate requirements. Software expert exploits this observation to prioritize the software requirements and provides the ranking, which one has to be higher priority. Also, they can use the ranking of software requirements to build up arrangement for software release strategy.
calculate the relative cost of software requirements.
compute the usage/implementation cost and relative value of all user requirements then plot cost-value diagrams for these.
-
E. Priority Group:-
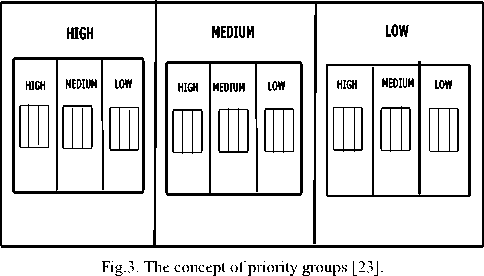
- This technique was proposed by Karlsson et al. [3]. The idea behind this technique is similarly used in the NT (Numerical assignment technique): allocate a value to every requirement into one group of three: high, medium, and low priority group. NT technique prioritizes only once the group requirements, while PG (priority groups)
technique does repeatedly this. Fig. 3 illustrates the concept of priority groups. The following steps in this technique are [3]:-
-
1. Collect all the user requirements and place them into only one cluster.
-
2. Place these requirements as per their priory into any one of the following groups: High, medium and low priority.
-
3. In each group, it may be possible that one requirement can make new three subgroups (high, medium and low) and place these software
-
4. Repeat step 3 until each sub-group contains only one requirement.
-
5. In this arrangement, numerical value of the requirements can be read from left to right.
requirements within same group into newly generated subgroups.
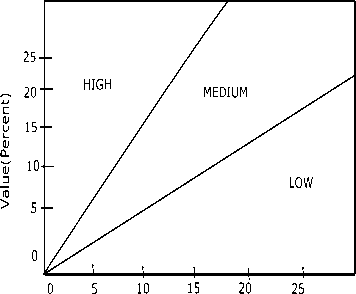
Cost( Percent)
Fig.2. ‘Cost’ and ‘requirement’s relative value’ diagram using AHP [22].
-
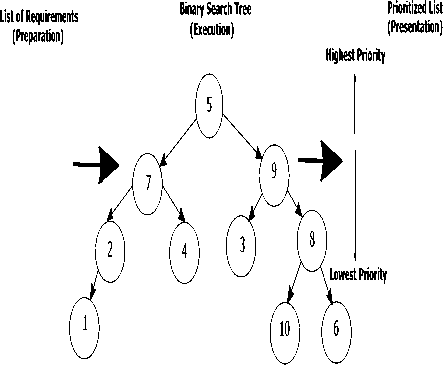
F. Binary Search Tree (BST): -
BST is a sorting technique was suggested by Hopcroft, Aho and Ullman in 1983 [24]. This algorithm regularly utilized as a part of a scan for data and can easily extent to be used in prioritizing many requirements. In BST every node has at most two children. This technique used for requirements prioritization as per their importance of order [3].
-
G. Fuzzy AHP:-
- Zadeh introduced first the fuzzy set theory [25]. Fuzzy set theory simplified standard sets in a bid to simulate and human being linguistic reasoning model in a field
categorized by partial, indistinct and tentative data. Fuzzy AHP named as extended appearance of AHP, also works on conventional idea of pair wise comparison of software requirements except that it captures the fuzziness inherent and vagueness in human opinions by insertion fuzzy linguistic conditions on a scale of triangular fuzzy numbers to develop the conventional scaling method [26]. Stakeholders are not being capable to judge every pair of software requirements precisely in crisp. Defuzzification is the process of generating a quantifiable outcome for the values which are estimated rather than precise, given corresponding membership degrees and fuzzy sets [27].
Requirement 1 Requirements Requirements Requirement4 Requirements Requirements Requirement? Requirements Requirements Requirement 10
RequirementO Requirements
Requirement 10 Requirements
Requirement] Requirements
Requirement4 Requirement 7 Requirement?
Requirement 1
Fig.4. Example of binary search tree
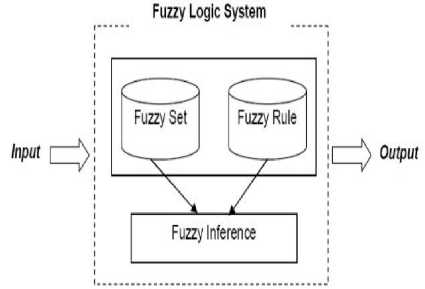
Fig.5. Fuzzy AHP block Diagram
The Fuzzy AHP takes over all characteristics of AHP such as ease of computation, having less computational cost, lack of mathematical calculations, but it includes the same problems i.e. large number of comparisons of software requirements initially made by judges [28], [29], [30].
-
IV. Comparative Analysis of Existing Seven Requirements Prioritization Techniques Based on
Different Parameters
This section represents a comparative study of existing seven requirements prioritization techniques based on different aspects like: accuracy, time complexity, scalability, prioritization scale, easy to use, and decision making, etc. It was found from literature survey none of the techniques can be considered as the best one. These above techniques undergo from a number of limitations as: lack of scalability. Time complexity, Negative degree of membership function, inconsistency ratio, and rank updates during requirement development, and conflicts among stakeholders.
Table 2. Comparative Analysis Table
|
S N |
Technique Name |
Scale Name |
Scalability |
EasyTo Use |
Accuracy |
Time Complexity |
Decision Making |
|
1 |
AHP |
Ratio |
X |
✓ |
✓ |
X |
✓ |
|
2 |
Planning Game |
Ordinal |
✓ |
✓ |
✓ |
✓ |
✓ |
|
3 |
Commutative Voting (CV) |
Ordinal |
X |
✓ |
✓ |
✓ |
X |
|
4 |
Cost Value Ranking |
Ratio |
X |
✓ |
X |
✓ |
✓ |
|
5 |
Priority Group |
Ordinal |
X |
✓ |
✓ |
X |
X |
|
6 |
Binary Search Tree |
Ordinal |
X |
✓ |
✓ |
✓ |
✓ |
|
7 |
Fuzzy AHP |
Ratio |
X |
X |
✓ |
X |
✓ |
-
A. Limitation of the existing techniques:-
- 1. Don’t support the scalability with huge requirements. 2. The problem of time complexity. 3. Most of the techniques does not calculate accurate consistency Ratio (CR= Consistency Index (CI)/Random Index(C). 4. Negative Degree of membership function makes no sense 5. Most of the techniques generate multiple optimal results makes strong inconsistency between fuzzy decisions.
To overcome of these drawbacks/limitations of the existing requirement prioritization techniques we proposed an effective “ANN fuzzy AHP model”.
-
V. The Proposed ‘ANN Fuzzy Ahp Model’
In this section, we discuss the implementation steps of our proposed “ANN Fuzzy AHP model” shown in Fig. 6. As seen in the fig., first of all, the experts communicating with the database obtain suitable machineries and manufacturing apparatus and store them in the database. Next, judges find out their criteria for choosing machinery and manufacturing apparatus. The criteria as a section of input data are entered. In the data entry stage, the data are organized and analyzed in the form of a FAHP and ANN diagram. The information enters to a prefabricated program of MATLAB software as fuzzy pair-wise comparisons matrices. In continuation, the trained artificial neural network (ANN) diagnoses the appropriateness or inappropriateness of judges’ view. In fact, this part represents the intelligent decision support system. If the results are suitable, the decisions are confirmed; otherwise, the entry data should be revised and will be returned to the cycle.
-
A. Steps for implementation
Step 1:- Configuration of FAHP
-
1. Configuration of a database of the requirements
-
2. Extraction of criteria and the association between the criteria by the Judges.
-
3. Extraction of suitable systems by experts from storage and database of suitable systems in the database.
appropriate for each criterion.
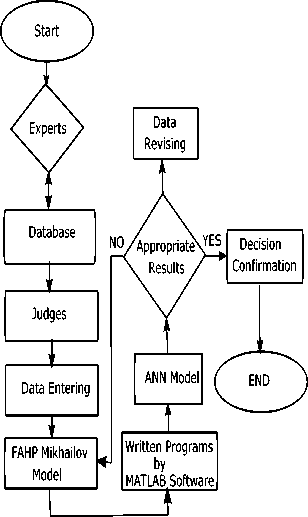
Fig.6. ANN Fuzzy AHP model
The above three steps led to the Configuration of FAHP:-
Step 2:- Retrieval of input data
-
1. Selection of judges for the judgement.
-
2. Fuzzy pair-wise comparison matrices were retrieved according to FAHP and then allocated mongst the judges as questionnaire (Fuzzy pairwise comparison matrices were acquired).
-
3. The questionnaire was gathered for analysis of requirements, selection.
Step 3:- Examination of the data retrieved by The
MATLAB program
-
1. Data taken from questionnaires were fed into the program written in MATLAB.
-
2. The program test out them with respect to consistency rate. (The ratio more than 0.10 indicates inconsistent decisions.)
-
3. Unsuitable questionnaires were back to the judges for revision. These three steps repeated until each questionnaire was reworked.
-
4. The weights of equivalent levels were identified.
Step 4:- Training and testing the neural network
-
1. The weights related to the number of judges were given to the suitable neural networks.
-
2. According to the outcomes, the more suitable network was chosen (as per the function of AIPAC and neural network).
Design of ANN Model: -
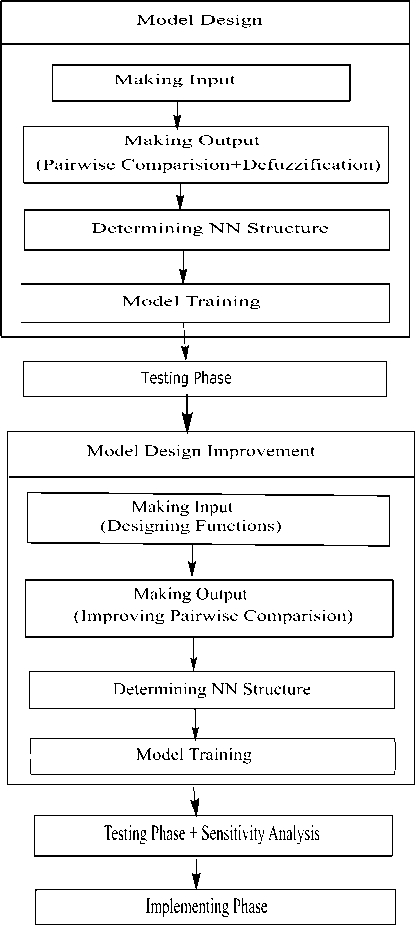
Fig.7. ANN Model
To design an artificial neural network model (ANN model), three main phases should be measured. These three phases – legitimate for any application – are shown in Fig. 7 which shows the model design. Multiple criteria require to be taken into account when selecting ‘requirements’.
To find out how ‘requirements’ have carried out in the previous or recent contracts, the judges must think about a set of criteria such as price, technology and quality. In other words, the performance record, based on distinct, defined criteria, is the most important input for the decision making process. The judges estimate ‘requirement’ based on their input, and find out the ranks of ‘requirement’ as output. How the judges thinks and makes decisions about the ‘requirement’ rank is a black box. If anyone can replicate this black box, then the input data could be used to determine the ‘requirement’ scores and order them for future usage without the judge’s judgment. The proposed ANN model simulates this black box by Neural Networks.
Application of supplier selection(SS) process in the white manufacturing goods sector:-
One of the largest white good manufacturers in Europe, founded in Turkey, desires to choose the best supplier organization for one its important parts utilized in the manufacturing of washing machines. The white good firm has washing machine, refrigerator, and A/C factories which are required for its manufactured goods in over 100 countries for example France, Germany, England, and Spain. The yearly capacity of the washing machine organization, which won the designation of “the most productive ability in the world” in the region by the quantity of products per capita, is annually 2 million units. With the washing machines manufactured in the firm, making an export in the amount of approximate 230 million USD yearly is foreseen. The manufacturing factory talked about in the study is new in this area and it is trying to enhance its customer base. Therefore the manufacture facility and the capability of the supplier to enhance its power should be taken into account to decide the best supplier industry. Due to white good sector, there are also seasonal fluctuations. The supplier’s capability should be flexible sufficient to meet the modifications in the market demand. Since the manufacturing is based on gathering, complete manufacturing raw materials are outsourced. In reflection that the capacity of the firm is 2 million units annually, there are a vast number of raw manufacturing materials supplied. Therefore we can finalize that the supplier selection (SS) is one of the most significant requirements prioritization problems in this washing machine firm [31].The fuzzy pair-wise evaluation matrix regarding the objective with TFN (triangular fuzzy numbers) can be seen in Table 3.The same computations were applied to another pair-wise comparison matrices and the priority weights of every main attribute, alternative and sub-attribute were computed. The priority weights of each main attribute, alternative and sub-attribute, can be seen in Table 4. Each column of the matrix in Table 7 was multiplied with weights of priority at the top of the column and then those the priority weights of the alternatives regarding supplier numerical values were added up for every row. Finally, attribute were computed.
Table 3. Fuzzy evaluation matrix with respect to ‘Requirement Selection’ with triangular fuzzy numbers (tfn).
|
Criteria |
SUPPLIER |
PRODUCT |
SERVICE |
FAHP |
ANN |
|
CRITERIA |
PERFORMANCE |
PERFORMANCE |
Priorities |
FAHP |
|
|
SUPPLIER CRITERIA |
(1,1,1) |
(2/3,1,3/2) |
(2/3,1,3/2) |
0.33 |
0.3422 |
|
PRODUCT PERFORMANCE |
(2/3,1,3/2) |
(1,1,1) |
(3/2,2,5/2) |
0.45 |
0.4460 |
|
SERVICE PERFORMANCE |
(2/3,1,3/2) |
(2/5,1/2,3/2) |
(1,1,1) |
0.22 |
0.2118 |
|
β= 0.7 |
|||||
Table 4. Fuzzy pair-wise comparison matrix of three alternatives with respect to the sub-criteria of supplier criteria and their normalized
|
SUPPLIER A |
SUP B |
SUP C |
FAHP |
ANN FAHP |
|
|
A: Comparisons of the three alternatives with respect to the sub-criterion Financial Status (FS) |
|||||
|
SUP A SUP B |
(1,1,1) |
(1/5,1/3,2/5) |
(2/9,1/4,2/7) |
0.1 |
0.2911 |
|
SUP C |
(5/2,3,5) |
(1,1,1) |
(3/2,2,5/2) |
0.84 |
0.5958 |
|
3= 0.833 |
(7/2,4,9/2) |
(2/3,1/2,2/3) |
(1,1,1) |
0 |
0.1131 |
|
B: Comparisons of the three alternatives with respect to the sub-criterion Management (M) |
|||||
|
SUP A SUP B |
(1,1,1) |
(2/5,1/2,3/2) |
(2/7,1/3,1/2) |
0 |
0.2012 |
|
SUP C |
(2/3,1/2,5/2) |
(1,1,1) |
(2/5,1/2,2\3) |
1 |
0.5558 |
|
3=1.0 |
(2,3,7/2) |
(3/2,2,5/2) |
(1,1,1) |
0 |
0.2430 |
|
C: Comparisons of the three alternatives with respect to the sub-criterion Technical Ability (TA) |
|||||
|
SUP A SUP B |
(1,1,1) |
(2/3,1,5/2) |
(2/3,1,2) |
0.58 |
0.5381 |
|
SUP C |
(2/5,1,3/2) |
(1,1,1) |
(2/3,1,2) |
0.42 |
0.4298 |
|
3=0.359 |
(1/2,1,3/2) |
(1/2,1,3/2) |
(1,1,1) |
0 |
0.0321 |
|
D: Comparisons of the Three alternatives with respect to the sub-criterion Quality System (QS) |
|||||
|
SUP A SUP B |
(1,1,1) |
(2/9,1/4,1/2) |
(2/7,1/3,1/2) |
0.58 |
0.5322 |
|
SUP C |
(2,7/2,4,9/2) |
(1,1,1) |
(2/3,1,5/2) |
0.42 |
0.3133 |
|
р= 0.612 |
(2,3,7/2) |
(5/2,1,3/2) |
(1,1,1) |
0 |
0.1545 |
|
E: Comparisons of the Three alternatives with respect to the sub-criterion Geographical Location (GL) |
|||||
|
SUP A SUP B |
(1,1,1) |
(2/5,1/2,3/2) |
(2/7,1/3,1/2) |
0 |
0.1862 |
|
SUP C |
(2/3,1/2,5/2) |
(1,1,1) |
(2/5,1/2,2\3) |
0 |
0.2109 |
|
р= 0.342 |
(2,3,7/2) |
(3/2,2,5/2) |
(1,1,1) |
1 |
0.6029 |
|
F: Comparisons of the Three alternatives with respect to the sub-criterion Capacity (C) |
|||||
|
SUP A SUP B |
(1,1,1) |
(2/3,1,5/2) |
(2/3,1,2) |
0.58 |
0.5212 |
|
SUP C |
(2/5,1,3/2) |
(1,1,1) |
(2/3,1,2) |
0.42 |
0.3302 |
|
р= 0.359 |
(1/2,1,3/2) |
(1/2,1,3/2) |
(1,1,1) |
0 |
0.1486 |
|
G: Comparisons of the Three alternatives with respect to the sub-criterion Working with Kanban Approach (WWKA) |
|||||
|
SUP A SUP B |
(1,1,1) |
(2/9,1/4,1/2) |
(2/7,1/3,1/2) |
0.33 |
0.3506 |
|
SUP C |
(2,4,9/2) |
(1,1,1) |
(2/3,1,5/2) |
0.22 |
0.2654 |
|
3=0.342 |
(2,3,7/2) |
(5/2,1,3/2) |
(1,1,1) |
0.45 |
0.3840 |
Table 5. Fuzzy pair-wise comparison matrix of three alternatives with respect to the sub-criteria of product performance criteria and their alternative
|
SUPPLIER A |
SUP B |
SUP C |
FAHP |
ANN FAHP |
|
|
A: Comparisons of the Three alternatives with respect to the sub-criterion PRODUCT PRICE (PP) |
|||||
|
SUP A SUP B |
(1,1,1) |
(2/7,1/5,2/5) |
(2/9,1/4,1/3) |
0.45 |
0.4670 |
|
SUP C |
(5/2,3,5/2,7/2) |
(1,1,1) |
(3/2,2,5/2,3) |
0.22 |
0.2486 |
|
3=1 |
(3,7/2,4,9/2) |
(1/3,2/5,1/2,2/3) |
(1,1,1) |
0.33 |
0.2844 |
|
B: Comparisons of the Three alternatives with respect to the sub-criterion HANDLING (H) |
|||||
|
SUP A SUP B |
(1,1,1) |
(2/5,1/2,3/2) |
(2/7,1/3,1/2) |
0.58 |
0.5512 |
|
SUP C |
(2/3,1,1/2,5/2) |
(1,1,1) |
(2/5,1/2,2\3) |
0.42 |
0.3286 |
|
Р=0.45 |
(2,3,7/2) |
(3/2,2,5/2) |
(1,1,1) |
0 |
0.1202 |
|
C:Comparisons of the Three alternatives with respect to the sub-criterion PRODUCT QUALITY (PQ) |
|||||
|
SUP A SUP B |
(1,1,1) |
(2/3,1,5/2) |
(2/3,1,2) |
0.45 |
0.4465 |
|
SUP C |
(2/5,1,3/2) |
(1,1,1) |
(2/3,1,2) |
0.33 |
0.3526 |
|
3=0.123 |
(1/2,1,3/2) |
(1/2,1,3/2) |
(1,1,1) |
0.22 |
0.2009 |
Table 6. Fuzzy pair-wise comparison matrix of three alternatives with respect to the sub-criteria of service performance criteria
|
SUPPLIER A |
SUP B |
SUP C |
FAHP |
ANN FAHP |
|
|
A: Comparisons of the Three alternatives with respect to the sub-criterion FOLLOW – UP (F) |
|||||
|
SUP A SUP B |
(1,1,1) |
(2/7,1/5,2/5) |
(2/9,1/4,1/3) |
0.45 |
0.4638 |
|
SUP C |
(5/2,5/2,7/2) |
(1,1,1) |
(3/2,2,3) |
0.22 |
0.2489 |
|
/?=0.545 |
(3,4,9/2) |
(1/3,1/2,2/3) |
(1,1,1) |
0.33 |
0.2873 |
|
B: Comparisons of the Three alternatives with respect to the sub-criterion LEAD TIME (LT) |
|||||
|
SUP A SUP B |
(1,1,1) |
(2/5,1/2,3/2) |
(2/7,1/3,1/2) |
0.45 |
0.4378 |
|
SUP C |
(2/3,1/2,5/2) |
(1,1,1) |
(2/5,1/2,2\3) |
0.33 |
0.3223 |
|
/?= 1.00 |
(2,3,7/2) |
(3/2,2,5/2) |
(1,1,1) |
0.22 |
0.2399 |
|
C:Comparisons of the Three alternatives with respect to the sub-criterion TECHNICAL SUPPORT (TS) |
|||||
|
SUP A SUP B |
(1,1,1) |
(2/3,1,5/2) |
(2/3,1,2) |
0.58 |
0.5356 |
|
SUP C |
(2/5,1,3/2) |
(1,1,1) |
(2/3,1,3/2,2) |
0.42 |
0.3285 |
|
р= 3090 |
(1/2,1,3/2) |
(1/2,1,3/2) |
(1,1,1) |
0 |
0.1359 |
|
D: Comparisons of the Three alternatives with respect to the sub-criterion PROFESSIONALISM (P) |
|||||
|
SUP A SUP B |
(1,1,1) |
(2/9,1/4,1/2) |
(2/7,1/3,1/2) |
0.58 |
0.5146 |
|
SUP C |
(2,4,9/2) |
(1,1,1) |
(2/3,1,5/2) |
0.42 |
0.3282 |
|
в 0165 |
(1/2,3,7/2) |
(5/2,1,3/2) |
(1,1,1) |
0 |
0.1572 |
Table 7. For supply criteria
|
Criteria |
FS |
M |
TA |
QS |
GL |
C |
WWKA |
FAHP |
ANN FAHP |
|
FS |
(1,1,1) |
(2/3,1/2,1) |
(2/5,1/2,3/2) |
(2/3,1/2,1) |
(3/2,2,5/2) |
(2/3,1/2,1) |
(2/3,1/2,1) |
0.18 |
0.1110 |
|
M |
(1,2,3/2) |
(1,1,1) |
(5/2,1/2,1/5) |
(3/2,2,5/2) |
(3/2,2,5/2) |
(5,3,2,2/5) |
(5,3,2,2/5) |
0 |
0.0368 |
|
TA |
(2/3,2,5) |
(5,3,2,2/5) |
(1,1,1) |
(3/2,2,5/2) |
(5,3,2,2/5) |
(2/3,1/2,1) |
(2/3,1/2,1) |
0.22 |
0.1921 |
|
QS |
(2/3,2,5) |
(2/3,1/2,1) |
(5/2,1/2,1/5) |
(1,1,1) |
(2/3,1/2,1) |
(2/3,1/2,1) |
(2/3,1/2,1) |
0.31 |
0.3253 |
|
GL |
(5,3,2,2/5) |
(2/3,1/2,1) |
(5/2,1/2,1/5) |
(5/2,1/2,1/5) |
(1,1,1) |
(2/3,1/2,1) |
(2/3,1/2,1) |
0.04 |
0.0449 |
|
C |
(2/3,1/2,1) |
(2/3,1/2,1) |
(3/2,2,5/2) |
(2/3,2,5) |
(2/3,1/2,1) |
(1,1,1) |
(2/3,1/2,1) |
0.25 |
0.2135 |
|
WWKA |
(2/3,1/2,1) |
(2/3,1/2,1) |
(3/2,2,5/2) |
(3/2,2,5/2) |
(5,3,2,2/5) |
(2/3,1/2,1) |
(1,1,1) |
0 |
0.0764 |
|
β=0.508 |
Table 8. Fuzzy pair-wise comparison matrix of product performance criteria
|
Criteria |
PP |
H |
PQ |
FAHP |
ANN FAHP |
|
PP |
(1,1,1) |
(2/3,1,3/2) |
(2/3,1,3/2) |
0.16 |
0.3212 |
|
H |
(2/3,1,3/2) |
(1,1,1) |
(3/2,2,5/2) |
0 |
0.0640 |
|
PQ |
(2/3,1,3/2) |
(2/5,1/2,3/2) |
(1,1,1) |
0.84 |
0.6148 |
|
β=0.01 |
|||||
Table 9. Fuzzy pair-wise comparison matrix of service performance criteria
|
Criteria |
F |
LT |
TS |
P |
FAHP |
ANN FAHP |
|
F |
(1,1,1) |
(5/2,2,1/2) |
(1,1/2,1/4) |
(2/3,1/2,1/5) |
0 |
0.1296 |
|
LT |
(2,1/2,2/5) |
(1,1,1) |
(2/5,1/2,1/5) |
(2/3,1,5/2) |
0.23 |
0.2585 |
|
TS |
(1,3,4) |
(2/5,1,3/2) |
(1,1,1) |
(2/5,1/2,2) |
0.69 |
0.4405 |
|
P |
(5,2,3/2) |
(4,2,4) |
(1/2,1/2,5/2) |
(1,1,1) |
0.08 |
0.1714 |
|
β=0.4910 |
||||||
Table 10. Sub-attributes of supplier criteria.
|
FS |
M |
TA |
QS |
GL |
C |
WWKA |
Alterative priority weight |
|
|
Weight Alternative |
0.1110 |
0.0368 |
0.1921 |
0.3253 |
0.0449 |
0.2135 |
0.0764 |
|
|
Supplier A |
0.2911 |
0.2012 |
0.5381 |
0.5322 |
0.1862 |
0.5212 |
0.3506 |
0.3724 |
|
Supplier B |
0.5958 |
0.5558 |
0.4298 |
0.3133 |
0.2109 |
0.3302 |
0.2654 |
0.3852 |
|
Supplier C |
0.1131 |
0.2430 |
0.0321 |
0.1545 |
0.6029 |
0.1486 |
0.3840 |
0.2425 |
Table 11. Sub- attributes of product performance criteria .
|
PP |
H |
PQ |
Alterative priority weight |
|
|
Weight Alternative |
0.3212 |
0.0640 |
0.6250 |
|
|
Supplier A |
0.4670 |
0.5512 |
0.4465 |
0.4857 |
|
Supplier B |
0.2486 |
0.3286 |
0.3526 |
0.3077 |
|
Supplier C |
0.2844 |
0.1202 |
0.2009 |
0.2066 |
Table 12. Sub-attributes of service performance criteria.
|
F |
TS |
LT |
P |
Alterative priority weight |
|
|
Weight Alternative |
0.1296 |
0.4405 |
0.2585 |
0.1714 |
|
|
Supplier A |
0.4638 |
0.5356 |
0.4378 |
0.5146 |
0.5140 |
|
Supplier B |
0.2489 |
0.3285 |
0.3223 |
0.3282 |
0.3234 |
|
Supplier C |
0.2873 |
0.1359 |
0.2399 |
0.1572 |
0.1626 |
Table 13. Main-attributes of the Requirements Selection.
|
S |
PP |
SP |
ANN FAHP |
|
|
Weight Alternative |
0.3422 |
0.4460 |
0.2118 |
|
|
Supplier A |
0.3724 |
0.4857 |
0.5140 |
0.4670 |
|
Supplier B |
0.3852 |
0.3077 |
0.3234 |
0.3341 |
|
Supplier C |
0.2425 |
0.2066 |
0.1626 |
0.1989 |
The same computations have been performed to the sub-attributes of manufactured goods performance attribute and service performance attribute and the weights of priority of the alternatives regarding manufactured goods performance and service performance attributes have been computed. The weights of priority can be seen in Tables 11 and 12.
Finally the weights of priority of the alternatives regarding the main attributes were combined and the weights of priority of the alternatives were concluded. The weights of priority of the alternative suppliers can be seen in Table 13.
In order to shorten the solution procedure for the supplier selection (SS) problem, Excel’s macros were used to compute the weights of priority of the alternatives based on the questionnaire forms applied to facilitate comparisons of alternatives, main attributes and subattributes. The specialist filled out the questionnaire forms. Some example parts of questionnaire form are given in appendices. Then Excel’s macros made all of the computations point out above to compute the weights of priority the alternative organizations. The weights of priority for the alternatives were found to be ( 0.4670, , 0.3341, 0.1989). According to the final value, Supplier A is the best supplier because it has the weight of highest priority and the Supplier B has the next recommended highest priority alternative.
-
VI. Conclusion and Future Work
References A comparative analysis and proposing ‘ANN Fuzzy AHP model’ for requirements prioritization
- Leffingwell, Dean, and Don Widrig. Managing software requirements: a unified approach. Addison- Wesley Professional, 2000.
- Barney, Sebastian, Aybüke Aurum, and Claes Wohlin. "A product management challenge: Creating software product value through requirements selection." Journal of Systems Architecture 54.6 (2008): 576-593.
- Karlsson, Joachim, Claes Wohlin, and Björn Regnell. "An evaluation of methods for prioritizing software requirements." Information and Software Technology 39.14 (1998): 939-947.
- Keele, Staffs. "Guidelines for performing systematic literature reviews in software engineering." Technical report, Ver. 2.3 EBSE Technical Report. EBSE. 2007.
- Finkelstein, Anthony, et al. "A search based approach to fairness analysis in requirement assignments to aid negotiation, mediation and decision making."Requirements Engineering 14.4 (2009):231-245.
- Ma, Qiao. The effectiveness of requirements prioritization techniques for a medium to large number of requirements: a systematic literature review. Diss. Auckland University of Technology, 2009.
- Sadiq, Mohd, and S. K. Jain. "Applying fuzzy preference relation for requirements prioritization in goal oriented requirements elicitation process."International Journal of System Assurance Engineering and Management 5.4 (2014): 711-723.
- Ghodsypour, S. H., & O’Brien, C. (1998). A decision support system for supplier selection using an integrated analytic hierarchy process and linearprogramming. International Journal of Production Economics, 56(57), 199–212.
- Chan, F. T. S., & Kumar, N. (2007). Global supplier development considering riskfactors using fuzzy extended AHP-based approach. Omega, 35, 417–431.
- Aasem, Muhammad, Muhammad Ramzan, and Arfan Jaffar. "Analysis and optimization of software requirements prioritization techniques." Information and Emerging Technologies (ICIET), 2010 International Conference on. IEEE, 2010.
- Voola, Persis, and A. Vinaya Babu. "Requirements uncertainty prioritization approach: a novel approach for requirements prioritization." Softw Eng Int J (SEIJ) 2 (2012): 37-49
- Karlsson, Lena, Martin Höst, and Björn Regnell. "Evaluating the practical use of different measurement scales in requirements prioritisation." Proceedings of the 2006 ACM/IEEE international symposium on Empirical software engineering. ACM, 2006.
- Berander, Patrik, and Anneliese Andrews. "Requirements prioritization."Engineering and managing software requirements. Springer Berlin Heidelberg, 2005. 69-94.
- Essaid, E. L., Abdellah Azmani, and Mohamed El Harzli. "Using AHP Method for Educational and Vocational Guidance." (2017).
- Wind, Yoram, and Thomas L. Saaty. "Marketing applications of the analytic hierarchy process." Management science 26.7 (1980): 641-658.
- Lehtola, Laura, and Marjo Kauppinen. "Empirical evaluation of two requirements prioritization methods in product development projects."European Conference on Software Process Improvement. Springer Berlin Heidelberg, 2004.
- Maiden, Neil A., and Cornelius Ncube. "Acquiring COTS software selection requirements." IEEE software 15.2 (1998): 46-56.
- Vaishnavi, B., Yarrakula, K., Karthikeyan, J., & Thirumalai, C. (2017, January). An assessment framework for Precipitation decision making using AHP. In Intelligent Systems and Control (ISCO), 2017 11th International Conference on (pp. 418-421). IEEE.
- Beck, Kent, and Martin Fowler. Planning extreme programming. Addison-Wesley Professional, 2001.
- Khan, Javed Ali, et al. "Comparison of Requirement Prioritization Techniques to Find Best Prioritization Technique." International Journal of Modern Education and Computer Science 7.11 (2015): 53.
- Karlsson, Joachim, and Kevin Ryan. "A cost-value approach for prioritizing requirements." IEEE software 14.5 (1997): 67-74.
- Ma, Qiao. The effectiveness of requirements prioritization techniques for a medium to large number of requirements: a systematic literature review. Diss. Auckland University of Technology, 2009.
- Leffingwell, D., and D. Widrig. "Management Software Requirements: a Use Case approach." (2003).
- Aho, A. V., & Ullman, J. D. (1983). Data structures and algorithms. Pearson.
- Avesani, Paolo, et al. "Facing scalability issues in requirements prioritization with machine learning techniques." 13th IEEE International Conference on Requirements Engineering (RE'05). IEEE, 2005.
- Gaur, Vibha, and Anuja Soni. "Evaluating degree of dependency from domain knowledge using fuzzy inference system." Trends in Computer Science, Engineering and Information Technology. Springer Berlin Heidelberg, 2011. 101-111.
- Regnell, Björn, et al. "An industrial case study on distributed prioritisation in market-driven requirements engineering for packaged software."Requirements Engineering 6.1 (2001): 51-62.
- Khari, Manju, and Nikunj Kumar. "Comparison of six prioritization techniques for software requirements." Journal of Global Research in Computer Science4.1 (2013): 38-43.
- Wang, Qiaoxiu, Hong Wang, and Zuoqiu Qi. "An application of nonlinear fuzzy analytic hierarchy process in safety evaluation of coal mine." Safety science 86 (2016): 78-87.
- Renuka Nagpal, Deepti Mehrotra, Pradeep Kumar Bhatia, Arun Sharma,"Rank University Websites Using Fuzzy AHP and Fuzzy TOPSIS Approach on Usability", IJIEEB, vol.7, no.1, pp.29-36, 2015. DOI: 10.5815/ijieeb.2015.01.04
- Ozcan Kilincci , Suzan Aslı Onal,” Fuzzy AHP approach for supplier selection in a washing machine company”, Expert Systems with Applications 38 (2011) 9656–9664
