A data analysis of the academic use of social media

Author: Dawn Carmichael, Jacqueline Archibald
Journal: International Journal of Information Technology and Computer Science @ijitcs
Article in issue: 5 Vol. 11, 2019.
Free access
The use of Facebook, in higher education, has become common place presumably due to a general belief that the platform can promote information flows between students and with staff as well as increasing a sense of community engagement. This study sets out to examine the academic use of Facebook groups using data analysis in order to determine if there are educational benefits and if Facebook group based learning strategies can be evaluated quickly and relatively easily. The data analysis involved utilising Social Network Analysis (SNA) in examining two Facebook groups; one under-graduate ‘course’ based group with 135 members and one under-graduate first year ‘module’ based group with 123 members. The SNA metrics included degree centrality, betweeness centrality, clustering coefficient and eigenvector centrality. The study also involved conducting a survey and interviews drawn from users of the Facebook groups to validate the utility of the SNA metrics. Results from the validation phase of the data analysis suggested that degree centrality is a useful guide to positive attitudes towards information flows, whilst betweenness centrality is useful for detecting a sense of academic community. The validation outcomes also suggest that high clustering coefficient scores were associated with a lower perception of academic community. The analysis of the data sets also found that the ‘course’ based group had higher scores for degree centrality and betweenness. This suggests that the ‘course’ based group provided a better experience of information access and a sense of academic community. Follow up interviews with respondents suggested that the ‘course’ based Facebook group may have had higher scores because it included more real world acquaintances than the ‘module’ based group.
Data Analysis, Social Network Analysis, Social Media, Facebook, Education
Short address: https://sciup.org/15016354
IDR: 15016354 | DOI: 10.5815/ijitcs.2019.05.01
Text of the scientific article A data analysis of the academic use of social media
Published Online May 2019 in MECS
In recent years there has been widespread Interest in the educational use of social media [1]. In general terms social media use by academics is regarded favourably for promoting communication although with some misgivings about the blurring of private and professional information spaces [2]. Social media has, for example, also been utilised for informal learning, in support of more formal content delivery based learning [1, 3]. The academic use of social media has been viewed favourably for providing a means for information flow [4] and collaboration [5] as well as a platform to support academic community [6]. It has been suggested that social media can enhance learning, by providing access to information and a means to support collaboration largely due to student familiarity with the software [7].
The academic use of social media has focused in particular on Facebook as it is the most widely adopted amongst students [8]. In similar terms to social media in general it has been stated that Facebook in particular may enable student to student communication as well as student to staff [9]. Facebook has also been utilised as an educational tool to promote student engagement [10, 11, 12]. Furthermore it has been argued that Facebook may increase the sense of an academic ‘community of practice’ [13]. In a similar vein Facebook was positively received by students as a means of promoting community [14]. However not all of the findings suggest favourable outcomes from the adoption of Facebook, for example Dyson et al [15] found that it did not increase engagement in traditionally delivered fact to face lectures when it was adopted to support students in preparing for class.
If you favour the view that educational technology should be a means of assisting students in improving their academic performance, there is growing evidence that Facebook use may be problematic. It has been reported that educational affordances associated with Facebook are not correlated with intensive Facebook use [16]. In a pair of studies it was argued by Junco [17, 18] that academic performance was negatively correlated with Facebook use probably due to the fact that students’ concentration was diluted when multi-tasking between academic work and Facebook [17]. Although the follow up study suggested that the effect was limited to first year under-graduates [18]. There has been other subsequent studies that found that there was no linear relationship between Facebook and Grade Point Average (GPA) albeit based upon self-reporting in a survey [19]. Furthermore there was a study that suggested that the negative impact was not related to Facebook use per see rather it was to gaming activities associated with the social media site [20]. More recently the potentially negative aspects of social media accessed on mobile devises has been confirmed [21].
Broadly speaking there is consensus in the literature that Social Media in general and Facebook in particular, cannot be leveraged to improve academic performance. On the other hand, there is support in the literature for the belief that Social Media, including Facebook, can facilitate the flow of academically useful information and promote academic community. Findings such as these suggest the possibility of both positive and negative outcomes; we therefore pose the question ‘is it possible to detect these outcomes by means of data analysis?’.
Social Network Analysis (SNA) provides a means of examining social networks by providing metrics concerning the underlying social graph. SNA takes pairwise relationships and yields scores describing a range of traffic and clustering connections. If SNA could be used to indicate the usefulness of a Facebook group in terms of information flow and community, it would provide a relatively quick and straightforward way of indicating the software usefulness to users.
This study examines two Facebook groups, one oriented around a course the other around a single module. A follow up survey was used to validate the analysis and interviews were used to gain insight into why the results might have occurred. Specifically, the research question under examination is;
Are SNA measures useful to examine the health of academic Facebook groups in terms of information availability and the experience of community?
This paper is organized as follow; section 1 provides a background and rationale for the study. Section II contains a literature review in the areas of SNA, Social Media and Education. Section III is the methodology section containing an explanation of the SNA metrics utilized and the validation process. Section IV contains a description of the findings from the SNA analysis whilst the second results section (V) contains an outline of how the SNA results were validated. The VI and VII sections contain a discussion and conclusions about the findings of the study and their impact.
Social Network Analysis (SNA) has had a long tradition in providing a means to understand the structure and information flows of social networks in both social media and academic media. In terms of social media based studies Willging [22] used degree centrality, betweenness and clique scores in order to analyse a discussion forum and was able to find central members, bridges (betweenness) and social isolates. In addition
Willging [22] argued that SNA could uncover relationships not revealed by other analytical methods. SNA can provide graphic visualisation which can aid in the understanding of computer use [23]. Furthermore it was suggested that raw data such as number of posts was likely to overlook structural characteristics of the social graph [22].
Mislove et al [24] examined a number of social media sites including Orkut, YouTube and Flikr using SNA. In Mislove et al [24] it was argued that the use of SNA would enable an in-depth analysis of such software and afford information likely to be useful in the design of social media systems. The study made use of the SNA concepts of degree (in-degree and out-degree), link symmetry and clustering coefficient. The results of the study indicated that the social graphs were made up of high levels of link symmetry and clusters of low degree nodes connected to other clusters by high degree nodes (bridges). In addition it was found that the graph contained a large, densely connected core and was linked together by about 10% of the nodes with the highest degree [24].
In another study concerned with examining social media by means of SNA, Catanese et al [25] analysed Facebook. The study made use of degree distribution, clustering coefficients and eigenvector centrality scores. It was suggested in the paper that social media should be studied as online interactions would increasingly mirror real world communities and were rapidly becoming the tools of choice for communication. The study found that the higher the degree centrality the lower the clustering coefficient scores. The finding is perhaps to be expected, given the formula for cluster coefficient is the ratio of number of actual links over number of possible links between neighbouring nodes [25].
SNA has also been used extensively in educationally related social media. It has been suggested that the overall use of SNA in the study of e-learning has been increasing in the last several years [26], for example helping students understand social media [27]. SNA has also been used to aid in the understanding of student participation in social media learning interactions [28].
Other topics researched using SNA include the evaluation of software tools [29, 30], the study of interaction patterns in collaborative learning [31, 32] and investigation of the roles of students and tutors [33, 34, 35]. Degree centrality and density measures have also been used to measure participation in online discussions [36]. SNA measures have been utilised in comparison with student performance i.e. degree centrality and betweenness co-related to performance. In a similar study it was found that higher scores of degree centrality and betweenness was associated with higher quality of academic work [37].
The most popular measures in the published literature, as analysed by Cela [26], were degree centrality and betweenness and to a much lesser extent clustering techniques. It is these three measures together with eigenvector centrality that are used in this study and discussed in the next section.
-
III. Methodology - SNA Metrics
This section begins with a brief background on the development of SNA. The metrics that are intrinsic to this data analysis are also explained.
One of the first studies in SNA was carried out by Moreno [38] on sociometrics and then later by Heider [39] on triad equilibrium analysis. These ideas were related to graph theory created by Konig in 1936 intended as a formal tool for the study of social structures [40]. SNA involves analysing a graph and its component sub-graphs with the purpose of examining connections between individuals and groups. Graphs are sometimes referred to as sociograms in the context of relationships between people [41]. SNA provides a set of descriptive procedures to determine how the graph behaves along with methods to test the appropriateness of experimental propositions [42]. In order to understand the resultant graphs, the structure of ‘nodes’ and ‘edges’ in the graph corresponding to entities and relationships respectively are analysed. Features of the graph such as degree centrality (closeness to centre by connections) density (the number of connections in the graph) and the idea of strong and weak ties are all concepts frequently used in SNA studies of social media [43]. SNA methods have also been validated against other methods such as interviews [44]. Therefore, it can be argued that SNA methods have the potential of providing an insight into the structure of the social graph constructed by social media.
-
A. Degree Centrality
Measuring the network location of a node is known as centrality whilst the number of nodes linked to a given node is known as the degree of the node. Figure 1 displays a ‘kite’ network showing a simple graph.
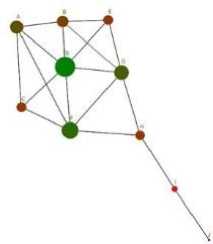
Fig.1. Basic graph with node size given by degree centrality
Figure 1 illustrates a basic graph with nodes A-J with a variety of edges illustrating relationships between nodes. The number of connected nodes refers to the degree: thus node A has a degree of four. The size of each node is relative to the degree of the node, and so node D is the largest and node J the smallest. The basic graph in Figure 1 is useful for outlining some key concepts in SNA. Directedness in a graph indicates a two-way connection for example, node I is related to H and J whilst J is only related to I. Degree centrality is expressed mathematically, where v is the vertices (or nodes), as;
C d (v) = deg(v). (1)
Or conceptually as; Degree centrality of node i = sum of all edges of nodes connected to i
For example node H is connected to nodes G,F and I and thus C D (H) = 3.
-
B. Betweenness Centrality
Often times when social network analysis is applied to social media interactions high degree is considered to be a measure of connectedness, however it is worth noting that whilst node D has the highest degree it is only connected to nodes that are connected to one another. Betweenness centrality in a graph refers to the number of times a node falls on the shortest path in essence the effect on the graph if the node is removed. Therefore, although node D has the highest degree, node H is the only connector for J and I therefore the betweenness score for H is higher. Betweenness centrality is expressed mathematically as:
C B (v) = ^ s#v#teV^ . (2)
° st
Or conceptually as;
Betweenness centrality of node i = for all relevant nodes; total shortest paths, fraction of shortest paths I , sum over all pairs
For example, for node B;
C b (B)= Z s^tev °^ =(A and E) 1 . (3)
° st 2
To summarise, for each pair of nodes, first calculate the shortest path between the nodes. Then for each pair of nodes, determine the fraction of shortest paths that pass through the node in question (here, node v ) then sum this fraction over all pairs of nodes. Finally, o st is the total number of shortest paths from node s to node t and crst(v) is the number of those paths that pass through v [45].
Figure 2 shows the same type of graph as figure 1, but with node size denoting betweenness centrality score. Thus node H has the highest score.
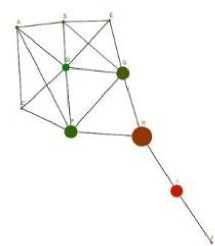
Fig.2. Basic graph with node size given by betweenness score
-
C. Clustering Coefficients
The SNA measure of clustering coefficients is based upon the ratio of number of actual links over number of possible links between neighbouring nodes. This measure is essentially a simple clique score which is expressed mathematically as:
рр _ ^G (v)
V TG (V)
.
Where 1 (v) is the number of subgraphs of G with 3 edges and 3 nodes, one of which is v, whilst tg (v) is the number of subgraphs with two edges and 3 nodes, one of which is v.
For example, for node H;
cc M= i
1 TG (H) 7
.
A network structure for clustering coefficient is shown in Figure 3. Node C (the largest) has the highest number of triads as expressed by the coefficient formula.
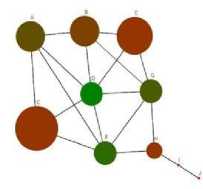
Fig.3. Basic graph with node size given by clustering coefficient
-
D. Eigenvector Centrality
The concept of eigenvector centrality is essentially concerned with the allocation of popularity scores based upon scores from other nodes. There are a variety of means of calculating an eigenvector centrality such as assigning degree scores to each node and then calculating a new score based upon sharing out the scores from the adjacent nodes. In the case of the kite network node A will start with a given degree score in a graph, then the nodes connected to it will share that degree score, somewhat like allocating pieces of pie. Google’s Pagerank algorithm is an example of an eigenvector centrality score [47]. The logical assumption is that all nodes must first have a score such as degree centrality.
It is worth noting that whenever one node is assigned an eigenvector centrality score based on adjacent scores the new node score affects all other adjacent scores. Therefore, the process of calculating eigenvector centrality scores for a graph usually undergoes a predetermined number of iterations. Furthermore, the eigenvector centrality scores usually increase exponentially and therefore some formulae, for example Pagerank, uses a dampening factor.
Eigenvector centrality scores can have a number of formulae that are computed using an adjacency matrix (which is a means of assigning adjacent nodes values based upon the edges connected to them). The most basic adjacency matrix makes use of 0 or 1 to indicate the absence or presence of an edge. However the values in the adjacency matrix can be determined by any score [42]. Table 1 shows an adjacency matrix for 3 nodes in the simple kite diagram:
Table 1. Adjacency Matrix for nodes A,B and C from the kite network
|
nodes/nodes |
A |
B |
C |
|
A |
0 |
1 |
1 |
|
B |
1 |
0 |
0 |
|
C |
1 |
0 |
0 |
Although Eigenvector centrality scores can be calculated in a number of ways, in general terms the concept can be expressed mathematically as:
X/ = 1 2 7=1 atJXj . (6)
Let X / denote the score for the ithnode and let A = (ay) be the adjacency matrix of the network. Hence a /,j = 1, if the Ith node is linked to the jth node, and a /,j = 0 otherwise.
Constructing an adjacency matrix of the graph, shown in table 1, and solving the eigenvector equation we find the largest eigenvalue to be 3.9423. This gives the corresponding absolute eigenvector [0.3035, 0.4502,
0.2838, 0.4624, 0.2238, 0.3531, 0.4321, 0.2139, 0.0580, 0.0147], where the ordering of the eigenvector corresponds to the alphabetical ordering of the nodes. Absolute eigenvector in this sense means that all entries of the eigenvector found were negative, and so the values in the eigenvector have been made positive to indicate the relevant sizes of eigenvector centrality scores. The diagram in Figure.5 shows the nodes size set to eigenvector scores for the kite network.
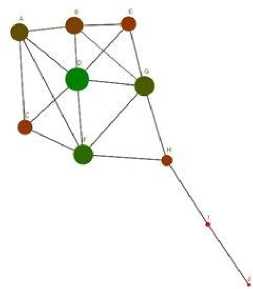
Fig.4. Basic graph with node size given by Eigenvector centrality score
-
E. SNA and Facebook Groups
SNA was carried out on the postings of two Facebook groups. The first group, Data set A, was used by an entire course n = 135. The second group, Data set B, by a single first year module n=123. The data was collected over a twelve-week time period.
The user data was extracted from the group via the Facebook Application Program Interface (API) in line with the relevant terms and conditions and the informed consent of the users. The posters were arranged in one column of data with commenters on the posts arranged in a second column of data. The two column data set was then imported into NodeXL which was used to calculate the various SNA metrics and to produce graphs. NodeXL is a plugin for MS Excel which expands the available tool set and provides a means of graphing the data [48]. The SNA measures used were: degree centrality, betweenness centrality, clustering coefficient and eigenvector centrality. The results of SNA are presented in the next section.
-
IV. Results of SNA
The results of SNA data analysis are as follows.
-
A. Degree Centrality
Degree centrality is a traffic measurement, sometimes described as a popularity score, where users are nodes and the interactions between users are the edges as explained above.
Table 2. Degree Centrality Results
|
Data set |
Min |
Max |
Mean |
|
A – course based |
0 |
38 |
10.305 |
|
B – module based |
0 |
34 |
4.604 |
The results in table 2 show for data set A, the range of degree centrality scores were 0-38 whilst for data set B, the range was 0-34. The data set B is in respect of a Facebook group set up for discussions concerning an individual module and it was found that the mean and median number of posts is relatively low in comparison to data set A set up for an entire course. In short the averages were far higher for data set A than B. The degree centrality results for data set A and B were used to construct graphs as shown in Figure 5 and 6.
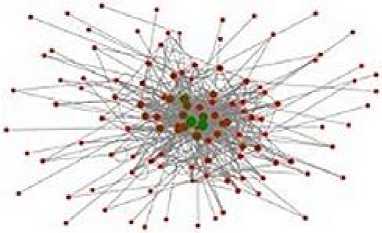
Fig.5. Data Set A (course) ‘degree centrality’ score indicated by node size
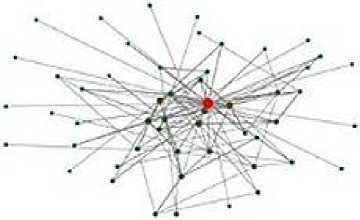
Fig.6. Data Set B (module) ‘degree centrality’ score indicated by node size
The figures 5 and 6 above shows a marked difference in the overall amount of posting and the posting activity of individual users. In reading the graph you should take into account that the larger the node is the greater the number of posts/comments (or higher total degree). The graph for data set B as a whole is low density 0.0489 (high density would be everyone connected to everyone else) whilst for data set B, the density is higher at 0.0761. It is worth noting that ‘lurkers’, i.e. users who merely view the postings, are not shown in this graph.
The graphs in Figure 5 and 6 provide a means of visualising the frequency of posts, and the information flows between users of the Facebook group.
-
B. Betweenness Centrality
Table 3. Betweenness Results
|
Data set |
Min |
Max |
Mean |
|
A – course based |
0 |
222.85 |
87.059 |
|
B – module based |
0 |
246.54 |
45.434 |
The table data shows that data set A has a much higher mean and median than data set B. In the figures below the larger the betweenness score the larger the node shown as circles. In both graphs the tutor’s circle is in the top right hand corner. In comparison to the tutor other users have lower betweenness scores (shown as smaller circles), this shows that most users commenting on only a few users posts.
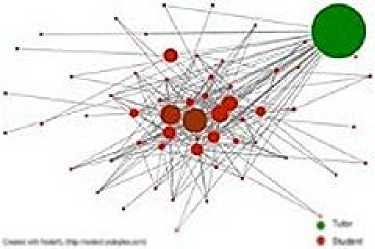
Fig.7. Data Set A (course) Betweenness score indicated by node size (tutor top right)
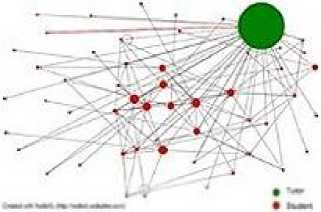
Fig.8. Data Set B (module) Betweenness score indicated by node size (tutor top right)
The graphs are illustrating that there are a lot of nodes with low betweenness centrality scores, and in comparison to the tutor’s node there is a large range in the scores. These graphs indicate that the tutors did not discriminate with whom they communicated with, and they communicate relatively frequently. On the other hand, student users are more discerning about the posts that they choose to comment upon, and the comments on their posts are from a relatively small number of fellow students.
-
C. Clustering Coefficient
Table 4. Clustering Coefficient Results
|
Data set |
Min |
Max |
Mean |
|
A – course based |
0 |
1 |
.173 |
|
B – module based |
0 |
1 |
.342 |
The graphs showing clustering coefficient scores for each of the three data sets are shown in figures 9 and 10. The higher the clustering coefficient scores the larger the node.
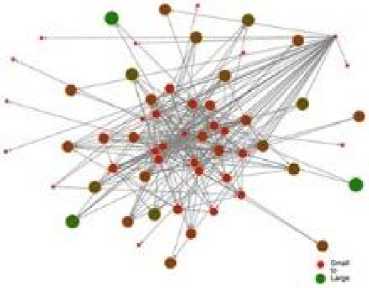
Fig.9. Data Set A (Course) clustering coefficient score indicated by node size
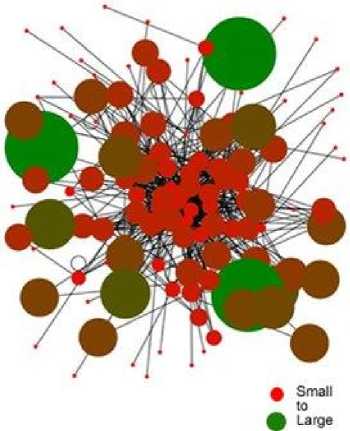
Fig.10. Data Set B (Module) clustering co-efficient score indicated by node size
Note firstly that Figures 9 and 10 show a marked difference in cluster coefficient scores. This is particularly striking in comparison to the betweenness graphs shown above. However, these results are consistent with the finding from the betweenness scores, in so far as they indicate that students are selective about the posts they choose to comment upon.
-
D. Eigenvector Centrality
The eigenvector centrality value is concerned with popularity. It is a metric based upon first scoring nodes, and then sharing out the scores amongst the nodes connected on the graph. Therefore, a node scores more highly by being linked to a ‘popular’ node than to a ‘loner’ node. The results of the Eigenvector centrality for the two data sets are given in table 5.
Table 5. Eigenvector centrality results
|
Data set |
Min |
Max |
Mean |
|
A – course based |
0 |
0.840 |
0.080 |
|
B – module based |
0 |
0.085 |
0.019 |
The results in table 5 show that data set 11 with the smallest number of contributors has the lowest mean and median Eigenvector centrality score. This result reflects the fact that data-set 12 has a lower number of ‘popular’ nodes therefore the start values for the eigenvector centrality scores were lower.
In summary there are interesting aspects to the results for eigenvector centrality. The results show that there is a wide range in eigenvector centrality scores and this bears a relationship to the amount of posting, or degree centrality.
The key findings are discussed below.
The survey was made up of seven statements with a 3 point Likert scale (disagree, neural, agree). The were three statements concerning information flow shown in table 6 and four concerning experience of academic community shown in table 7. The key words from the statements are used in the tables for brevity.
Table 6. Survey results of information oriented questions
|
Statement |
Disagree |
Neutral |
Agree |
|
Data Set A (Course) |
|||
|
Informative |
8% |
3% |
89%3% |
|
General Know. |
0% |
19% |
81% |
|
Specific Ans. |
16% |
29% |
55% |
|
Data Set B (Module) |
|||
|
Informative |
48% |
3% |
49%3% |
|
General Know. |
20% |
29% |
51% |
|
Specific Ans. |
26% |
29% |
45% |
In respect of data set A, the results from the survey given in table 6 indicate that 89% of students ‘agreed’ that the group was informative. The result for the general subject knowledge question was 81%. Whilst 55% of the students ‘agreed’ that it was useful for specific answers to questions. In respect of data set B there were lower agreement scores in comparison with data set B, for example 49% for informative as opposed to 89%.
Table 7. Survey results of community oriented questions
|
Statement |
Disagree |
Neutral |
Agree |
|
Data Set A (course) |
|||
|
Welcoming |
4% |
26% |
70% |
|
Intimidating |
55% |
16% |
29% |
|
Entertaining |
3% |
13% |
83% |
|
New Friends |
32% |
44% |
24% |
|
Data Set B (module) |
|||
|
Welcoming |
36% |
26% |
38%% |
|
Intimidating |
39% |
23% |
38% |
|
Entertaining |
13% |
27% |
60% |
|
New Friends |
41% |
39% |
20% |
In respect of data set A, the survey responses to the community oriented statements given in table 7 indicated that there was reluctance on the part of some users to post to the group. Over a quarter of the respondents agreed that the group was ‘intimidating’. Although over half of the students disagreed that the group was intimidating as shown in table 7. The results also indicated that a majority of students found the group ‘welcoming’, ‘and ‘entertaining’. Around 30% ‘agreed’ that it was useful for making friends. In respect of data set B, the scores were lower for welcoming and entertaining that for data set A. For example, 70% of respondents for data set A found the group welcoming as opposed to 38% for data set B. The scores were fairly close, between the two data sets, for making ‘new friends’ with data set A returning a score of 24% and data set B with a score of 20%.
The following are summary points of the comparison between the SNA findings and the survey results;
-
• Degree centrality higher scores varied with information statement scores
-
• Betweenness centrality higher scores varied with community statement scores
-
• Clustering Coefficient scores varied negatively
with community statement scores
-
• Eigenvector centrality higher score varied with
information statement scores.
Interviews were carried out with the six student volunteers. The volunteers were equally divided between data set A (course based) and B (module based. The interviews were semi-structured with set questions and free flowing discussion. The topics discussed during the interviews included;
-
• The nature of the group
-
• Social aspects of the group
-
• Contributions to the group
-
• Informational aspects of the group
These topics of discussion yielded the following findings;
-
• The group was used mainly for subject information and occasionally for arranging social gatherings.
-
• The group was followed usually at least once a day
-
• Course groups were preferred to module groups as there was more potential interest in the course/subject area than for any single module
-
• Contributions in terms of postings were occasional because participants felt that they didn’t have anything to add or felt that they might sound stupid
-
• It was easier to post to groups, such as the course based group, were participants had real world acquaintances.
-
• The tutor’s input was appreciated as a source of information
-
• The social discourse and opportunities to speak to different year’s cohorts was welcome
-
• The information in the posting was considered valuable
The interviews results suggest that students found the Facebook groups useful for both general and specific subject related questions and that course groups were preferred to module groups. Students found it easier to post to the course based Facebook group because they knew more people in the real world than was the case with the module based group.
-
VI. Discussion
In terms of the Clustering Coefficient scores the results were higher for data set B than A. As explained above the clustering coefficient measure is sometime known as a clique score, and although cliques may help limited number of users to communicate it appears that it doesn’t help the overall sense of community within a group. It is suggested that the lower clustering coefficient score for data set A is essentially the inverse of the high betweenness score. These findings lend support to the assertion in Catanese et al [25] that higher degree centrality scores tend to be accompanied by lower clustering coefficient scores. Both SNA results for betweeness centrality and Clustering Coefficient indicate, when taken together, indicate that data set A users had a better experience of academic community.
It was also found that the Eigenvector scores are similar to degree scores as seen by comparing the eigenvector centrality figures 11 and 12 with the degree centrality figures 5 and 6. It would appear that Eigenvector centrality doesn’t tell us a great deal more than degree centrality alone.
In summary higher degree centrality scores will indicate higher information ratings. High betweenness centrality will indicate higher community engagement; whilst high Clustering Coefficient scores will indicate lower community engagement. Suggesting that an analysis based upon these metrics could provide a useful means of evaluating the effectiveness of a particular learning strategy using Facebook groups.
The survey results, which were used to validate the SNA metrics, indicated that both Facebook groups provided access to information and academic community. Furthermore, the survey respondents found the Facebook groups to be informative. In particular, the users of the groups, both course based and module based, found the groups to be a better source of general subject knowledge than specific answers to questions. Whilst a significant minority of the groups users found the thought of contributing to the group to be intimidating, the majority found them to be entertaining.
It would appear that using SNA can provide insightful measures into how an academic Facebook group is being used, as suggested by Willging [22]. However, the answer to the question ‘why’ a particular result has been found, such as differences in academic community, was addressed in the follow up interviews. It was suggested by students through interviews that whilst the group was used as a means of social interaction on occasion, it was particularly valuable for general subject information. The role of the tutor as a source of information was also thought to be valuable. Interviewees suggested that they often commented on the posts of a limited range of fellow students, thought to be the cause of elevating the clustering coefficient scores, mainly because it was intimidating to comment on stranger’s posts when it was unclear how they might react to a comment. Further discussion revealed that interviewees who were associated with the module Facebook group (data set B) knew a more limited set of people in the module than they would have done had they been associated with a course based Facebook group.
-
VII. Conclusion
This study involved a data analysis of the educational use of two Facebook groups. The study validated degree centrality and betweenness centrality as proxy scores for information flow and academic community, respectively, using data analysis in comparison to survey results. The analysis of a ‘course’ based group versus a ‘module’ found higher degree centrality (information flow) and betweenness centralisty (academic community) scores for the former. The results from follow-up interviews suggested that this finding may have been due to the fact that students had more real world acquaintances in the ‘course’ based group than the ‘module’. The study has the caveat that students from only one University were examined therefore the methodology should be used in a different institution to ensure that the findings are generalizable. The impact of this study is that it demonstrates the utility of a data analysis approach to understanding teaching and learning interactions, and furthermore that degree centrality and betweeness centrality are potentially useful measures for a higher education context.
References A data analysis of the academic use of social media
- S. Manca and M. Ranieri, “Is Facebook still a suitable technology-enhanced learning environment? An updated critical review of the literature from 2012 to 2015,” J. Comput. Assist. Learn., vol. 32, no. 6, 2016.
- D. Lupton, “Feeling better connected’: Academics’ use of social media,” 2015.
- N. Dabbagh and A. Kitsantas, “Personal Learning Environments, social media, and self-regulated learning: A natural formula for connecting formal and informal learning,” Internet High. Educ., vol. 15, no. 1, pp. 3–8, Jan. 2012.
- K.-S. Kim, S.-C. J. Sin, and E. Y. Yoo-Lee, “Undergraduates’ Use of Social Media as Information Sources,” Coll. Res. Libr., vol. 75, no. 4, pp. 442–457, Jul. 2014.
- J. Gikas and M. M. Grant, “Mobile computing devices in higher education: Student perspectives on learning with cellphones, smartphones & social media,” Internet High. Educ., vol. 19, pp. 18–26, Oct. 2013.
- D. C. DeAndrea, N. B. Ellison, R. LaRose, C. Steinfield, and A. Fiore, “Serious social media: On the use of social media for improving students’ adjustment to college,” Internet High. Educ., vol. 15, no. 1, Jan. 2012.
- C. Pribeanu, D. D. Iordache, and A. Balog, “Educational Opportunities Provided by the Social Networking Sites: A Multidimensional Model,” in The International Scientific Conference eLearning and Software for Education, 2018, vol. 4, pp. 216–223.
- M. Duggan, N. B. Ellison, C. Lampe, A. Lenhard, and M. Madden, “Social media update,” Social media update 2014, 2015. .
- C. Barczyk and D. Duncan, “Facebook in higher education courses: an analysis of students’ attitudes, community of practice, and classroom community.,” Int. Bus. Manag., vol. 6, no. 1, 2013.
- E. Ivala and D. Gachago, “Social media for enhancing student engagement: the use of Facebook and blogs at a university of technology,” South African J. High. Educ., vol. 26, no. 1, 2012.
- J. C. Clements, “Using Facebook to enhance independent student engagement: a case study of first-year undergraduates.,” High. Educ. Stud., vol. 5, no. 4, 2015.
- N. Sheeran, D. J. Cummings, and N. Sheeran nsheeran, “An examination of the relationship between Facebook groups attached to university courses and student engagement,” High. Educ., 2018.
- N. E. Hurt et al., “The ‘Facebook’ Effect: College Students’ Perceptions of Online Discussions in the Age of Social Networking,” Int. J. Scholarsh. Teach. Learn., vol. 6, no. 2, Jul. 2012.
- I. Fares Al-Mashaqbeh, “Facebook Applications to Promote Academic Engagement: Student’s Attitudes towards the Use of Facebook as a Learning Tool,” I.J. Mod. Educ. Comput. Sci. Mod. Educ. Comput. Sci., vol. 11, no. 11, pp. 60–66, 2015.
- B. Dyson, K. Vickers, J. Turtle, S. Cowan, and A. Tassone, “Evaluating the use of Facebook to increase student engagement and understanding in lecture-based classes,” High. Educ., vol. 69, no. 2, Feb. 2015.
- A. Dhir, A. Khalil, K. Lonka, and C.-C. Tsai, “Do educational affordances and gratifications drive intensive Facebook use among adolescents?,” Comput. Human Behav., vol. 68, pp. 40–50, 2017.
- R. Junco, “Too much face and not enough books: The relationship between multiple indices of Facebook use and academic performance,” Comput. Human Behav., vol. 28, no. 1, Jan. 2012.
- R. Junco, “Student class standing, Facebook use, and academic performance,” J. Appl. Dev. Psychol., vol. 36, pp. 18–29, 2015.
- E. Alwagait, B. Shahzad, and S. Alim, “Impact of social media usage on students academic performance in Saudi Arabia,” Comput. Human Behav., vol. 51, pp. 1092–1097, Oct. 2015.
- W. W. F. Lau, “Effects of social media usage and social media multitasking on the academic performance of university students,” Comput. Human Behav., vol. 68, pp. 286–291, Mar. 2017.
- F. Giunchiglia, M. Zeni, E. Gobbi, E. Bignotti, and I. Bison, “Mobile social media usage and academic performance,” Comput. Human Behav., vol. 82, pp. 177–185, 2018.
- P. A. Willging, “Using Social Network Analysis Techniques to Examine Online Interactions,” vol. 2, no. 9, 2005.
- R. Xerez, “How Do the Evolution and Innovation of Social Network Analysis Matter to Computer Science and Communications?,” Soc. Netw., vol. 2, pp. 147–151, 2013.
- A. Mislove, M. Marcon, K. P. Gummadi, P. Druschel, and B. Bhattacharjee, “Measurement and analysis of online social networks,” Proc. 7th ACM SIGCOMM Conf. Internet Meas. - IMC ’07, 2007.
- S. A. Catanese, P. De Meo, E. Ferrara, G. Fiumara, and S. I. May, “Crawling Facebook for Social Network Analysis Purposes,” in Proceedings of the international conference on web intelligence, mining and semantics. ACM., 2011.
- K. L. Cela, M. Á. Sicilia, and S. Sánchez, “Social Network Analysis in E-Learning Environments: A Preliminary Systematic Review,” Educ. Psychol. Rev., vol. 27, no. 1, pp. 219–246, 2015.
- D. L. Hansen et al., “Do You Know the Way to SNA?: A Process Model for Analyzing and Visualizing Social Media Data,” in Social Informatics, 2012.
- K. Kitto et al., “The connected learning analytics toolkit,” in Proceedings of the Sixth International Conference on Learning Analytics & Knowledge, 2016, pp. 548–549.
- R. Rabbany, M. Takaffoli, and O. R. Zaïane, “Analyzing participation of students in online courses using social network analysis techniques,” in Proceedings of educational data mining, 2011.
- C. Spadavecchia and C. Giovannella, “Monitoring learning experiences and styles: the socio-emotional level,” in Advanced Learning Technologies (ICALT), 2010 IEEE 10th International Conference on, 2010, pp. 445–449.
- Z. Chen and S. Watanabe, “A case study of applying SNA to analyze CSCL social network,” in Advanced Learning Technologies, 2007. ICALT 2007. Seventh IEEE International Conference on, 2007, pp. 18–20.
- A. Corallo, M. De Maggio, F. Grippa, and G. Passiante, “A methodological framework to monitor the performance of virtual learning communities,” Hum. Factors Ergon. Manuf. Serv. Ind., vol. 20, no. 2, pp. 135–148, 2010.
- E. Gottardo and R. V. Noronha, “Social networks applied to distance education courses: analysis of interaction in discussion forums,” in Proceedings of the 18th Brazilian symposium on Multimedia and the web, 2012, pp. 355–358.
- M. De Laat, V. Lally, L. Lipponen, and R.-J. Simons, “Analysing student engagement with learning and tutoring activities in networked learning communities: A multi-method approach,” Int. J. Web Based Communities, vol. 2, no. 4, pp. 394–412, 2006.
- R. J. Benbow and C. Lee, “Teaching-focused social networks among college faculty: exploring conditions for the development of social capital,” High. Educ., pp. 1–23, 2018.
- P. He, “Evaluating students online discussion performance by using social network analysis,” in Information Technology: New Generations (ITNG), 2012 Ninth International Conference on, 2012, pp. 854–855.
- G. Putnik, E. M. Costa, C. Alves, H. Castro, L. Varela, and V. Shah, “Analysing the correlation between social network analysis measures and performance of students in social network-based engineering education,” INESTEC, 2016.
- J. Moreno, Who shall survive? New York, USA: Beacon Press, 1934.
- F. Heider, “Attitudes and Cognitive Orientation,” J. Psychol., vol. 21, 1946.
- F. Martino and A. Spoto, “Social Network Analysis : A brief theoretical review and further perspectives in the study of Information Technology,” PsychNology J., vol. 4, no. 1, 2006.
- J. Moreno, “Sociogram and sociomatrix,” Sociometry, vol. 9, 1946.
- S. Wasserman and K. Faust, Social network analysis: Methods and applications. Cambridge: Cambridge University Press, 1994.
- T. W. Valente, Social Networks and Health. New York: Oxford University Press, 2010.
- A. Fenton and C. Procter, “Studying social media communities: blending methods with netnography,” 2019.
- U. Brandes, “A Faster Algorithm for Betweenness Centrality,” J. Math. Sociol., vol. 169, no. 5, 2001.
- T. Opsahl and P. Panzarasa, “Clustering in Weighted Networks,” Soc. Networks, vol. 31, no. 2, 2009.
- D. Austin, “How Google Finds Your Needle in the Web’s Haystack,” American Mathematical society, 2013. [Online]. Available: http://www.ams.org/samplings/feature-column/fcarc-pagerank.
- I. Himelboim and M. A. Smith, “NodeXL,” Int. Encycl. Commun. Res. Methods, pp. 1–3, 2017.
