A Framework for Mining Coherent Patterns Using Particle Swarm Optimization based Biclustering

Author: Suvendu Kanungo, Somya Jaiswal
Journal: International Journal of Intelligent Systems and Applications(IJISA) @ijisa
Article in issue: 11 vol.7, 2015.
Free access
High-throughput microarray technologies have enabled development of robust biclustering algorithms which are capable of discovering relevant local patterns in gene expression datasets wherein subset of genes shows coherent expression patterns under subset of experimental conditions. In this work, we have proposed an algorithm that combines biclustering technique with Particle Swarm Optimization (PSO) structure in order to extract significant biological relevant patterns from such dataset. This algorithm comprises of two phases for extracting biclusters, one is the seed finding phase and another is the seed growing phase. In the seed finding phase, gene clustering and condition clustering is done separately on the gene expression data matrix and the result obtained from both the clustering is combined to form small tightly bound submatrices and those submatrices are used as seeds for the algorithm, which are having the Mean Squared Residue (MSR) value less than the defined threshold value. In the seed growing phase, the number of genes and the number of conditions are added in these seeds to enlarge it by using the PSO structure. It is observed that by using our technique in Yeast Saccharomyces Cerevisiae cell cycle expression dataset, significant biclusters are obtained which are having large volume and less MSR value in comparison to other biclustering algorithms.
Clustering, Biclustering, Gene Expression Data, Particle Swarm Optimization
Short address: https://sciup.org/15010767
IDR: 15010767
Text of the scientific article A Framework for Mining Coherent Patterns Using Particle Swarm Optimization based Biclustering
Published Online October 2015 in MECS
Microarray technology is a high throughput discovery tool which is used to identify gene expression data. It is used to express the expression level of genes under the specified conditions [1]. Gene expression is the way through which the DNA sequences of the genes are transcribed into mRNA sequences which again transformed into proteins and these mRNA which are produced is called as the expression values of genes in a gene-expression data-matrix [2]. It is represented as a two-dimensional data matrix where set of rows determines the genes and the set of columns determines the conditions. The elements of this data-matrix are the real values.
There are large number of analysis methods available through which genes are detected that are having the same biologically patterns and common functionality through which it is easy to determine its contribution in many of the biological applications and also helps in medical domain for quick treatment planning, drug discovery, accurate diagnosis as well as prognosis [3]. One of the analysis techniques is clustering which is used to group different types of data into a logical group of clusters which are having similar behavior. Clustering [4, 5] can be applied either to rows or columns of the gene expression data-matrix one at a time and in this method subset of genes is determined under all conditions (gene cluster) or the subset of condition is determined under all genes (condition cluster). It is widely used in many of the areas like biology, medicine, marketing and economics, and is basically of two types; hierarchical clustering and partitional clustering [6, 7]. Hierarchical clustering forms a hierarchy of nested set of clusters. It resembles like a hierarchical tree which is also called as dendogram. Initially, at the lowest level each data belongs to a separate cluster and by increasing the levels, clusters are merged according to some common features and at the highest level all the data belongs to a single cluster. It is of two types; agglomerative and divisive. Agglomerative is a bottom–up approach in which each data are in the separate cluster at the lowest level and then they are merged accordingly to make a large cluster having all the data at the highest level. Divisive clustering is a top-down approach in which the large cluster having all data at the highest level is divided into small number of clusters and at the lowest level all the data belongs to a separate cluster. In partitional clustering there is no nested set of clusters, and clustering is done in the same level. K-means clustering algorithm and its variants [8] is one of the best examples of partitional clustering as it has the linear time complexity which is a significant factor. Thus, clustering is a one-way process through which global patterns for genes are determined. However, for the gene expression data it is essential to find the local expression pattern to uncover similar behavior of genes which clustering algorithm doesn’t provide. Thus, it is necessary to move towards the biclustering method which shows the local expression patterns of genes. Biclustering is a two-way process in which gene and condition clustering is done simultaneously and a subset of genes exhibit similar expression pattern for a subset of conditions. These algorithms are used to cluster genes and condition simultaneously [9]. It is used to cluster a subset of genes under a subset of conditions or vice-versa and helps to identify those group of genes which shows the same behavior under the specified set of conditions, thus giving the local model for the gene expression data. Many of the biclustering algorithm is used for the analysis of the gene expression data like simulated annealing Biclustering [10], pClustering, statistical-algorithmic method for biclustering analysis (SAMBA), Spectral biclustering [11], and Gibbs sampling biclustering [12]. Moreover, it is used to solve the optimization problems. So, it is combined with many of the heuristic algorithms to obtain best solution in less time.
Heuristic algorithms are used to find the best solution from the set of the solutions, but it doesn’t guarantee that the solution which is found is the best and optimal. These algorithms may not give the best solution but find the solution which is close to the best solution. It is relatively simple and fast to converge for the best solution. Many of the heuristic algorithms have been developed like Genetic Algorithm (GA), Ant Colony Optimization (ACO), Differential Evolution (DE), and PSO.
PSO method is used in this paper. It is a heuristic based search algorithm developed by Eberhart and Kennedy [13] in 1995. It is based on a natural flocking and social behavior of birds. Due to its simplicity and relatively fast speed it is used to solve many of the optimization problems and it also requires the less memory for storage of history data. PSO converges fast and gives best results in many areas like image processing, clustering problem, and function optimization [18], and it also doesn’t require any mutation and crossover operators due to which it is much better than the evolutionary algorithms.
-
II. Related Work
Hartigan [14] was the first to identify biclustering and identifies two biclusters at a time which he called it as direct clustering. Cheng and Church [15] introduce the concept of applying biclustering on the gene expression data for the first time and they used the greedy approach in their algorithm, in which the number of rows and number of columns are added or deleted from the bicluster. Madeira and Oliveria [9] presented a comprehensive survey of models, methods and applications developed in the field of biclustering algorithm. The list of available algorithms is given through which ideas can generate to develop new algorithms which are effective in many applications of gene expression data. Many interesting ways for future research have been uncovered in this review paper. Birzuela et al. [16] proposed an encoding scheme for a multi-objective genetic algorithm in order to find highly homogeneous large biclusters. Further, they have tested the performance of their algorithm on two real gene expression dataset. Saccharomyces cerevisiae and the Human B cells Lymphoma. Moreover, their focus was on the discovery of large bicluster with MSR below predefined thresholds for both datasets. Liu and Chen [17] proposed a technique to mine coherent pattern from microarray data based on a dynamic multi-objective particle swarm optimization (DMOPSOB). They have applied their algorithm on two datasets; Saccharomyces cervisiae cell cycle expression data and the Human B-cell expression data. Liu et al. [18] proposed a dynamic multiobjective immune optimization biclustering (DMOIOB) algorithm for mining coherent patterns from microarray data. They focused on finding maximum biclusters with lower mean squared residue and higher row variance. Liu et al. [19] proposed a multi-objective immune biclustering (MOIB) algorithm for mining biclusters from microarray data based on the immune response principle of the immune system. Liu et al. [20] proposed a crowding distance based multi-objective Particle Swarm Optimization biclustering, it is based on heuristic search technique which simulates the movement of flocks of birds,aims to find the nearest neighbor based on crowding distance and –dominance which converges to the Pareto front and guarantees diversity of solutions. Sarkar et al. [21] have presented a review on Particle Swarm Optimization and shows that how well PSO hybridize with other clustering algorithms and yields better results in various optimization problems in terms of efficiency and accuracy. The implementation of this algorithm produce optimal number of cluster which results in better analysis of data when compared with other evolutionary algorithms such as Genetic Algorithm (GA) and
Simulated Annealing (SA). Das et al. [3] proposed an algorithm based on greedy search and Binary PSO for finding biclusters in gene expression data. In this method, first K-means algorithm is used to cluster rows and columns of the data matrix separately and then they are combined to form small tightly co-regulated submatrices. More genes and conditions are added to these seeds till the mean squared residue is less than 100 using a greedy method. The result obtained from greedy search is used for initializing the particles of PSO. This algorithm is implemented on the Yeast Saccharomyces cerevisiae cell cycle expression dataset which gives better result in terms of average condition number and average MSR in comparison to other algorithms.
-
III. Priliminary Concepts
Biclustering is used to cluster genes and conditions simultaneously. Many of the biclustering algorithms are used to develop compact biclusters which is represented as a 2D matrix where row represent genes and column represent samples or conditions and the elements of biclusters represents the expression value of a gene under that specified condition.
In general, a bicluster is defined as a submatrix в of a main matrix м where, there are п number of genes which is denoted as G =( 91. , д2 , ⋯ , 9t , ⋯ 9п ) as row set and т number of condition which is denoted as = (Ci, С2, ⋯ ,Су, ⋯ ) as column set, then a subset of row set i.e. I ⊂ G and subset of column set i.e. J ⊂ с collectively forms a bicluster as pair of genes and conditions as в ={(/1 , J 1),(/2 , J 2), ⋯ ,( 1Г , Jr )} . It is also known as co-clustering, bi-dimensional clustering and subspace clustering. Biclustering algorithms develops different types of biclusters [9] like constant bicluster in which whole bicluster has constant value, constant rows and constant column bicluster wherein either all rows are constant or all columns are constant and coherent biclusters, which is generally identified by many of the biclustering algorithms because it gives the more biological relevance than any other bicluster type. It also identifies a subset of genes and subset of conditions, both having coherent expression values and the degree of coherence of these biclusters are measured through mean squared residue or hscore. It is the sum of the squared residue score. The residue of an element Ьц of a submatrix Вц and is defined as follows:
RS ( btj )= btj - bij - bij + bi j (1)
where I is the row set, J is the column set, btj is the element of the submatrix, bij is the jth column mean, bij is the Ith row mean and bij is the whole submatrix mean. It also provides the difference between the actual value and the predicted value obtained through the row mean, column mean and whole mean of the submatrix for that element. From this residue score, the mean squared residue is calculated for any submatrix as:
MSR ( ви )=∑ t ∈ i , j ∈ j ( RS ( bu )2)/ | I | ∗ | J | (2)
MSR value is required to predict the quality of biclusters and its value should be low in comparison to the threshold value 5 i.e. MSR ( Вц )< 5 . The value of 5 depends on the dataset, and for yeast dataset the value of δ is 300.
-
IV. Proposed Technique
The proposed technique involves two basic phases, one is the seed finding phase and another is the seed growing phase. We have developed two algorithms for this technique which are implemented in Matlab tool box.
-
A. Seed Finding Phase
A simple seed finding technique is used in this algorithm [22]. The pseudocode for seed generation is illustrated in Algorithm I. Initially, gene clustering and condition clustering is done on the gene expression data matrix by using the K-means clustering algorithm and using the ‘sqEuclidean’ distance metric for computing the distance from the centroids to each vector. Here, instead of assuming the value of K randomly, we have computed its value from the dataset using the rule К≅n/√n. Further, it is taken into concern that each gene cluster must not have more than 15 genes and the condition cluster must not have more than 5 conditions and from the second iterations the distance metric for computing the distance is the ‘cityblock’. Then, the result obtained from the gene clusters and condition clusters are combined together to form small tightly bound submatrices or biclusters. These biclusters are called as seeds.
Algorithm I:
Input : × m gene expression matrix M
Output:
// T ℎ e number of gene clusters ℎ aving maximum // 15 genes ( kg )․ T ℎ e number of condition clusters // ℎ aving maximum 5 conditions ( kc )
-
1: Generate initial set of gene cluster Gc and condition cluster Cc using К - means clustering
-
2: forall Gt ∈ Gc do
-
3: if | I |>15 t ℎ en furt ℎ er divide gene cluster
-
4: endfor
-
5: forall Cj ∈ Cc do
-
6: if |]|>5 t ℎ en furt ℎ er divide condition cluster
-
7: endfor
-
8: Combine kg gene cluster and kc condition cluster to produce a set of kg × kc biclusters В ′
-
9: Compute MSR of eac ℎ bicluster in В ′
10․ if MSR ( Bt )≤ 8 t ℎ en В ← Bt
-
11: Encode eac ℎ bicluster in В using Fig ․1
-
12: Return В
-
B. Selection of Seeds Based on MSR
The selection of seeds which are obtained from the above mentioned phase is primarily based on the MSR value of each seed. This MSR value should be less than the predefined threshold value 6 , and the value of 6 is based on the dataset used. Yeast dataset is used in this paper and the value of 6 is 300. These selected seeds are used for the initialization of particles.
-
C. Encoding of Seeds
The seeds which are selected as the particles are required to get encoded in the form of fixed length strings [23]. Here, the length of string is in the form of ( n + m )
9i 92 ⋯ ⋯
Fig.1. Encoded bicluster where n is the number of genes and m is the number of conditions. A bit is set to one if the corresponding gene or condition is present in the bicluster, otherwise it is set to zero. It is a useful way of representation because it helps in addition and deletion of genes or conditions.
-
D. PSO Biclustering
PSO is an optimization algorithm in which flock of birds aimed to find food for them but they don’t know the exact location of food. Thus, all the members of the swarm are devoted throughout the search procedure to find the food. Here, each particle (bird) has to find the best solution from the given search space and is itself a potential solution and is initialized with a random velocity. Each particle maintains its position within the search space by keeping the track of its best position ( pbest ) and also keeping the track of its neighbor best position and accordingly changes its position towards the best position for obtaining the optimal solution, and the best position obtained from the entire swarm is called as global best ( gbest ) and all these information is stored in the history. Initially, each particle has its current velocity and current position. These particles iteratively update their position as well as their velocity by using the values of the ( pbest ) and ( gbest ) for reaching the optimal solution. In a m dimensional search space, the new velocity and the new position for the jth dimension of the Ith particle is updated by using the following two equations:
Vg ( t +1)=W ∗ va ( t )+С1Г1 ( pbest[j - Хц ( t ))+
СгЧ ( gbestj - xl$ ( t )) (3)
Хц ( t +1)= Xij + Vij ( t +1) (4)
where w is the inertia weight and the value of w is 0.72; Г1 , r2 are the random numbers which are in the range of [0,1] and Ci , C2 are the learning factors whose values are Cl=1.49 and c2=1.49. For the jth. dimension, Vtj ( t ) is the initial velocity of particle i at time t while X^- ( t ) is the initial position of particle i at time t . Vij ( t +1) is the new velocity of the particle i at time ( t +1) obtained by using equation (3) while Хц ( t +1) is the new position of particle i at time ( t +1) obtained by using equation (4). This process is repeated until the optimal solution is obtained and the velocity of each particle tends to zero, which shows that reaching to the goal velocity of each particle gradually becomes zero. The main advantage of PSO is that it doesn’t require any operators like mutation operator or crossover operator and it also has less parameter to adjust, unlike in evolutionary algorithms, as a result of which PSO converges very fast and gives optimal result. The pseudocode for our proposed PSO biclustering (PSOB) is illustrated in Algorithm II. Here, velocity is constrained in the interval [0,1] , and for keeping the velocity in this range, the rule for corresponding changes in the new position of particle i is obtained as shown in equation (5):
( t +1)={ 1, if r3 < vtj (1+1) (5)
0, ot ℎ ()
where r3 is a random number in the range [0,1] .
-
E. Initialization of Particle
PSO is usually initialized with a population of random solutions. However, in our proposed framework, we have initialized all particles with seeds generated through Algorithm I. Then, these particles are moving towards the optimal solution with the help of its personal best position ( pbest ) and the best position of the swarm ( gbest ) . Further, each particle is also initialized with a random velocity.
Algorithm II : ( В , 6 , P , Itermax )
// User specified, t ℎ res ℎ old value ( 8 ), Number of // particles ( P ), Maximum number of iteration // ( Itermax ), Number of iteration ( It )
-
1: It =1
-
2: for I :1→ P do
-
3: Initialize eac ℎ particle i wit ℎ seed i in В
-
4: Initialize velocity of eac ℎ particle randomly
-
5: endfor
-
6: repeat
-
7: for all particle i do
-
8: Compute t ℎ e fitness function using (6)
-
9: f t ℎ e fitness value ( Nbest ) is better t ℎ an t ℎ e best fitness value ( pbest ) t ℎ en pbest ← Nbest
-
10: endfor
-
11: Select t ℎ e particle wit ℎ best fitness value of all t ℎ e particles as gbest
-
12: forall particle i do
-
13: Compute particle velocity using (3)
-
14: Compute particle position using (4)
-
15: endfor
-
16: It = +1
-
17: until It ≤ Itermax
-
F. Fitness Function
The fitness of each particle is calculated with the objective to maximize the fitness function. Here, the motive is to develop large volume bicluster with low mean squared residue. The following fitness function is used here [24] to judge the quality of each bicluster В with size I ⨯ :
f ( в ( J, | I | ∗ | J |, if MSP ( В )≤ 6
-
7 ( ( , J ))={ 8 / MSP ( В ), ot ℎ erwise (6)
Here, the particles are initialized with the seeds attained by Algorithm I for faster convergence and to develop biclusters having large volume with less MSP value.
-
G. Updating Velocity and Position
The velocity and position of each particle is updated by using the equations (3) and (4) respectively so that the seeds can grow and more number of genes and conditions can be added to the seed, and the velocity of each particle moving towards the solution can gradually tends to zero. Through this procedure, the particles reach to the optimal solution by getting its velocity near to zero and with the correct path.
-
V. Experimental Result
-
A. Dataset Used
The proposed algorithms are implemented in Matlab, and the experiments conducted on preprocessed Yeast Saccharomyces cerevisiae cell cycle expression dataset for evaluating the efficiency of the proposed technique. This dataset is based on the Tavazoie et al. [25] in which there are 2884 genes and 17 conditions. The values of the dataset are in the integer forms that range from 0 to 600 and the missing values of the dataset are represented by-1. The dataset is downloaded from
-
B. Bicluster Plots
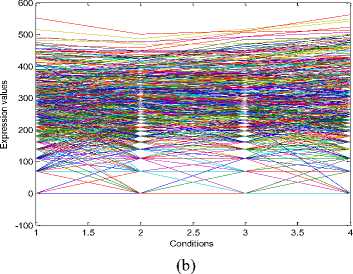
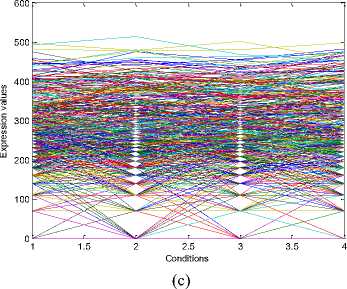
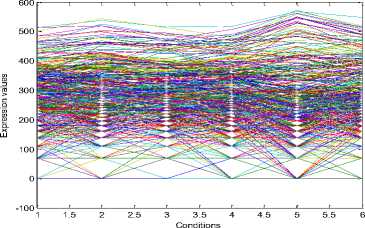
The experiments conducted on the Yeast Saccharomyces cerevisiae cell cycle expression dataset produce five biclusters. These biclusters are presented below in Fig. 2. The labels of these biclusters are Yb1, Yb2, Yb3, Yb4 and Yb5 and are having 695, 689,
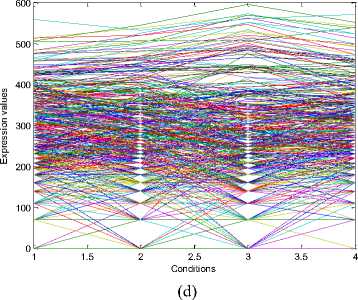
688,684 and 672 genes and also 6, 4, 4, 4 and 5
conditions respectively. The X axis of the plot denotes the conditions and the Y axis of the plot denotes the expression values of the genes. The bicluster plot signifies the number of genes along with the number of conditions belongs to one bicluster. The detailed description of these biclusters is shown in the Table 1. It shows the number of genes (NOC), number of conditions (NOC), bicluster volume (BV) and the mean squared residue value (MSR) of each bicluster. In order to produce good quality biclusters it is essential to have the large volume and less MSR value.
Table 1. Bicluster Information of Fig. 2
|
Biclus ter Label |
NOG |
NOC |
BV |
MSR |
|
Yb1 |
695 |
6 |
4170 |
1.1498 |
|
Yb2 |
689 |
4 |
2756 |
1.0768 |
|
Yb3 |
688 |
4 |
2752 |
1.118 |
|
Yb4 |
684 |
4 |
2736 |
1.0984 |
|
Yb5 |
672 |
5 |
3360 |
1.0166 |
(a)
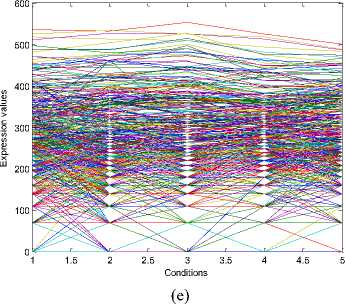
Fig.2. Five biclusters found for the Yeast dataset. X axis represents conditions and Y axis represents expression level of genes. (a) Bicluster – Yb1 (b) Bicluster – Yb2 (c) Bicluster – Yb3 (d) Bicluster – Yb4 (e) Bicluster – Yb5
-
C. Comparison with other Algorithm
Table 2 illustrates the comparison of various algorithms based on the Average Number of Genes
(ANG), Average Number of Conditions (ANC), Average Volume of Biclusters (AV), Average MSR value of biclusters (AMR) and the Largest Bicluster size (LB). The Performance of each algorithm like DBF [26], SEBI [27], CC [15], FLOC [28], and SGA [29] is compared with the PSO biclustering. It is essential for a good algorithm that all the fields like ANG, ANC, AV and LB should be of higher value and the value of AMR should be low. This shows that PSO biclustering algorithm is better than all other algorithms but the value of ANC is less than other algorithms values.
-
D. Significant Biclusters
Table 3 shows the details of significant biclusters that are having some common genes, which shows that these biclusters are the overlapping biclusters. Biclusters Yb2, Yb3 and Yb5 are the overlapping biclusters because they are having some common genes.
Table 2. Performance Comparison between PSOB and other Algorithms
|
Algorithm |
ANG |
ANC |
AMR |
AV |
LB |
|
PSOB |
685.6 |
4.6 |
1.09192 |
3154.8 |
4170 |
|
DBF |
188.00 |
11.00 |
114.70 |
1627.20 |
4000 |
|
SEBI |
13.61 |
15.25 |
205.18 |
209.92 |
1394 |
|
CC |
166.71 |
12.09 |
204.29 |
1576.98 |
4485 |
|
FLOC |
195.00 |
12.80 |
187.54 |
1825.78 |
2000 |
|
SGA |
191.12 |
5.13 |
52.87 |
570.86 |
1408 |
Table 3. Significant biclusters by PSO Biclustering
|
Bicluster Label |
NOG |
NOC |
MSR |
|
Yb2 |
689 |
4 |
1.0768 |
|
Yb3 |
688 |
4 |
1.118 |
|
Yb5 |
672 |
5 |
1.0166 |
E. The significant GO terms
In order to evaluate the proposed method in terms of biological significance, we have employed Yeast Saccharomyces cerevisiae Gene Ontology (GO) term finder [30] database which is available in the internet. Further, the statistical significance is evaluated for genes in each bicluster based on p-values that illustrates the matching of genes with different GO categories (function, process or components). This matching is better for smaller p-values, and these p-values are computed using a cumulative hypergeometric distribution. Table 4 illustrates the significant GO terms that are used to describe the genes comprising the biclusters of Fig. 2 for the process, function and component ontologies. These terms are described with increasing order of p-values or with the decreasing order of significance. Here, the process column entry for bicluster label Yb2 contains the term cytoplasmic translation (80, 4.40e-26) which means that 80 out of 689 genes are involved in the process of cytoplasmic translation and their p-value is 4.40e-26. Similarly, for bicluster label Yb3, 90 out of 688 genes are involved in the process of cytoplasmic translation, and for bicluster label Yb5, 88 out of 672 genes are involved in cytoplasmic translation. Further, 32 out of 689 genes in Yb2, and 42 out of 672 genes in Yb5, are involved in ribosomal biogenesis. Moreover, 28 out of 689 genes in Yb2, and 37 out of 672 genes in Yb5 are involved in maturation of SSU-rRNA. As a result, this table verifies that the biclusters contain biologically relevant genes, and the proposed algorithm is capable of identifying biologically significant biclusters from different GO categories.
The significant GO terms for the set of genes in bicluster Yb3 along with their p-values is further illustrated in Fig. 3. Here, the GO Term Finder [30] searches for significant shared GO terms, or parents of those GO terms in order to describe the relationship among a list of genes. It basically shows branching of a molecular function into sub-functions like structural molecular activity and binding. These sub-functions are further divided to generate the final result. Fig. 3 is generated by entering the names of the genes that comprise the bicluster Yb3 into the gene ontology database and then choosing the ontology function.
Table 4. Significant Shared GO Terms (Process, Function, Component) of biclusters shown in Fig. 2
|
Bicluster |
Process |
Function |
Component |
|
Yb2 |
Cytoplasmic translation(80, 4.40e-26), ribosomal small subunit biogenesis(32, 0.00071), maturation of SSU-rRNA(28, 0.00125), translation(103, 0.00402) |
Structural constituent of ribosome(80, 4.40e-26), structural molecule activity(90, 1.90e-17) |
Cytosolic ribosome(82, 2.07e-37), cytosolic part(86, 4.85e-29), ribosomal subunit(81,1.44e-24), ribosome(95,4.91e-21) |
|
Yb3 |
Cytoplasmic translation(90,2.13e-26) |
Structural constituent of ribosome(93, 3.66e-18), structural molecular activity(115,8.89e-13) |
Cytosolic ribosome(87, 8.99), cytosolic part(95, 1.49e17), ribosomal subunit(95, 5.96e-17), ribosome(119, 2.64e-15) |
|
Yb5 |
Cytoplasmic translation(88, 2.87e-26), maturation of SSU-rRNA(37, 0.00412), ribosomal small subunit biogenesis(42,00.466) |
Structural constituent of ribosome(90, 1.08e-17), structural molecular activity(113,2.54e-13) |
Cytosolic ribosome(86, 2.09e-24), cytosolic part(93, 9.80e-18), ribosomal subunit(92, 1.44e-16), ribosome(111, 4.26e-13) |
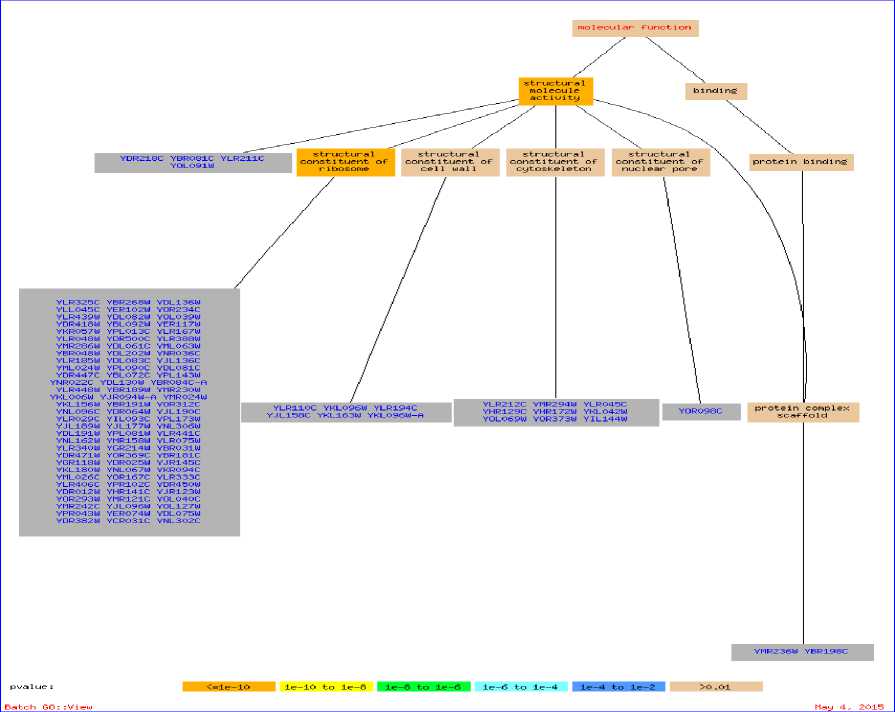
Fig.3. Samples of genes for the bicluster Yb3, with corresponding GO terms and their parents for Function Ontology
-
VI. Conclusion
Biclustering technique is used for finding the hidden patterns from gene expression data and it is a two-way clustering process in which clustering of genes and conditions are done simultaneously. In the proposed framework, two algorithms are employed in order to find good quality biclusters, those are having the large volume and low MSR value. These algorithms are seed finding algorithm and the seed growing algorithm. In the seed finding algorithm, K-means algorithm is used for finding seeds where the value of K is computed from the dataset instead of assuming it randomly, and the seeds which are having less MSR value than the threshold value 6 are selected. These selected seeds are used to initialize the PSO in which seed growing phase take place and more number of genes and conditions are added into the seeds based on the fitness function. The algorithm is implemented for Yeast Saccharomyces cerevisiae cell cycle expression dataset using MATLAB environment. It performs well in case of average volume and average MSR value of biclusters than some other biclustering algorithms. A comparative assessment of experimental results reveals the effectiveness of the proposed method. The biological significance of the generated biclusters is shown by employing gene ontology term finder database.
In the future, we plan to extend our PSO biclustering work in terms of fitness function, dynamic parameters, and optimization of inter-cluster and intra-cluster distances.
Acknowledgement
The authors would like to thank all anonymous reviewers for their valuable comments.
References A Framework for Mining Coherent Patterns Using Particle Swarm Optimization based Biclustering
- S. Das, “Mean Squared Residue Based Biclustering Algorithms for the Analysis of Gene Expression Data”, Ph.D. thesis, Department of Computer Science Cochin University of Science and Technology, 2011.
- X. Xu, “Data Minning Techniques in Gene Expression Data Analysis”, Ph.D. thesis, School of Computing National University Singapore, 2006.
- S. Das and S. Mary Idicula, “Greedy Search-Binary PSO Hybrid for Biclustering Gene Expression Data”, International Journal of Computer Applications, vol. 2, pp. 1-5, 2010.
- A. Mohamed and W. Ashour, “Efficient Data Clustering Algorithms: Improvements over K means”, International Journal of Intelligent Systems and Applications, vol. 3, pp. 37-49, 2013.
- K. Yugal and G. Sahoo, “A Review on Gravitational Search Algorithm and its Applications to Data Clustering and Classification”, International Journal of Intelligent Systems and Applications, vol. 6, pp. 79-93, 2014.
- M. B. Eisen, P. T. Spellman, P. O. Brown and D. Botstein, “Cluster Analysis and Display of Genome-Wide Expression Patterns”, Proceedings of National Academy of Sciences, vol. 95, pp. 14863-14868, 1998.
- H. Frigui and R. Krishnapuram, “A Robust Competitive Clustering Algorithm with Applications in Computer Vision”, Pattern Analysis and Machine Intelligence, IEEE, vol. 21, pp. 450-465, 1999.
- Y. Zhao and G. Karypis, “Empirical and Theoretical Comparisons of Selected Criterion Functions for Document Clustering”, Machine Learning, vol. 55, pp. 311-321, 2004.
- S. C. Maderia. and A. L. Oliveria, “Biclustering Algorithms for Biological Data Analysis: A Survey”, Transactions on Computational Biology and Bioinformatics, vol. 1, pp. 24-45, 2004.
- K. Bryan, P. Cunningham and N. Bolshakova, “Biclustering of Expression Data Using Simulated Annealing, Computer-Based Medical Systems, IEEE, pp. 383-388, 2005.
- I.S. Dhillon, “Co-Clustering Documents and Words Using Bipartite Spectral Graph Partitioning”, International conference on Knowledge discovery and data mining, pp. 269-274, 2001.
- Q. Sheng, Y. Moreau and B. D. Moor, “Biclustering Microarray Data by Gibbs Sampling”, Bioinformatics, vol. 19, pp. 196-205, 2003.
- K. James and E. Russ C., “Particle Swarm Optimization”, Proceedings of International Conference on Neural Networks, IEEE, pp. 1942-1948, 1995.
- J. A. Hartigan, “Direct Clustering of a Data Matrix”, Journal of the American statistical association, pp. 123-129, 1972.
- Y. Cheng and G.M. Church, “Biclustering of Expression Data”, International Conference on Intelligent Systems for Molecular Biology, pp. 93-103, 2000.
- C. A. Brizulea, J. E. Luna-Taylor, I. Martinez-Perez, H. A. Guillen, D. O. Rodriguez and A. Beltran-Verdugo, “Improving an Evolutionary Multi-objective Algorithm for the Biclustering of Gene Expression Data”, IEEE Congress on Evolutionary computation, pp. 221-228, 2013.
- L. Junwan and Y. Chen, “Dynamic Biclustering of Microarray Data with MOPSO”, IEEE International Conference on Granular Computing, pp. 330-334, 2010.
- J. Liu, Z. Li, X. Hu, Y. Chen, and E.K. Park, “Dynamic Biclustering of Microarray Data by Multi-Objective Immune Optimization”, BMC Genomics, pp. 1-7 , 2011.
- J. Liu, Z. Li, and Y. Chen, “Microarray Data Biclustering with Multi-objective Immune Algorithm”, Fifth International Conference on Natural Computation, pp. 200-204, 2009.
- J. Liu, Z. Li, X. Hu, and Y. Chen, “Biclustering of Microarray Data with MOPSO Based on Crowding Distance”, BMC Bioinformatics, pp. 1-10, 2009.
- S. Sarkar, A. Roy and B. ShyamPurkayashtha, “Application of Particle Swarm Optimization in Data Clustering: A Survey”, International Journal of Computer Applications, vol. 65, pp. 38-46, 2013.
- C. Anupam, “Biclustering of Gene Expression Data by Simulated Annealing”, International Conference on High-Performance Computing, IEEE, pp. 627-632, 2005.
- C. Anupam and H. Maka, “Biclustering of Gene Expression Data using Genetic Algorithm”, Computational Intelligence in Bioinformatics and Computational biology, IEEE, pp. 1-8, 2005.
- B. Xie, S. Chen and F. Liu, “Biclustering of Gene Expression Data using PSO-GA Hybrid”, International Conference on Bioinformatics and Biomedical Engineering, pp. 302-305, 2007.
- S. Tavazoie, J. D. Hughes, M. J. Campbell, R. J. Cho and G. M. Church, “Systematic Determination of Gene Network Architecture”, Nature genetics, vol. 22, pp. 281-285, 1999.
- Z. Zhang, A. Teo, B. Chin Ooi and K-L.Tan, “Mining Deterministic Biclusters in Gene Expression Data”, Proceedings at Bioinformatics and Bioengineering, IEEE, pp. 283-292, 2004.
- F. Divina and J. S. Aguilar-Ruiz, “Biclustering of Expression Data with Evolutionary Computation”, Knowledge and Data Engineering, IEEE, vol. 18, pp. 590-602, 2006.
- J. Yang, H. Wang, W. Wang and P. Yu, “Enhanced Biclustering on Expression Data”, Bioinformatics and Bioengineering, IEEE, pp. 321-327, 2003.
- S. Bleuler, A. Prelic and E. Zitzler, “An EA Framework for Biclustering of Gene Expression Data, Evolutionary Computation, IEEE, vol. 1, pp. 166-173, 2004.
- SGD GO Term finder [www.yeastgenome.org/cgi-bin/GO/ goTermFinder.pl].
