A goals cascading methodology in project-oriented company

Author: Nikulina N.O., Malakhova A.I., Batalova V.I., Barmina O.V.
Journal: Онтология проектирования @ontology-of-designing
Section: Методы и технологии принятия решений
Article in issue: 3 (45) т.12, 2022.
Free access
One of the most effective tools for managing a project-oriented company are the key performance indicators - quantitative indicators that allow to measure the degree of company's activities success through definition of strategic goals. In a project-oriented company, activities are implemented within projects execution. At the same time, each project has a set of parameters that characterize, on the one hand, the progress of the project (terms and cost of implementation, qualification of performers, frequency of changes in requirements), and, on the other hand - the final product (functionality, performance, usability and maintenance). It should be noted that a success of project implementation depends not least on the built in the company interaction processes, which make it possible to make decisions effectively to achieve the project goals. Visualization of the goals relations on the strategic map significantly facilitates the employees interacting at various levels and making management decisions in problem situations. Building a strategic map based on a balanced scorecard implies appointment of persons, responsible for achieving the target values of indicators, entering the correct values and monitoring the projects and its constituent processes implementation. This allows forming a project participants responsibility matrix, which, in turn, helps to determine a degree of performers workload when the processes execution, related to various knowledge areas. The authors' proposed method of cascading goals in a project-oriented company will allow building a project management system taking into account various factors affecting the success of its implementation. Cascading is based on building a hierarchy of a project-oriented company performance indicators in accordance with the hierarchy of projects of various types and scales. Using this approach contributes to improving the quality of a project-oriented organization strategic management due to the fact that strategic goals and its corresponding indicators are consistently decomposed to the level of tactical and operational management, and then concretized and adapted in structural divisions. A novelty of the proposed cascading technique lies in development of the projects hierarchy in terms of its implementation priority, as well as in use of project management knowledge areas in the company's strategic map.
Project-oriented company, strategic map, balanced scorecard, cascading goals, decision-making, key performance indicators (kpi), knowledge areas, project management
Short address: https://sciup.org/170195765
IDR: 170195765 | UDC: 004.9:65.015 | DOI: 10.18287/2223-9537-2022-12-3-367-379
Методика каскадирования целей в проектно-ориентированной компании
Одним из наиболее эффективных инструментов управления проектно-ориентированной компанией являются ключевые показатели эффективности - количественные показатели, позволяющие измерить степень успешности деятельности компании через определение стратегических целей. В проектно-ориентированной компании деятельность осуществляется в рамках реализации проектов. При этом каждый проект имеет набор параметров, характеризующих, с одной стороны, ход реализации проекта (сроки и стоимость реализации, квалификация исполнителей, частота изменений требований), а, с другой стороны - конечный продукт (функциональность, производительность, удобство использования и техническое обслуживание). Успех реализации проекта зависит и от процессов взаимодействия его участников. Визуализация взаимосвязей целей на стратегической карте, построенной на основе сбалансированной системы показателей, значительно облегчает взаимодействие сотрудников на различных уровнях принятия решений при возникновении проблемных ситуаций. Построение стратегической карты подразумевает назначение лиц, ответственных за достижение целевых значений показателей, мониторинг реализации проектов и составляющих их процессов. Это позволяет сформировать матрицу ответственности участников проекта, которая помогает определить степень загруженности исполнителей при выполнении процессов, относящихся к различным областям знаний. Предлагаемая авторами методика каскадирования целей в проектно-ориентированной компании позволит построить систему управления проектом с учётом различных факторов, влияющих на успех его реализации. Каскадирование основано на построении иерархии показателей эффективности проектно-ориентированной компании в соответствии с иерархией выполняемых проектов различного вида и масштаба. Использование данного подхода способствует повышению качества стратегического управления проектно-ориентированной организацией за счёт того, что стратегические цели и соответствующие им показатели подвергаются последовательной декомпозиции до уровня тактического и оперативного управления, а затем конкретизируются и адаптируются в структурных подразделениях. Новизна предлагаемой методики каскадирования заключается в разработке иерархии проектов с точки зрения приоритетности их реализации, а также в использовании в стратегической карте компании областей знаний проектного менеджмента.
Text of the scientific article A goals cascading methodology in project-oriented company
Decision-making is one of the most important management mechanisms that ensures the choice of how to achieve goals. According to the planning horizon, goals can be divided into short-term goals (its achievement is provided by making operational decisions and its subsequent realization), medium-term goals (its achievement is usually guaranteed by making tactical decisions) and longterm goals (provided by strategic decision-making). This separation helps to understand better the roles, tasks, and features of management activity at each level.
Strategic decisions are made by the company's management in the event of global problems, a sign of which is deviation of the key performance indicators from the planned ones due to such changes in the external environment that affect the industry, national or global economy. Such problems require a thorough diagnostics and analysis of the internal and external environment factors and elaboration of a further strategy.
Tactical problems are the mid-level problems, that represent contradictions between the medium-term goals of the company and its current state, and usually affect several functional departments. Such problems are solved by adjusting the strategy, developing tactical plans within the framework of the current strategy, or making minor changes to it. Decisions are made collectively at the level of the heads of functional departments with notification of the company's management.
Operational problems are problems that arise within individual functional departments. A frequency of such problems is significantly higher than tactical and global ones, and it requires making operational decisions in a limited time. Heads of functional departments and direct executors can make large number of such decisions in one day.
The problems of types above are closely interrelated. Delay or error in decision-making negatively affects adjacent areas of activity. If all employees of the company clearly understand this relationship, and are also aware of how their activities affect the achievement of goals at various levels, it can be stated with great confidence that organizational interaction has been established in this company. A lot of research has been devoted to interaction organization in companies in order to increase the efficiency of their activities. People are not robots, everyone has their own psychological characteristics that affect the work in a team. A task of the good leader is to take into account personal and professional characteristics of each employee when forming a project team, and in the course of problems to understand what is causing them. The [1] provides general recommendations for managing large software projects, including the distribution of roles in project teams. In [2], the authors proposed a methodology for assessing the contribution of each project team member to achieving the goals of IT project. This article is continuing the study, in which the authors draw attention to the relationships between decision-making levels and performance targets for individual performers, project teams and the company as a whole.
1 Decision-making specificity within the project activity organization in IT company
The issues of decision-making at different hierarchical levels are considered on the example of IT company, specializing in service maintenance of large manufacturing enterprises. Its main activity areas are system integration, technological processes automation, development and implementation of information systems, creation of complex infrastructure and unified information field for the customer. The work mainly has a project nature: the contracts are concluded and extended for development, modification, implementation, and support of information systems functionality. The same project employs specialists from different departments, which is due to the presence of a matrix organizational structure of the company's management. Employees are combined in project teams, where they implement certain roles according to the accepted development methodology. For the most part, project teams use Agile development methodologies [3], most often Scrum [4].
Following this methodology allows to provide the customer a workable product with new business opportunities, for which the highest priority is determined, for a fixed small time intervals, called sprints.
In accordance with the Scrum methodology, the following roles are defined in the project team:
-
a) Product Owner is responsible for the list of product requirements and the result of the team's work;
-
b) Scrum Master is responsible for organizing an effective development process;
-
c) Development Team is a cross-functional team of universal interchangeable developers. In practice the following functional responsibilities are distinguished: analyst; architect of the system; programmer; tester; database specialist; technical writer; expert.
Since the matrix organizational structure supposes involving the employees from the same functional units in different projects in different roles, it is inevitable that projects will struggle to allocate all types of resources, including labor. A process of resources distribution begins while project initiation as contracts on providing the IT services are concluded, and also repeats during the project implementation in case of a lack of resources. At the same time, since several projects are running simultaneously, it is necessary to answer the question: “Which of the projects has priority, taking into account all the specified restrictions?” This question is solved by the deputy head of the company – the head of the software development department, who oversees the implementation of all the company's projects.
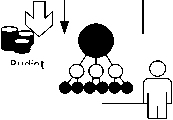
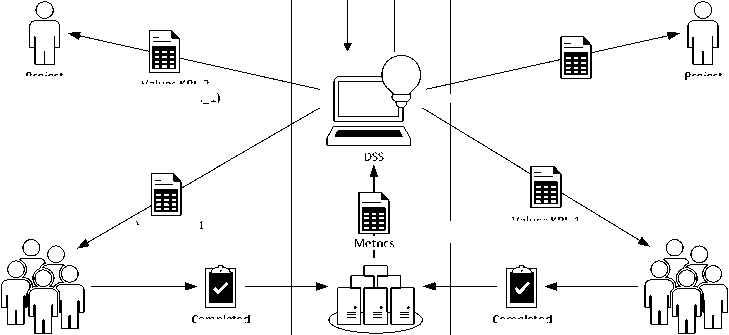
A scheme of interaction between the parties within allocation of resources between projects is as follows (figure 1). At the beginning of the financial year conclusion of contracts with customers for providing IT services is initiated). A head of the department requests data on the current state of affairs from project managers (product owners from each Scrum team). Often this can be an informal request, and the response is not documented anywhere.
Product owner, in turn, asks the performers for the specific details, collecting the most complete view of the project as a whole and of the main business tasks, making clarifying requests to individual members of the development team. The team can only provide data on the completed functionality (a completeness of the project backlog, that is, the general list of functionality to be realized) from the task control and code versions system. The aggregated data is collected by the product owner in the infographic and is sent to the head of the department.
The head of the department, based on expert assessment, allocates resources to the projects. According to the made decisions is formed a document called “Calculation of the contract value”, in which the details of labor and material resources distribution for the each of the project stages is specified. The document is passed to the customer and brought to the project managers, who plan the works for each of the project teams according to the specified deadlines.
Collected data provides information about the amount of work that the team has completed by a certain deadline, but it does not provide understanding the reasons of deviation from the project plan, although it is exactly the delays from the plan, that motivates the product owner to request additional resources. Therefore, it is necessary to understand why the actual state of the project affairs is worse than the planned parameters. This requires a more detailed analysis of the reasons – a research process is started, which generates stress in the project team and distracts from the development process as a whole. So trying to understand why there are not enough project resources leads to an even greater delays from the plan.
The fact is that neither the team as a whole, nor the head of the department, has understanding why the project is lagging behind the plan and what the real reason is. Even if some members of the project team or the head of the department have such understanding, it is difficult to capture this knowledge for effective use in the future. Therefore, the head of the department, based on his own expert assessment, distributes and redistributes resources for projects.

Customer

Contract
IT services pr

Project-estimate Documentation

Resources
Budjet
Head of the Department

Resources
Software development department
Project N
Request
Project 1
Project 2
KPI_3 (based on KPI_2)
Metrics
Values KPI_2 (based on KPI_1)
Completed Task
Task control and code versions system
Completed Task
Development Team Project 1
Development Team Project 2
Project
Manager 1
Values KPI_2 (based on KPI_1)
Values KPI_1
Values KPI_1
Project
Manager 2
...
Figure 1 – A scheme of the projects resources distribution process
Thus, the process of resources distribution between parallel projects can be not only lengthy, but also difficult to assess objectively and involves solving the large amount of tasks in conditions of uncertainty. The head of the department does not have concrete data to make certain conclusions, and even if the data is provided from the lower levels – they may be too optimistic or corrected.
The problem of data fragmentation and inaccuracy can be solved by using ontological engineering technologies [5-7]. But first of all, it is necessary to design and carefully configure a balanced scorecard for the whole company and for the each project separately, in order to have an opportunity to make comparative analysis of achieving the planned goals in projects, competing to access the resources.
2 Connection of the project management and the organization strategic maps
A balanced scorecard building is usually carried out for typical business processes of the company and is developed for a long-term period, taking into account the stability of the process [8]. However, modern business processes are becoming more dynamic, individual, configurable, and projects, on the contrary, are becoming more typical, have iterations by analogy with the business process [9].
In the context of the company’s project-oriented activity, organization of collective decisionmaking support is relevant [10-11]. One of the most important stages here is to identify interacting projects and prioritize them in case of conflicts over the allocated resources [12] (see figure 1).
In accordance with his competence, the product owner tries to plan each sprint taking into account mentioned above goals and stages of the works, and strategy, agreed with the head of the department. However, the sprint lasts not more than 2 weeks. During this short period, it is rarely possible to fully implement the stage with the stated goal. Therefore, large blocks of tasks are needed to be planned for the future with braking down by sprints, and at each of the planning procedures it should not be forgotten about the plan. But, if these plans are not fixed anywhere, then the project team is not informed about it. Consequently, employees do not have an understanding of the ultimate goal, as well as an importance of their role in the project in which they participate in the context of the entire company strategy.
In general, the final decision is very subjective – the direct project executors do not participate in the planning process, although they can better understand what the project needs at this stage, what points can be improved, how to objectively assess the time and labor costs for specific tasks. Difficulties also arise with evaluation of made decisions results – it is impossible to determine how the planned actions affected the project – positively, neutrally or negatively. This kind of knowledge in the field of project task planning remains only in the memory of a particular person.
However, the difficulty in this case is in the method of detecting the lack of the resources on any of the parallel projects, as well as in determining the impact of this factor on the target indicators of these projects, as well as on the targets of the company as a whole. Therefore, it is proposed to record in the ontological knowledge base of decision support system the current and planned values of project indicators and the responsibility matrix, taking into account the employees project roles.
Accumulation of such data in the form of decision-making cases will provide more clear information for analysis and subsequent decision-making. Steady repetition of cases leads to formation of the decision-making rules, so basing the experience of previous years, it will be possible to make certain conclusions – to form new rules on the base of cases intellectual analysis for supporting decision-making.
For example, for the project “Development of new software products” some of the following cases are recorded in the ontological knowledge base:
Case-1: Development_of_new_software_products(?x), Defect_correction_time(?y), has_indicator(?x,?y) -> has_planned_value_in_percent(?y, lessThan 20).
Case-2: Development_of_new_software_products(?x), Defect_correction_time(?y), has_indicator(?x,?y) -> has_actual_value_in_percent(?y, 30).
Case-3: Development_of_new_software_products(?x), Employee(?y), has_participant(?x,?y) has_quavification(?y, “high”), has_work_experience_with_the_customer(?y, min), Lagging_behind the_plan_indicator_values (?z), has(?x,?z) -> has_cause(?z,?y).
On the base of these cases intellectual analysis it could be formed in time the certain rules:
Rule-1: Development_of_new_software_products(?x), Employee(?y), has_quavification(?y, “high”), has_work_experience_with_the_customer(?y, max) -> to_make_participant(?x,?y).
Rule-2: Development_of_new_software_products(?x), Employee(?y), has_quavification(?y, “high”), has_work_experience_with_the_customer(?y, min), to_make_participant(?x,?y), Action(?z), has(?x,?z) -> has(?z, “In-crease_the_probationary_period_of_new_employees).
These rules show, that during the allocation of resources for the projects of new software products development it would the best decision for the head of the department to involve participants that have not only high qualification for executing the project tasks, but also the work experience with the particular customer.
Cascading of goals is proposed to be performed in accordance with the following algorithm. For convenient perception cascading of goals was performed for the one of the IT company activities – “Development of new software products”. To apply the proposed methodology in practice it is necessary to have a software tool for building a strategic map according to the BSC methodology (in this study Business Studio was used), an ontology editor for building a knowledge base and a project management system, in which the main project parameters and tasks are fixed and presented hierarchically.
The following goals cascading methodology for the direction “Development of new software products” is proposed:
-
1) identify as a top-level goal (long-term, strategic goal) a project balance support as a whole and the corresponding KPI “Project balance”;
-
2) identify as sources for med-level goals (medium-term, tactical) project constraints: project content (Scope), schedule or deadlines (Schedule) and cost (Budget). Ultimately, changes in the time, cost, and content affect the project product quality (Quality, Ql). In addition, project product quality is affected by such restrictions as risks (Rs), resources (Kc), communication (Cm). So a project is: Project =
[13]. Tactical goals, or rather its KPIs, serve as the information sources for project managers/product owners (on Scrum [14]); -
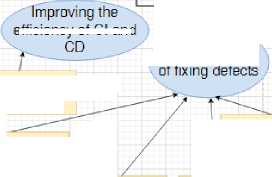
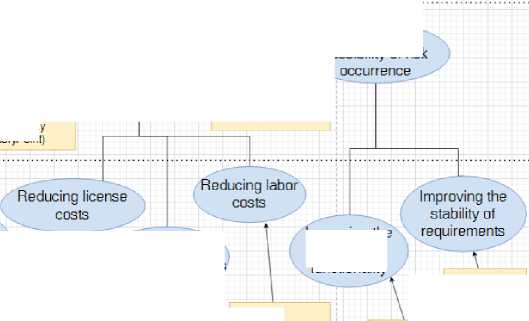
3) identify the goals of the project team as the lower-level goals in accordance with the terminology of the development methodology adopted in the company. The indicators will, in one way or another, provide information about the same types of activities, but the difference in terminology may confuse the reader. Here we will rely on the terms of Scrum methodology [3]. As a lower level, the indicators of a software project management effectiveness, grouped by knowledge areas, are selected [13, 15]. As a result a hierarchy of project-based consulting company goals is obtained, presented in the form of the balanced scorecard strategy map (figure 2).
Balance of the project
I m proving software quality
Company
management level (Head of the Department)
7 77 7 Projects leadership level (Prbduct Owner)
Reducing implementation and delivery time of functionality
Time of implementation and delivery conv. units of functionality (StoryPoint) - Delivery time (ETD -estimated delivery time)
Reducing time
Time tram comm it to deployment (GTD)
efficiency of UI anc
Time to fix a defect of importance "Mecium"
Improving the productivity of the development team
Time to fix a defect of importance "Critical"
Time to fix a defect of importance 'High"
Time to fix a defect of importance Low"
Project team / performers level
Execution time of a concitional unit of functionality (StoiyPoint)
Cost of correcting the consequences ot risks
Cost ot implementation of conv. units of functionality (StoiyPoint;
Reducing the possibility of risk
Reducing the cost of implementation and delivery of functionality
Reducing team . maintenance costs
Labor costs for 1 conventional unit ot functionality (StoryPoint)
The cost of maintaining a team per 1 conventional unit of functionality (StoryPoint)
Density of ctefects
Sprint Backlog Stability Index

Expenses for licenses for 1 conventional unit of functionality (StoryPoint)
Improving the quality of functionality
Figure 2 – Balanced scorecard strategic map for the software quality improvement
This figure shows a fragment of the IT company activities strategic map for development of new software products, which focuses on achieving the goal “Reducing implementation and delivery time of functionality". A strategic map is a hierarchy of goals (represented as ovals) and related indicators of its achievement (represented as rectangles). A complete strategic map for the considered direction is given in [2].
-
4) Strategic management is closely linked with the strategic map of the company and the strategic initiatives that are the set of independent additional projects and programs with defined deadlines, implemented outside the daily organization activities, whose purpose – to help the company achieve the targeted results;
-
5) compare the KPI with the functional hierarchical work structure for a typical sprint in a software/module development or implementation project. Each KPI is associated not only with a goal, but also with the particular works that allow it to be achieved (table 1). The hierarchy of tasks for developing a software product is determined by the methodology used in the company, for example, in [2] a hierarchical structure of works is used in accordance with PMBoK [13]. Thus, we will get information about what KPIs the project team is striving for at a particular working stage;
-
6) create a responsibility matrix for the project participants, defining the roles of each of them at each stage. Each project participant can perform different roles at different stages:
-
■ R (responsible) - is fully responsible for the stage/task execution, has a right to make decisions on implementation method;
-
■ E (executor) - executes a task, is not responsible for the method’s choice for it solving, but is responsible for the quality and deadlines;
-
■ C (consultant) - provides consulting services while the project tasks solving;
-
■ O (observer) - can consult while the project tasks solving, is not responsible for the result.
Metrics of the works execution processes will be recorded and transmitted to the decision support system (DSS), which will calculate KPIs at all levels and analyze a possibility of forming rules from used cases [16]. For the correct rules generation, it is also necessary to fix in the DSS responsibility matrix for typical project tasks. Work stages are distributed among the project participants in accordance with their roles (table 1). According to the structure of goals and KPIs, laid down in the system, a related KPI for each of the work stages is indicated. Table 2 contains the mid-level KPIs, achievement of which depends on the work of the project development team (lower-level KPIs). The output data will be the KPI values of each of the hierarchy levels with the possibility of descending to a lower level, up to individual metrics. It should be noted, that in table 1 the certain work stage is highlighted and in table 2 the most important corresponding KPIs, for which the project team members are responsible, is presented.
Table 1 – Project Responsibility Matrix
|
Element of WBS (Work Breakdown Structure) |
Participants (concrete employees) |
|||||||
|
Product Owner |
Product Development Team |
|||||||
|
Analyst |
Architect of the system |
Programmer |
Basist |
Tester |
Expert |
Scrum Master |
||
|
Requirements collection and development of technical specification (TS) |
C |
R |
C |
O |
O |
– |
O |
C |
|
Design |
– |
E |
R |
C |
C |
– |
O |
C |
|
Prototype deployment |
C |
O |
C |
E, R |
E |
E |
O |
C |
|
Pilot operation |
C |
C |
C |
E, R |
E |
E |
– |
C |
|
System deployment |
C |
E |
C |
E, R |
E |
E |
– |
C |
|
System commissioning |
C |
R |
O |
O |
– |
E |
– |
C |
|
Project completion |
R |
C |
– |
– |
– |
– |
– |
C |
Table 2 – Compliance of the mid-level KPIs and those responsible for its achieving
|
KPI |
Participants (concrete employees) |
|||||||
|
Product Development Team |
||||||||
|
Product Owner |
Analyst |
Architect of the system |
Programmer |
Basist |
Tester |
Expert |
Scrum Master |
|
|
Requirements stability index |
+ |
+ |
+ |
|||||
|
Proportion of functional improvements by the reason of changed/new requirements |
+ |
+ |
+ |
|||||
|
Duration of collective work |
+ |
+ |
+ |
+ |
+ |
|||
|
Stakeholders engagement |
+ |
+ |
+ |
+ |
||||
|
Number of missed requirements |
+ |
+ |
+ |
+ |
||||
|
Burning time |
+ |
+ |
+ |
+ |
+ |
+ |
||
|
Accuracy of task evaluation |
+ |
+ |
+ |
+ |
+ |
+ |
||
|
Level of activities timeliness |
+ |
+ |
+ |
+ |
+ |
+ |
||
|
Defects density |
+ |
+ |
+ |
+ |
||||
|
Technical debt ratio |
+ |
+ |
+ |
+ |
||||
|
Number of tasks that team can perform per a time unit |
+ |
|||||||
|
Average speed |
+ |
+ |
+ |
+ |
+ |
+ |
+ |
|
|
Project ETD (estimated time of delivery) |
+ |
+ |
+ |
+ |
+ |
+ |
+ |
|
|
Impact of difficulties |
+ |
+ |
+ |
+ |
+ |
+ |
+ |
|
|
Average cost of defect correcting |
+ |
+ |
+ |
+ |
+ |
+ |
+ |
|
During the methodology developing process the algorithms for calculating the main KPIs for the goals of the middle level “Reducing the functionality delivery realization time” and “Reducing the implementation and functionality delivery cost” (see figure 2) were derived (table 3). For the calculating purposes as a conventional functionality unit was taken a StoryPoint. Backlog items are measured in StoryPoints depending on its complexity.
On the base of the KPI of the lower level, it is possible to calculate the KPI of the upper level.
For example, realization and delivery time of conventional functionality unit (StoryPoint) will be calculated using the formula:
ETD = CTD + Weighted average (Sum (t criticai + t high + t ow + t middie )) (1)
When having data on the dynamics of the KPI of each of the projects and established for them responsibility matrices, that is, data on the participant workload (a concrete employee), we can get information about the success of resource distribution between the projects. Accumulation of such information helps to make more effective decisions based on the obtained experience [17-20], and also allows to adjust the course of project development in time.
Table 3 – KPIs Calculating Algorithms for the Multiple Mid-level Goals
|
KPI |
Calculating Algorithm |
|
Time from commit to deployment (CTD – Commit To Deployment) |
CTD = Date and time of the release installation on the customer's servers – Date and time of the first commit in TFS, related to the functionality |
|
Time to fix a defect of importance "Critical" |
t critical = Fixed date and time of the defect with importance “Critical” in TFS – Date and time of converting the defect to the status “Done” |
|
Time to fix a defect of importance "High" |
t high = Fixed date and time of the defect with importance “High” in TFS – Date and time of converting the defect to the status “Done” |
|
Time to fix a defect of importance “Low” |
t low = Fixed date and time of the defect with importance “Low” in TFS – Date and time of converting the defect to the status “Done” |
|
Time to fix a defect of importance “Middle” |
t middle = Fixed date and time of the defect with importance “Middle” in TFS – Date and time of converting the defect to the status “Done” |
|
Implementing time of conventional functionality unit (StoryPoint) |
t SP_done = Average (Sum (Fixed date and time of the Backlog item in TFS – Date and time of converting the Backlog item to the status “Done”) / Number of StoryPoints)) |
|
Expenses for licenses for 1 conventional unit of functionality (StoryPoint) (StoryPoint) |
SL = License expense for the period / Number of StoryPoints functionality, completed during the period |
|
The cost of maintaining a team per 1 conventional unit of functionality (Story Point) |
S T = Team maintenance costs for the period / Number of StoryPoints functionality, completed during the period |
|
Labor costs for 1 conventional unit of functionality (StoryPoint) |
S C = Number of working hours for the period * Total rates of the all project team employees / Number of StoryPoints functionality, completed during the period |
Conclusion
Quality is the most important characteristic of the project product. Customer expects to get the best result from the executor within the existing restrictions. In developing and maintaining of large software complexes, it is necessary to have metrics for monitoring the status of the project and a flexible system for periodic planning of control actions in order to keep a given level of quality. Proposed by the authors goals cascading methodology makes it possible to link the goals, set for the each participant of the project team, with the goals of the project and the company as a whole. It helps to identify the relationship between the deterioration of any kind of indicator and a cause of this phenomenon, since the values of the lower-level KPIs affect the values of the upper-level management KPIs.
In this case, timely tracking of the project status metrics deviation from the specified parameters allows:
-
1) to provide monitoring a current status of projects, running in parallel;
-
2) to determine a degree of individual employees responsibility for changing the project indicators;
-
3) to adjust promptly the vector of each project evolution;
-
4) to focus the manager's attention on the causes of deviations.
Monitoring of project KPIs is carried out in a software tool where a strategic map is built, which allows to link goals, tasks, indicators and employees and track deviations of indicator’s actual values from planned values during any period of time. To find out the reasons for the deviations, product owner refers to the knowledge base, which contains information about the project execution cases.
This approach will give a necessary flexibility of the product life cycle, which is needful in conditions of modern market competition.
References A goals cascading methodology in project-oriented company
- Archibald R. Management of High-Tech Programs and Projects / Russell D. Archibald; per. from English Ma-montova E.V. [In Russian]. Мoscow: DMK Press; IT co, 2010, 464 p.
- Nikulina NO, Malakhova AI, Batalova VI. Methodology for assessing the contribution of project team members to achieving the goals of the IT project [In Russian]. Information and mathematical technologies in science and management. 2021; 2(22): 94-104. DOI:10.38028/ESI.2021.22.2.010.
- Kon M. Agile. Project evaluation and planning [In Russian]. Мoscow: Alpina Publisher, 2018, 418 p.
- Sutherland J., Scrum. The revolutionary method of project management [In Russian]. Мoscow: Mann, Ivanov and Ferber, 2016, 186 p.
- Guarino N, Giaretta P. Ontologies and Knowledge Bases. Towards a Terminological Clarification. In: Towards Very Large Knowledge Bases. N.J.I. Mars (ed.), IOS Press, Amsterdam, 1995.
- Yerzhenin RV, MasselLV, Ontological approach to the knowledge representation about the methodology of modeling a complex control system [In Russian]. Ontology of designing, 2020; 10(4): 463-476. DOI: 10.18287/22239537-2020-10-4-463-476.
- Gavrilova TA, Kudryavtsev DV, Muromtsev DI. Knowledge Engineering. Models and methods [In Russian]. St. Petersburg: Publishing House "Lan", 2016, 324 p.
- Kaplan R, Norton D. Balances Scoredcard [In Russian]. Moscow: Olimpbusiness, 2003, 342 p.
- Barmina OV, Nikulina NO, Intelligent system for interactive business processes management in project-oriented organizations [In Russian]. Ontology of designing, 2017; 7(1): 48-65. DOI: 10.18287/2223-9537-2017-7-1-48-65.
- Huali Tang, Shoufu Wan, Cong-Cong Li, Haiming Liang, Yucheng Dong. Consensus Reaching Process in the Two-Rank Group Decision-Making with Heterogeneous Preference Information. International Journal of Computational Intelligence Systems, 12 February 2021.
- Xiujuan Ma, Zaiwu Gong, Weiwei Guo, Optimisation of Group Consistency for Incomplete Uncertain Preference Relation. International Journal of Computational Intelligence Systems, 2020; 13(1): 130-141.
- Chernyakhovskaya LR, Malakhova AI, Nikulina NO, Batalova VI. Information and analytical collective decision-making support using intelligent technologies. Journal of Physics: Conference Series, Volume 1864 (2021) 012090, 13th Multiconference on Control Problems (MCCP 2020) 6-8 Oktober 2020. IOP Publishing. DOI: 10.1088/1742-6596/1864/1/012090.
- A guide to the project management body of knowledge (PMBoK), Sixth ed. / Project Management Institute, Inc., 14 Campus Boulevard, Newton Square, Pennsylvania 19073-3299 USA, 2017, 756 p.
- Loeffler M. A Retrospective in Agile. Proven methods and innovative approaches [in Russian]. Moscow: Mann, Ivanov and Ferber, 2020, 336 p.
- Chernyakhovskaya L, Nikulina N, Barmina O. A balanced scorecard forming method for efficiency assessment of the software projects management. Proceedings of the 7th Scientific Conference on Information Technologies for Intelligent Decision Making Support (ITIDS 2019). https://doi.org/10.2991/itids-19.2019.16.
- SWRL: A Semantic Web Rule Language Combining OWL and RuleML. National Research Council of Canada, Network Inference and Stanford University, 2004.
- Phelps C, Heidl R, Wadhwa A. Knowledge, networks, and knowledge networks a review and research agenda. Journal of Management, 2012; 38(4): 1115-1166.
- Alavi M, Leidner DE. Knowledge management systems: issues, challenges, and benefits. Communications of the AIS, 1999; 1(2es): 1-28. DOI:10.17705/1CAIS.00107.
- Lillehagen F, Krogstie J. Active Knowledge Modelling of Enterprises. Springer, 2009, 436 p.
- Maier R, Hadrich T, PeinlR. Enterprise Knowledge Infrastructures: 2nd Edition. Springer, 2010, 460 p.
