A Novel Big Data Approach to Classify Bank Customers - Solution by Combining PIG, R and Hadoop

Author: Lija Mohan, Sudheep Elayidom M.
Journal: International Journal of Information Technology and Computer Science(IJITCS) @ijitcs
Article in issue: 9 Vol. 8, 2016.
Free access
Large amount of data that is characterized by its volume, velocity, veracity, value and variety is termed Big Data. Extracting hidden patterns, customer preferences, market trends, unknown correlations, or any other useful business information from large collection of structured or unstructured data set is called Big Data analysis. This article explores the scope of analyzing bank transaction data to categorize customers which could help the bank in efficient marketing, improved customer service, better operational efficiency, increased profit and many other hidden benefits. Instead of relying on a single technology to process large scale data, we make use of a combination of strategies like Hadoop, PIG, R etc for efficient analysis. RHadoop is an upcoming research trend for Big Data analysis, as R is a very efficient and easy to code, data analysis and visualization tool compared to traditional MapReduce program. K-Means is chosen as the clustering algorithm for classification.
BigData Analysis, Bank customer classification, Hadoop, PIG, R
Short address: https://sciup.org/15012552
IDR: 15012552
Text of the scientific article A Novel Big Data Approach to Classify Bank Customers - Solution by Combining PIG, R and Hadoop
Published Online September 2016 in MECS DOI: 10.5815/ijitcs.2016.09.10
Emergence of Internet and World Wide Web (WWW) caused the flooding of large amount of data. This data characterized by its volume, velocity, veracity, value and variety is termed BigData [41]. Big Data contains terra bytes or peta bytes of data and it can be structured or unstructured. Big Data Analysis is very much crucial as it leads to more accurate analysis. Accurate analysis is the back bone of accurate decision making. Accurate decision making leads to operational efficiency and cost and risk reduction in industries.
Traditional client server architecture seems inefficient to tackle big data. Hadoop comes to rescue here. Hadoop is a distributed processing framework from Apache which can store and process data in a parallel processing manner.
-
A. Motivation
This article identifies an application of BigData analytics to classify bank customers. Every bank will maintain a secret, customer profile to cross check the risk perception of customer. This customer classification is necessary for many reasons.
-
• To identify if the customer furnishes wrong information about himself.
-
• If the customer does not re-pay the loans on time.
-
• To restrict loans and credit card issue to high risky customers
-
• To correctly predict apt customers for their products and policies, thus leading to excellent target based marketing.
-
• Productive marketing thus leads to the profit of the
banks etc.
Classification done based on the current salary, assets he own etc may not be an actual reflection of the customer behavior. People who possess valuable assets may show reluctance to pay back the loans on time. Hence this article tries to classify the customers based on their previous transactions. Here we include information such as how many loans he already possesses, how many have re-payed etc for better classification. The challenge here is to mine valuable information from transactions which ranges from terra bytes or peta bytes of information.
In this article, we consider bank transactions as Big Data and provide a Big Data approach to solve the problem of customer classification. As per our knowledge, it is the first time in literature to solve the problem of customer classification using a Big Data approach. We combine PIG and R on Hadoop platform to do the classification.
Advantages of solving the problem in a Big Data environment:
-
• All the hardware related tasks will be handled by
the Hadoop framework itself. Eg: Checking whether all nodes are up, transferring a job in case of failure, selecting a node with less overhead etc.
-
• Programmer can concentrate more on programming.
-
• Task can be completed in minimum time.
-
• Scalability is ensured
-
• Accuracy of classification is increased as training data is large
-
• Efficient system development
-
• PIG, R etc can be programmed by a person who do not even know map reduce programming principles
-
II. Background and Literature Review
There has been several classification models developed both in literature and academia to categorize banking customers based on their transactions performed. Several techniques like Support Vector machines [15,16], Decision trees [30, 31], Neural network based models [17, 18], Abnormal detection [26, 27], Optimizations [28], Bayesian models [24], Rule based models [22, 23], Nearest neighbor approaches [21], Pattern recognition algorithms [25], Hybrid approaches [29] etc were proposed, but all of these methods depends on the actual input data that it could receive to classify the customers accurately. As the amount of training data increases, the accuracy of classification also increases. But if the amount of data increases beyond a limit, training and optimizations becomes very difficult and time consuming. Apart from traditional client server architecture, a distributed processing system which is capable of processing large amount of data can come to rescue here. Hadoop [32] is a distributed processing frame work provided as open source by Apache. Data processing applications like Mahout, PIG, HIVE, R etc can be integrated with Hadoop to handle Big Data. Map Reduce [33] programming is followed in Hadoop.
Hadoop is widely used in applications where large scale data processing is necessary. Customer feedback analysis [36], social media analysis [38], ad-targeting [39], data warehouse modernization [34], operation analysis [35], fraud detection [37] etc are the wide spread applications of big data analysis. Apart from literature, hadoop is gaining so much popularity in industries for Market Basket Analysis and Pricing Optimization, Credit risk, Compliance and regulatory reporting, Merchandizing and market analysis, Behaviour-based targeting, Supply-chain management and analytics, Market and consumer segmentations, Fraud detection and security analytics, scoring and analysis, Customer Segmentation, Risk analysis and management, Medical insurance fraud, CRM, Trade surveillance and abnormal trading pattern analysis, Games Development, Clinical trials, Drug development analysis, Patient care quality analysis, Disease pattern analysis etc.
This article proposes a method to classify the bank customers using Hadoop framework. Classification is done based on the transactions performed by the customers. Transactions analysis is tedious as the size of input data is very huge. According to the RBI statistics [40], in a single month, a bank will have to handle approximately 8,00,00,000 transactions which is not possible using traditional client server processing. Thus we approach this problem as a BigData problem and propose a solution based on Hadoop, PIG and R. The next section gives an overview of Hadoop, Pig and R. Clustering method adopted is K-Means clustering. But based on the application requirement it can be changed to SVMs, Neural Networks or Decision Trees. But for simplicity here we adopt K Means clustering.
-
A. Hadoop – An Architecture to process BigData
Hadoop [13, 14] is an open source distributed processing framework from Apache, for storing large amount of data on huge number of commodity clusters. Key features that make hadoop suitable for processing large scale data is its flexibility, cost effectiveness, fault tolerance, reliability, scalability, robustness and real time processing. Major components of Hadoop are Hadoop Distributed File System, Namenode and DataNodes.
Hadoop Distributed File System (HDFS): HDFS is a distributed file system which allows data to be stored in different blocks of pre determined sizes. Since the data is split across multiple blocks, which spread across multiple machines, data access and operations can be performed in a parallel fashion thus enabling faster processing. Data replication is done automatically to allow fault tolerance.HDFS maintains a master/ slave architecture where the master is named as Name node and slave is named as Data node in Hadoop.
Name Node: Name node functions as a master node. Name node should be a high end system which could survive hardware faults. The daemon that performs the functions of a name node is called Job Tracker. Different functions of name node include:
-
• Maintaining the namespace of files stored. i.e. keeping the metadata of file blocks and their locations.
-
• Maintains an index of cluster configuration
-
• Directs data nodes to execute low level operations
-
• Records the changes that take place in a cluster
-
• Replication of data blocks is taken care by Name node
-
• Receives the heart beat of each data node to check whether it is alive, in case of a data node failure, name node will assign the task to another data node depending on the data block availability, location, overhead etc.
Data Node: Data node serves as the slave node. Data node can be any commodity hardware which will not create any problem even if the node crashes. Replication will avoid any damage associated with data node failure.
The daemon that performs the operation of data node is called Task Tracker. The functions of data node include:
-
• Performs low level read/write operations on blocks
-
• Replication is implemented by Data node.
-
• Forward data to other data nodes, pipeline the data and send heart beats to name node.
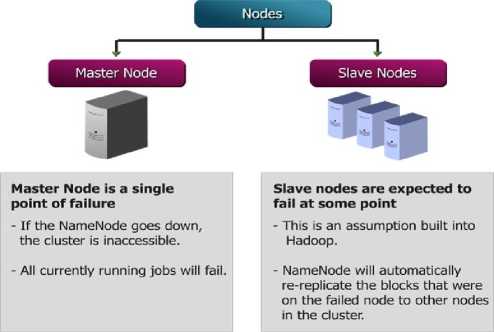
Fig.1. Nodes in Hadoop
-
B. PIG for BigData
PIG [1, 2] was developed at Yahoo to process large data sets stored in Hadoop distributed file system. It was observed that some programmers felt difficulty in transforming to map reduce way of programming. Hence more time was spent on writing programs than analysis. PIG was developed to solve these issues. PIG is designed to handle any type of data.
PIG is built on two components.
PIGLatin
PIG Latin is a data flow language unlike declarative or procedural language. Program operates on files in HDFS. User code and binaries can be included anywhere. Hence frequently used operations like join, group, filter, sort etc can be directly re-used. A programmer who is not familiar with Java can also write PIG programs. Programmers can develop their own functions and they are named PIG UDFs (User Defined Functions).
PIG Run Time Environment/ PIG Engine
PIG Engine runs over Hadoop. Hence programmers are completely isolated from Hadoop ecosystem. Even the changes in Hadoop cluster are handled by PIG Engine. It is the responsibility of PIG Engine to parse, optimize, generate execution plan and job monitoring.
Figure below illustrates the working of PIG with a sample usecase.
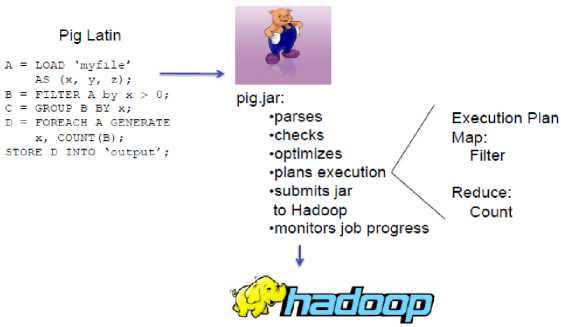
Fig.2. Working of PIG
-
C. R for Data Analysis
R [3, 4] is an open-source data analysis software widely used by statisticians, data scientists, analysts etc for analysis, visualization and predictive modeling. R allows to write scripts and functions in a complete, interactive, and object oriented way. Graphical Visualization is the unique capability provided by R. Scatter plots, box-plots, lattice charts etc are all supported by R. A majority of the data mining algorithms like regression analysis, classification, clustering, association rule mining, text mining, etc can make use of R for efficient and easy implementation.
R and Hadoop can go hand in hand to analyze and visualize large amount of data. Several projects have emerged by combining R and Hadoop for handling different applications. RHadoop, RHIPE, ORCH, Hadoop Streaming with R etc are different ways by which R and Hadoop are combined. In RHadoop [5] the hadoop distributed file system will store the large amount of data and analytic code is written using R and the data will be processed in a map reduce manner.
-
III. Research Design and Methodology
-
A. Problem Statement
Categorize the customers in a bank into low, medium and high risk based on their previous transactions. This could help the banks to do marketing by understanding the customers. Bank should analyze terra bytes or peta bytes of transaction data for accurate classification. Hence we make use of Hadoop distributed processing framework to store and process this large amount of data. Apart from relying on a single tool like R to do the analysis, we are making use of PIG also to ease the preprocessing step. First we propose a solution solely based on PIG. Then we will illustrate how we can improve the classification using K-Means and implement and visualize it using R.
-
B. Data Pre-Processing using PIG
Assume that the bank possess a large dataset containing the customer details, transactions, loan, deposits and credit card details. Clean the data by removing not applicable and null values and save the files in comma separated format to hdfs. Now we can use PIG to pre-process the data. Extract all useful information from different tables and group then based on the customer id. Join the tables to extract loan amount taken, duration to repay the loan, status of loan, type of loan, amount involved in a transaction by customer, date, type of owner, name of the district to which he belongs, average salary, rate of unemployment in that district, number of entrepreneurs in that district, type of card he holds and birth date.
-
C. PIG Algorithm to classify customers
PIG can be used to easily classify the data based on some conditions. Here the number of codes needed is only 3 to categorize into 3 groups. Hence saves a lot of coding time. We categorize the customers based on the loan they have already taken, how much they have repayed, unemployment rate in the district to which he belongs etc. The criterions are actually chosen in a random manner. These criteria can be changed according to the Bank’s requirement.
The above obtained data can be used to classify the bank customers by following Algorithm 1.
Algorithm 1: Classification of Bank Customers using PIG
Input : loan amount taken, duration to repay the loan, status of loan, type of loan, amount involved in a transaction by customer, date, type of owner, name of the district to which he belongs, average salary, rate of unemployment in that district, number of entrepreneurs in that district, type of card he holds and birth date.
Output: Category of Each User (Low Risk / Medium Risk / High Risk)
-
1. Extract all transaction details within 1 year.
-
2. If( transaction_amount > 10 lakh) and (avg_sal > 10k) and loan_status==’A’ and (age between 25 and 65) then categorize the customer as ‘low risk’. Card Status is ‘card can be upgraded’
-
3. If( transaction_amount > 10 lakh) and (avg_sal > 6k) and loan_status==’A’ and loan_status==’C’ and (age between 25 and 55) and unemployment_rate < 0.80 then categorize him to ‘low risk’ but card status is ‘card can be upgraded only after loan repayment.’
-
4. If (avg_sal > 6k) and loan_status==’B’ and loan_status==’D’ and (age >35) and no_of_entrepreneur>100 then categorize him to ‘risky’ and his card status can be ‘down graded’
-
5. Write the category of customers and card status to seperate files.
Algorithm 1 shows how to classify bank customer’s based on several randomly chosen criteria like loans taken, re-payment status etc. Implementation of above algorithm using PIG will be discussed in section 4.
-
IV. Classification by R on Hadoop
A clustering algorithm [6] should be devised to obtain a more accurate classification. Here we use the simple and elegant K-means [7, 8] unsupervised clustering algorithm to classify the customers. R has inbuilt capabilities to implement K means clustering. Before feeding data to K-Means we check for outliers. Outliers [10] are eliminated from salary, unemployment rate etc but no change made to loan amount sanctioned as it is more sensitive one compared to other fields. We can make use of box plotting [11] to detect outliers. In R there exist built in functions to implement all these features. Since different data fields maintain different value range, we perform a scaling operation to uniformly scale the attributes. Then we calculate the variance of each attributes and feed this as input to K-Means clustering.
-
A. K-Means Clustering for Classification
Basic goal of k-means clustering is to classify ‘n’ objects to ‘k’ clusters based on their similarity. Lloyd’s algorithm [9] is widely accepted for implementing k-means clustering. Lloyd’s algorithm is particularly suited for Big Data applications.
In the context of banking customer classification, we set k=3 as we need to classify the customers into low/ medium/ high risk. After executing the K-Means algorithm in R we get a set of parameters like clusters (1to k), cluster centroids, difference in each cluster, difference between other clusters, number of iterations taken to converge, etc.
Algorithm 2: Lloyd’s Algorithm for implementing K-Means Clustering
Input : ‘N’ data points and initial value for ‘k’
Output: K clusters
-
1. Initialize the center of the clusters (μ) with 0; μi= 0 for i = 1 to k
-
2. Assign the closest cluster to each data point. ci= { j:d(x j ,μi) ≤ d(x j ,μl), l≠i, j=1,...,n } where d(x,μi)= ∥ x-μi ∥ 2.
-
3. Reset the position of each cluster to the mean of all data points currently belonging to that cluster. μi=1/|ci| ∑ j ∈ ci x j , ∀ i
-
4. Repeat steps 2-3 until the cluster center remains same for all successive iterations.
-
V. Results and Discussion
This section gives an overview of the implementation constructs adapted to our approach.
-
A. Dataset
We use Berka Data set [12] created by Petr Berka and Marta Sochorova as the source to obtain banking details. Berka Data set contains the datils of about 5300 bank customers with approximately 1,000,000 transactions, 700 loan details and 900 credit card details. Data is collected from Czech bank. Different tables in the data set are:
ACCOUNTS: containing details of each account
CLIENTS: personal information of each customer
ORDER: details of each payment order
TRANSACTIONS: details of each transaction made by the customer
LOANS: details of each loan sanctioned by bank.
CREDIT CARDS: details of credit cards issued by the bank
DEMOGRAPHIC DATA: details about the districts
Entity relationships between the tables are as shown in figure:
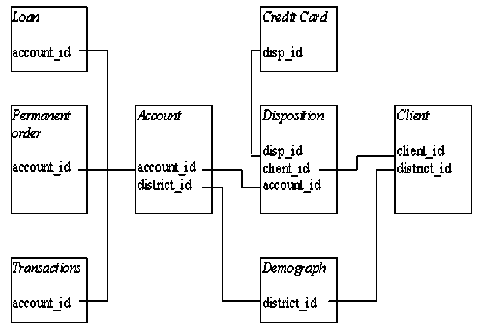
Fig.3. Entity Relationship in Berka Dataset
-
B. Setting Up RHadoop
After installing the Hadoop set environmental variables for integrating R. Load RHadoop packages and read input data from hadoop distributed file system (For details refer Appendix 1).
-
C. Data Preprocessing
After data cleaning, the structure of the fetched data will be as shown in figure 4.
-
> str(clickpath)
$ $ $ $ $ $ $ $ $ $ $ $
ac_id disposal_type age sex card_type dist avg_sal unemp_rate entrepreneur_no trans_sum loan_amount loan_status
: int 97 105 110 132 226 276 303 339 544 666 ...
: Factor w/ 1 level "OWNER": 1111111111...
: num 72.1 63.1 61.1 69.5 70.2 ...
: Factor w/ 2 levels "F",”M": 2121121121...
: Factor w/ 3 levels "classic"."gold"...: 1111111111...
-
: Factor w/ 61 levels "Benesov","Beroun",..: 35 50 24 52 18 26 31 30 5 38 ...
-
: int 10673 9104 9198 9317 10177 8965 8678 8369 9272 8561 ...
-
: num 0.69 0.56 0.95 0.58 1.12 ...
-
: int 100 123 131 97 81 104 102 117 118 110 ...
-
: int 464425 335859 618747 769223 536826 684879 413188 1229557 635316 397245
-
: int 102876 352704 162576 88440 109344 160920 112752 468060 91152 12540 ...
-
: int 1331333311...
Fig.4. Structure of data after cleaning stage.
> sunmary(clickpath)
|
ac_id |
disposal_type |
age |
sex |
card_type |
dist |
avg_sal |
||||||
|
Min. |
: 97 |
OWNER:166 |
Mtn |
:34.10 |
F:82 |
classic:131 |
Hl.n. Praha |
19 |
Min. |
! 8187 |
||
|
1st Qu. |
: 2916 |
1st |
Qu.:44.10 |
M:84 |
gold |
: 15 |
Ostrava |
- nesto |
9 |
1st Qu |
: 8561 |
|
|
Median |
: 5918 |
Median :56.55 |
junior |
: 20 |
Prachatice |
6 |
Median |
: 9065 |
||||
|
Mean |
: 5823 |
Mean :55.95 |
Ceske Budejovice |
5 |
Mean |
: 9553 |
||||||
|
3rd Qu. |
: 8523 |
3rd |
Qu.:67.85 |
Karvina |
5 |
3rd Qu |
:10014 |
|||||
|
Max. |
:11359 |
Max |
:79.20 |
Plzen - |
jih |
5 |
Max. |
:12541 |
||||
|
(Other) |
117 |
|||||||||||
|
unenp |
„rate |
entrepr |
eneur_no |
trans_sun |
loan_anount |
loan_ |
status |
|||||
|
Min. |
:-0.3600 |
Min. |
: 81.0 |
Min. : 272834 |
Min. |
12540 |
Min. |
:1.000 |
||||
|
1st Qu. |
: 0.3600 |
1st Qu. |
:107.O |
1st Qu.: 576035 |
1st Qu. |
72549 |
1st Qu |
.:1.0OO |
||||
|
Median |
: 0.5950 |
Median |
:116.5 |
Median : 885544 |
Median |
:116508 |
Median |
:3.0OO |
||||
|
Mean |
: 0.6149 |
Mean |
:121.7 |
Mean : 890521 |
Mean |
1156116 |
Mean |
:2.295 |
||||
|
3rd Qu. |
: 0.8325 |
3rd Qu. |
:134.2 |
3rd Qu.:1159187 |
3rd Qu. |
:217836 |
3rd Qu |
.:3.000 |
||||
|
Max. |
: 2.0600 |
Max. |
:167.0 |
Max. :1798938 |
Max. |
1475680 |
Max. |
:4.0OO |
||||
Fig.5. Summary of fetched data

Fig.6. Box Plot of all attributes
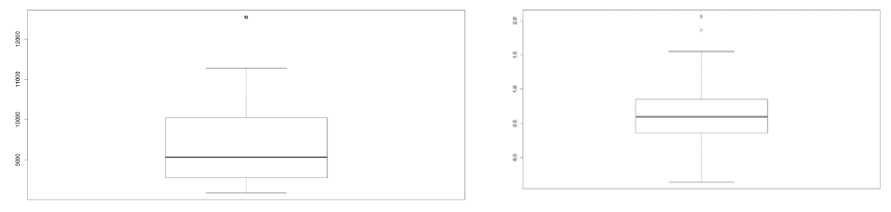
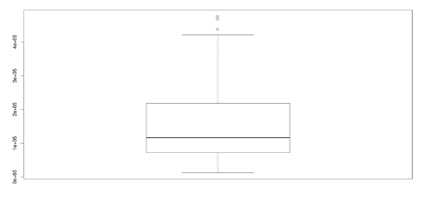
Fig.7. Boxplot on average salary, unemployment rate and loan amount
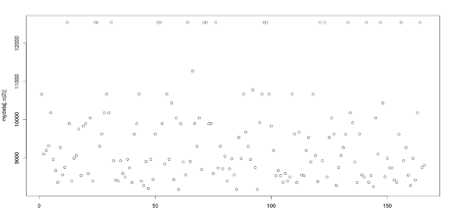
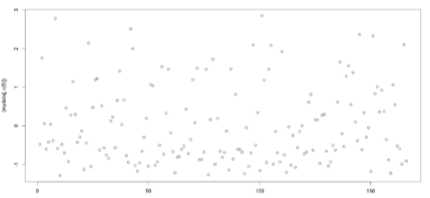
Fig.8. Scatterplots of a) average salary and b) loan amount
The box plot of all attributes is as shown in figure 6. But from the boxplot it is clear that there exist outliers in avg_sal, loan_amount and unemp_rate. The box plot applied on each attribute separately is given in figure 7.
Scatter plots of average salary and loan amount is as shown in figure 8. Scatter plots will give more insight to the data distribution of sensitive attributes like avg_sal and loan_amt.
From fig 8.a it is clear that a lot of pixels lie in the outlier range for avg_sal and loan_amt, hence it is better to maintain the values as such without any change.
K-Means Clustering
After the data pre-processing stage, the cleaned data is fed as input to K Means clustering algorithm. Elbow graph obtained by plotting the variance obtained in 15 successive iterations are as shown in figure 9.From this figure it is clear that the slope changes in every 3 successive iterations, hence the optimized number of cluster can be deduced as 3.
15 ekielen
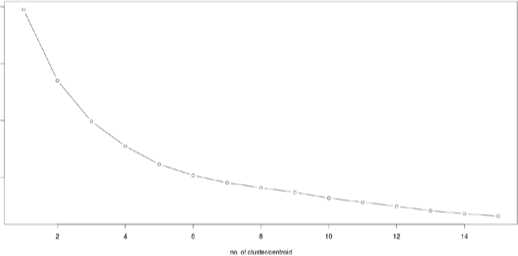
Fig.9. Elbow Graph of 15 successive iterations
> fit
K-neans clustering with 3 clusters of sizes 73, 21, 72
Cluster means: age avg_sal unenp_rate entrepreneur_no trans_sum loan_amount
1 0.4595993 -0.2053984 0.08248572 -0.2616114 -0.6961517 -0.6384795
2 -0.5362521 2.1794191 -1.30032554 1.8844958 0.2420079 0.2004981
3 -0.3095757 -0.4274127 0.29563027 -0.2843997 0.6352348 0.5888687
Clustering vector:
1 2 3 4 5 6 7 8 9 10 11 12 13 14 15 16 17 18 19 20 21 22 23 24 25 26 27 2829
30 31 32 33 34 35 36 37 38 39 40 41 42 43 44 45 46 47 48 49 50 51 52 53 54 55 56 5758
59 60 61 62 63 64 65 66 67 68 69 70 71 72 73 74 75 76 77 78 79 80 81 82 83 84 85 8687
333 3 1212331 3 2211321 3 333111313
88 89 90 91 92 93 94 95 96 97 98 99 100 101 102 103 104 105 106 107 108 109 110 111 112 113 114 115 116
117 118 119 126 121 122 123 124 125 126 127 128 129 130 131 132 133 134 135 136 137 138 139 140 141 142 143 144 145
146 147 148 149 150 151 152 153 154 155 156 157 158 159 160 161 162 163 164 165 166
Within cluster sun of squares by cluster:
-
[1] 237.68612 61.46425 297.58424
(between_SS / total_SS = 39.7 %)
Available components:
-
[1] 'cluster" "centers" "totss" "withinss" "tot.withinss" "betweenss" "size"
-
[8] "iter" "ifault"
-
Fig.10. K - Means Summary
K-Means summary of the input data set is given in figure 10.
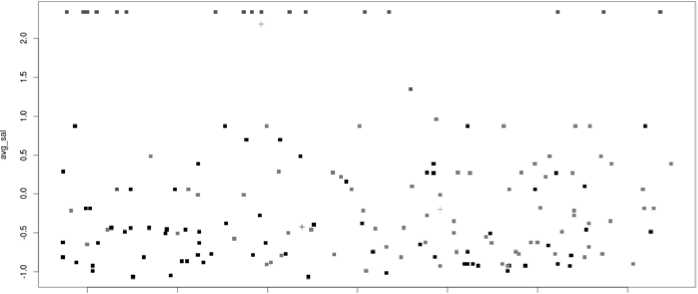
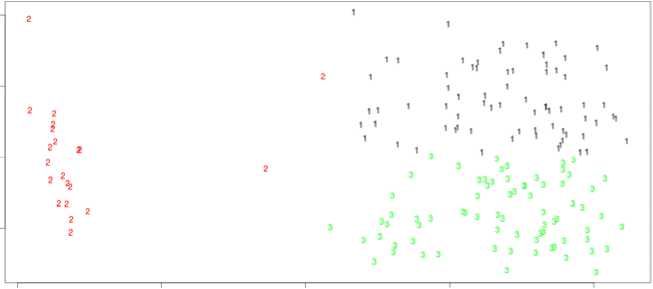
K Means plot of age vs. average salary is illustrated in fig 11.a. Three colors denote 3 different cluster data points. Fig 11.b. plots data points with cluster names 1, 2,
-
3 so that the spread of data points is clearly reflected. Fig 12 illustrates by how much, each data points vary within each cluster or it projects the variation of each cluster point from its mean or centroid.
•15 -1.0 -05 0.0 05 15 15
Fig.11.a. K means plot for age vs. avg_sal
de 1
Fig.11.b. Plotting data points with cluster numbers 1,2 and 3.
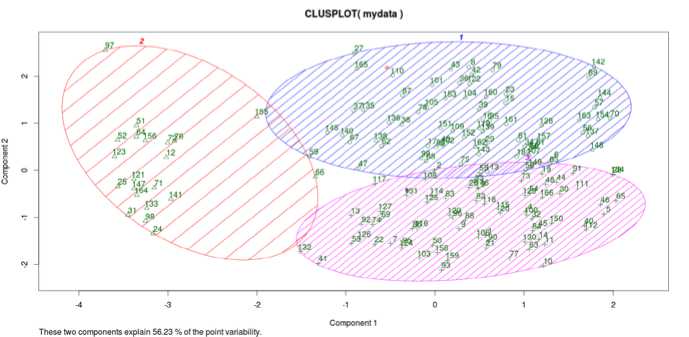
Fig.12. Variation of data points from cluster mean
-
> cluster jean
I 1 51.81889 9965,847 6.7106944 115.22221131724.5 222150.86 2.4365561
2 2 48,79198 12341,816 5,1423816 164,4762983175,6178599,43 2,5714292
3 3 52.69927 9289.959 6.5347945 115.7397 523994.6 84519.29 2.6821923
Fig.13. Mean of each cluster.
The cluster mean obtained from the Berka data set for each cluster low, medium and high risk customers is given in fig 13. (The details of how to obtain the graphs and plots in R are given in appendix 2).
-
VI. Conclusion
Analysis of Big Data helps organization to get valuable insights from the structured or unstructured data they possess. This article identifies an application of Big Data in banking domain to categorize the customers based on their transactions. We use Hadoop as the software platform for storing the data. Data analysis tools like R and PIG are used to extract useful information from the data. To classify the customers, K Means clustering is used. But this could be replaced with SVMs or Neural Networks for better accuracy. Since we have addressed the problem in a BigData perspective, the learning time or heavy processing requirement will not be a problem.
Acknowledgement
References A Novel Big Data Approach to Classify Bank Customers - Solution by Combining PIG, R and Hadoop
- Alan Gates (2011), Programming PIG, O’Reilly Media, New York.
- Christopher Olston, Benjamin Reed, Utkarsh Srivastava, Ravi Kumar and Andrew Tomkins, “Pig Latin: A Not-So-Foreign Language for Data Processing”, SIGMOD’08, June 9–12, 2008, Vancouver, BC, Canada.
- Emmanual Paradis, “R for Beginners”, http://cran.r-project.org/doc/contrib/Paradis-rdebuts_en.pdf
- W. N. Venables, D. M. Smith and the R Core Team, “An Introduction to R”, http://cran.r-project.org/doc/manuals/R-intro.pdf
- Vignesh Prajapati (2013), “Big Data Analytics with R and Hadoop”, Packt Publishing, UK.
- Jiawei Han, Micheline Kamber (2006), “Data Mining Concepts & Techniques”, Morgan Kaufmann Publishers, Canada.
- J. B. MacQueen (1967): "Some Methods for classification and Analysis of Multivariate Observations, Proceedings of 5-th Berkeley Symposium on Mathematical Statistics and Probability", Berkeley, University of California Press, 1:281-297.
- Brian T. Luke: “K-Means Clustering”, http://fconyx.ncifcrf.gov/~lukeb/kmeans.html
- S. Lloyd, Least square quantization in PCM, IEEE Trans. Infor. Theory, 28, 1982, pp. 129– 137.
- Charu C. Aggarwal (2013), “Outlier Analysis”, Kluwer Academic Publishers, Boston.
- Purple Math: “Box Plot and 5 number summary”, http://www.purplemath.com/modules/boxwhisk.htm
- Berka, P. (2000). Guide to the financial data set. The ECML/PKDD 2000 Discovery Challenge.
- Robert Chansler, Hairong Kuang, Sanjay Radia, Konstantin Shvachko, and Suresh Srinivas,“Hadoop Distributed File System”, http://www.aosabook.org/en/hdfs.html
- Jeffrey Shafer, Scott Rixner, and Alan L. Cox, “The Hadoop Distributed Filesystem: Balancing Portability and Performance”, ISPASS 2010, New York, USA, Pages 122-133.
- Y. Wang, S. Wang, and K.K. Lai, “A New Fuzzy Support Vector Machine to Evaluate Credit Risk,” IEEE Trans. Fuzzy Systems, vol. 13, no. 6, pp. 820-831, Dec. 2005.
- T. Joachims, “Making Large-Scale SVM Learning Practical,” Advances in Kernel Methods: Support Vector Learning, B. ScholLkopf, C. Burges, and A. Smola, eds., MIT-Press, 1999.
- L. Yu, S. Wang, and K. Lai, “Credit Risk Assessment with a Multistage Neural Network Ensemble Learning Approach,” Expert Systems with Applications, vol. 34, no. 2, pp. 1434-1444, 2008.
- H. Guo and S.B. Gelfand, “Classification Trees with Neural Network Feature Extraction,” IEEE Trans. Neural Networks, vol. 3, pp. 923-933, 1992.
- R. Rymon, “An SE-Tree Based Characterization of the Induction Problem,” Proc. Int’l Conf. Machine Learning, 1993.
- J.R. Quilan, “Induction of Decision Trees,” Machine Learning, vol. 1, pp. 81-106, 1986.
- Nearest Neighbor (NN) Norms: NN Pattern Classification Techniques, B.V. Dasarathy, ed. IEEE Computer Society Press, 1991.
- D. Martens, M. De Backer, R. Haesen, J. Vanthienen, M. Snoeck, and B. Baesens, “Classification with Ant Colony Optimization,” IEEE Trans. Evolutionary Computation, vol. 11, no. 5, pp. 651-665, Oct. 2007.
- D. Martens, B.B. Baesens, and T. Van Gestel, “Decomposition Rule Extraction from Support Vector Machines by Active Learning,” IEEE Trans. Knowledge and Data Eng., vol. 21, no. 2, pp. 178-191,Dec. 2008.
- D. Pedro and M. Pazzani, “On the Optimality of the Simple Bayesian Classifier under Zero-One Loss,” Machine Learning, vol. 29, pp. 103-137, 1997.
- G. Guo, “CR Dyer, Learning from Examples in the Sample Case: Face Expression Recognition,” IEEE Trans. Systems, Man, and Cybernetics, Part B, vol. 35, no. 3, pp. 477-488, June 2005.
- W.A. Chaovalitwon Se, Y.-J. Fan, and R.C. Sachdeo, “Support Feature Machine for Classification of Abnormal Brain Activity,” Proc. ACM SIGMOD, pp. 113-122, 2007.
- B.P. Rachel, T. Shlomo, R. Alex, L. Anna, and K. Patrick, “Multiplex Assessment of Serum Biomarker Concentrations in Well-Appearing Children with Inflicted Traumatic Brain Injury,” Pediatric Research, vol. 65, no. 1, pp. 97-102, 2009.
- S. Olafsson, X. Li, and S. Wu, “Operations Research and Data Mining,” European J. Operational Research, vol. 187, no. 3, pp. 1429-1448, 2008.
- A. Benos and G. Papanastasopoulos, “Extending the Merton Model: A Hybrid Approach to Assessing Credit Quality,” Math and Computer Modelling, vol. 48, pp. 47-68, 2007.
- R. Rymon, “An SE-Tree Based Characterization of the Induction Problem,” Proc. Int’l Conf. Machine Learning, 1993.
- J.R. Quilan, “Induction of Decision Trees,” Machine Learning, vol. 1, pp. 81-106, 1986.
- Apache Hadoop Architecture : https://hadoop.apache.org/docs/r1.2.1/hdfs_design.html
- Google’s Technical Paper on Map Reduce, http://research.google.com/archive/mapreduce.html
- Kumagai, J., “Mission impossible? [FBI computer network]”, IEEE Spectrum, Volume: 40, Issue: 4, April 2003.
- J. Cohen,“Graph Twiddling in a MapReduce World.”, Computing in Science & Engineering (Volume:11 , Issue: 4 ), June 2009.
- Shunmei Meng; Wanchun Dou ; Xuyun Zhang ; Jinjun Chen, “KASR: A Keyword-Aware Service Recommendation Method on MapReduce for Big Data Applications”, IEEE Transactions on Parallel and Distributed Systems, Volume:25 , Issue: 12, Dec. 2014
- Hormozi, H, Akbari, M.K., Hormozi, E.., Javan, M.S, “Credit cards fraud detection by negative selection algorithm on hadoop (To reduce the training time)”, IEEE 5th Conference on Information and Knowledge Technology (IKT), May, 2013.
- Conejero, J.; Burnap, P.; Rana, O.; Morgan, J., “Scaling Archived Social Media Data Analysis Using a Hadoop Cloud”, IEEE Sixth International Conference on Cloud Computing (CLOUD), June, 2013.
- Xu, J.; Yu, Y.; Chen, Z.; Cao, B.; Dong, W.; Guo, Y.; Cao, J.,”MobSafe: cloud computing based forensic analysis for massive mobile applications using data mining”, Tsinghua Science and Technology, Volume: 18, Issue: 4 , June 2013.
- RBI Bank Transaction Statistics, http://www.rbi.org.in/scripts/NEFTUserView.aspx?Id=82.
- What is BigData?, http://www.sas.com/en_us/insights/big-data/what-is-big-data.html.
