
AI Adoption and E-Commerce Development in SMEs: Comparative Evidence from the EU and Ukraine
Journal: International Journal of Information Engineering and Electronic Business @ijieeb
Article in issue: 5 vol.18, 2026.
Free access
Artificial intelligence (AI) is increasingly associated with changes in e-commerce development, including demand generation, operational processes, and consumer interaction. The aim of the article is to examine and quantify the relationship between AI adoption and e-commerce development in 2023–2025 in an international context, with an emphasis on Ukraine’s position among European markets. The methodological framework of the study is a quantitative comparative analysis of data for Germany, France, Italy, Spain, Poland, the Netherlands, and Ukraine. An integral E-Commerce Index and an AI Adoption Index were created based on statistical sources, which were normalized in the range from 0 to 1. The hypothesis was tested by using correlation and regression analysis, as well as clustering of countries by a combination of e-commerce and AI maturity levels. Given the correlational design of the study, the findings are interpreted as evidence of statistical association rather than causation. The results show a persistent positive and statistically significant relationship between the AI adoption and the development of e-commerce levels. The leaders in terms of the AI Adoption Index are the Netherlands (0.88) and Germany (0.85), while Ukraine demonstrates the earliest phase of integration (0.25). The findings suggest that AI adoption is a significant correlate of e-commerce development rather than merely an auxiliary technological feature. The practical value of the results is the possibility of their use for building state policy of digital transformation and business strategies in the context of international competition.
Short address: https://sciup.org/15020738
IDS: 15020738 | DOI: 10.5815/ijieeb.2026.05.01
Text of the scientific article AI Adoption and E-Commerce Development in SMEs: Comparative Evidence from the EU and Ukraine
Published Online on October 8, 2026 by MECS Press
The rapid spread of artificial intelligence (AI) is changing the logic of global e-commerce, as digital markets increasingly rely on algorithms that can personalize demand, optimize operations, and reduce transaction costs. According to Aljarboa, the ability to make automated decisions is shaping a new structure of competitive advantages for small and medium-sized enterprises [1]. In the European Union (EU), digital intensity has become a key driver of economic growth, where the integration of AI correlates with the resilience of the e-commerce sector [2]. In the case of Ukraine, as Romanchuk et al. note, the implementation of AI is accelerating the modernization of business processes, although the scale of the impact remains uneven compared to international markets [3].
E-commerce is a form of commercial activity in which the purchase and sale of goods or services are carried out through digital platforms and the Internet. At the global level, the development of e-commerce is stimulated not only by technological innovations, but also by changes in consumer behaviour: personalized recommendations and intelligent logistics solutions are shaping new standards of digital interaction [4,5]. Studies in Europe show that the intensity of AI use by enterprises is growing rapidly, but countries differ in the availability of technological infrastructure and regulatory mechanisms [6]. At the same time, international reviews emphasize that the integration of analytics, automated demand forecasting, and risk management algorithms is shaping a new architecture for sustainable platform development [7]. In a broader institutional context, the implementation of digital technologies, in particular AI, is associated with increasing the efficiency of strategic planning and coordination of economic processes, which is especially important for countries facing transformational challenges [8].
Since small and medium-sized enterprises constitute the dominant share of e-commerce market participants in both the European Union and Ukraine, national-level indicators of e-commerce development largely reflect the digital maturity and AI adoption capacity of SMEs. Consequently, although the analysis is conducted at the country level, the observed dynamics primarily capture the technological transformation of small and medium-sized enterprises, which form the backbone of digital commerce ecosystems. This suggests that national differences in e-commerce performance may partly reflect the heterogeneity of SME digital capabilities; however, this interpretation remains indirect, as the analysis is based on aggregated country-level data.
Despite the rapid growth of publications on AI in e-commerce, empirical results remain fragmented across countries and indicators. Some studies focus on individual technologies (e.g., recommender systems) or on individual market segments, while comparative assessments at the national level are often limited to descriptive comparisons without integral metrics and statistical testing of the strength of the relationship. As a result, it is not clear whether the effect of AI on e-commerce persists after taking into account the underlying digital infrastructure conditions and overall economic capacity, and how significantly this effect varies across major European markets.
An additional gap is the limited representation of Ukraine in international quantitative comparisons, although the national market demonstrates growth under the influence of crisis factors and at the same time rapid digital adaptation [9]. That is why there is a need for a reproducible model that combines comparative indexing of e-commerce development, measurement of the spread of AI in business and statistical testing of connectivity for a comparable group of EU countries and Ukraine, using agreed sources [6,10-12].
The aim of the study is to identify and quantify the relationship between the implementation of AI technologies and the development of e-commerce, primarily driven by small and medium-sized enterprises, in 2023–2025 in the international context (Germany, France, Italy, Spain, Poland, the Netherlands, and Ukraine), with the determination of Ukraine’s position among European markets. The research hypothesis is that the relationship between the AI adoption and the development of e-commerce level s is heterogeneous and varies depending on the digital maturity of national economies. At the same time, the study does not seek to establish a causal effect, as the empirical design is based on cross-country comparative indicators and correlational statistical techniques.
The aim involves the fulfilment of the following research objectives:
1) Systematize theoretical approaches to the application of AI in e-commerce, identifying mechanisms of influence on demand, transactions, and value for the consumer.
2) Build a comparative empirical model of the relationship between the AI adoption and the development of ecommerce levels based on international statistics.
3) Assess the relative position of Ukraine in relation to the EU countries in the sample and identify key barriers and opportunities for scaling AI in Ukrainian e-commerce against the background of European practices.
2. Literature Review
3. Methods
Recent studies (primarily from 2023–2025) suggest that AI is considered not only as a separate automation tool, but also as a factor in transforming e-commerce business models. In Barata et al. and Malik et al., AI is interpreted as a technological basis for organizational flexibility, but these studies are mostly conceptual in nature and do not offer quantitative international comparisons [13,14]. Interdisciplinary examples of AI applications, in particular in the legal sphere, confirm the universality of the technology, while emphasizing the fragmentation of empirical approaches [15]. A scientometric analysis by He and Liu further demonstrates the rapid growth of the topic of AI in e-commerce, while recording the dominance of highly specialized studies over systemic comparative models [16].
A significant part of the research links the effectiveness of AI adoption in e-commerce with institutional and regulatory conditions. Alazzam et al. and Kussainov et al. focus on the legal compatibility of digital platforms in EU countries [17,18]. At the same time, empirical studies by Volynets et al. and Kafka et al. demonstrate that regulatory compliance alone does not guarantee high e-commerce outcomes without deep integration of AI into business processes [19,20]. This points to a gap between regulatory models and real economic effects that remain poorly quantified.
Muzychenko et al. and Nathalie et al. made significant contributions to operational optimization, who analyse the role of automation in increasing the efficiency of business processes [21,22]. Chew et al. show that AI allows for the integration of accounting data and financial risk assessment [23]. Pallathadka et al. consider AI as a cross-functional tool that simultaneously transforms management, finance, and e-commerce in global markets [24]. Rossikhina et al. emphasize that digital tools can increase the efficiency of macroeconomic systems, but the issue of impact on the micro level is left out of detailed analysis [25]. It is worth noting that some studies demonstrate positive results, but almost do not raise the issues of algorithm errors and the risks of their use in unstable markets.
The development of recommender systems is described in detail in Valencia-Arias et al. and Madanchian [4,26]. These authors convincingly argue that personalization increases conversion and shapes new patterns of customer behaviour. Erdoğan shows in a systematic review that most research focuses on the technical aspects of recommender systems, and the economic implications are much less studied [27]. However, as Rane et al. rightly point out, excessive algorithmization can create information asymmetries and deepen the dependence of platforms on closed AI models [28]. Malhotra and Kharub and Qi et al. show that AI algorithms increase forecasting accuracy, allow for optimized transport routes, and reduce costs [5,7]. At the same time, Deng and Guo analyse mobile e-commerce and the sustainability of business models in the context of consumer mobility [27]. This study reveals an important aspect, but does not take into account transition economies where logistical risks are deeper (e.g. Ukraine). Orzoł and Szopik-Depczyńska further outline the long-term growth trends of e-commerce and the uneven pace of AI adaptation between individual countries [30]. Criveanu also identifies digital intensity as a determinant of economic growth in the EU. On the other hand, Zatonatska et al. show that migration affects the structure of consumer demand in Poland, which indirectly stimulates ecommerce [2,31]. The Ukrainian academic field is represented by the studies of Romanchuk et al. (2025) and Mushnykova et al. [3,32]. These studies analyse the market structure, consumer behaviour, and barriers to digital transformation, but the authors make almost no international comparisons, which complicates the integration of Ukrainian findings into the global context.
There are conflicting estimates of the effects of AI in the literature. For example, Zare Sakhvidi and Saadat believe that the real economic impact of AI may be overstated, while Nathalie et al. find consistently positive results even in weak digital ecosystems [33,22]. This indicates the lack of agreed models for measuring the impact of AI. At the same time, a significant part of studies focuses on the EU, while countries in transition are not sufficiently covered. Summarizing the results of earlier studies, we can state several persistent gaps: the lack of agreed integral indicators for assessing the impact of AI on e-commerce, limited cross-country comparisons, and insufficient attention to economies in transition. It should be noted that the majority of sources used in this study are recent (2023–2025), reflecting the rapidly evolving nature of AI technologies and their application in e-commerce. The academic novelty of this study is overcoming these limitations by building a reproducible quantitative model for the EU countries and Ukraine.
The empirical study was aimed at testing the hypothesis regarding the impact of the AI adoption level on the development of e-commerce in an international comparative context in 2023–2025. However, the selected time horizon (2023–2025) captures only short-term dynamics and does not allow for the assessment of long-term structural effects of AI adoption. The research procedure consisted of sequential stages that ensured the reproducibility of the results and compliance with the quantitative logic of the analysis (Figure 1). The use of sources for 2025 is determined by the fact that these reports contain consistent and comparable data for the entire period of 2023–2025, prepared according to a single methodology. Earlier editions of the relevant reports either do not cover AI adoption indicators or use other classification approaches, which complicates cross-country comparison.
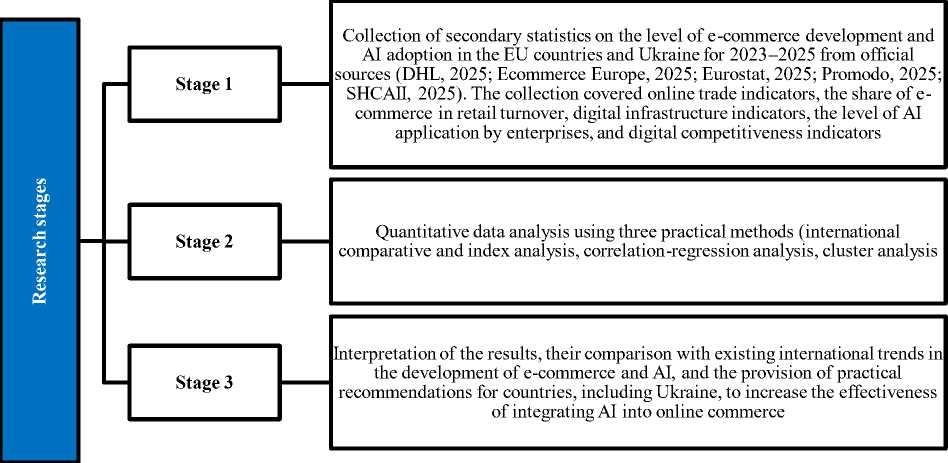
Fig. 1. Logic and stages of empirical research on the impact of AI on the development of e-commerce. Source: developed by the authors
The general population of the study covered 31 European countries for which there are publicly available agreed indicators of the development of e-commerce and the use of AI by enterprises. The initial list of countries was formed on the basis of the European E-Commerce Report and the E-Commerce Trends Report, which identified the main markets for online trading [10,11]. Indicators of the spread of AI technologies, as well as basic characteristics of the digital maturity of economies, were obtained from Eurostat statistics and the global AI Index Report [6,25]. For Ukraine, a specialized review Ukrainian E-Commerce 2024–2025 was additionally used, which details the structure of sales and consumer behaviour [9].
The completeness of the statistical series and correct comparison were ensured through a consistent narrowing of the sample. At the first step, countries were excluded for which at least one key indicator was missing for the selected period. The second step included only countries that are also part of the group of the largest e-commerce markets in Europe and are regularly described in the DHL and Ecommerce Europe reports [10,11]. As a result, the final sample included six EU countries – Germany, France, Italy, Spain, Poland and the Netherlands – and Ukraine. At the same time, the sample size is limited to seven countries, which reflects strict data availability and comparability criteria. Such a small sample reduces statistical power and makes the estimates potentially sensitive to minor data variations. These countries were selected according to a set of quantitative and analytical criteria. First, all of the mentioned countries belong to the largest or dynamically growing e-commerce markets in Europe. Second, complete, comparable and methodologically consistent statistics on the development of e-commerce and the AI adoption level for 2023–2025 are available for them. Third, the sample is formed taking into account different levels of digital maturity of economies: from highly developed digital leaders (Germany, the Netherlands) through countries with established but structurally different markets (France, Spain, Italy) to transition economies (Poland and Ukraine). This approach allows not only to compare the scale and intensity of e-commerce, but also to analyse the heterogeneity of the impact of AI depending on the institutional and technological conditions of development.
The initial set of variables consisted of online sales volume indicators, e-commerce share in retail turnover, market growth rates, internet penetration level, share of enterprises implementing AI, and indicators of national AI maturity. Specifically, the E-Commerce Index includes the following components: (1) online sales volume, (2) share of ecommerce in retail turnover, and (3) growth rate of online sales. The AI Adoption Index includes: (1) share of enterprises using AI technologies and (2) national AI maturity indicators. These indicators primarily capture the performance of SME-dominated online markets, where small firms account for the majority of sellers and transactions, especially in catching-up economies. The indicators for building integral indices were selected based on three criteria: (1) economic relevance to reflect the intensity of e-commerce or the AI adoption level; (2) international comparability and regular availability of data in statistical sources; (3) absence of duplication of information content between variables. Online sales volume indicators and e-commerce share in retail turnover reflect the actual scale and penetration of digital trade, while the share of enterprises using AI and AI maturity indicators indicate the degree of technological integration into business processes. Before calculations, the data were cleaned of omissions and obvious statistical outliers, after which all quantitative indicators were reduced to a single scale using the min–max normalization method. The min–max normalization method was chosen due to its ability to preserve relative crosscountry differences and ensure the interpretability of integral indices on a scale from 0 to 1, which is a standard approach in comparative studies of the digital economy. The normalized value was calculated using the formula:
X-mf-™
Xnormal. = "---—— (1)
^max Xmin where X - the actual value of the indicator, mmtn, xmax - its minimum and maximum values. The value 0 corresponded to the lowest development level, and 1 – to the highest. After normalization, each component contributes equally to the corresponding composite index, such that the index value represents the arithmetic mean of the normalized indicators. To stabilize interannual fluctuations, the indicators for 2023–2025 were used as average values for the period for each country (provided that a full set of variables was available).
Two integral indices were calculated based on the normalized variables: the E-Commerce Index and the AI adoption Index. Within each index, the components were aggregated with equal weights, which minimizes bias in favour of individual indicators and corresponds to the approaches of international studies of the digital economy [2,7]. Thus, each variable contributes proportionally to the index according to its normalized value, ensuring that no single indicator dominates the composite measure. The use of equal weights is determined by both theoretical and practical considerations. First, in the absence of strong theoretical or empirical justification for prioritizing specific components, equal weighting is a widely used approach in composite index construction to avoid arbitrary bias. Second, alternative weighting schemes, such as expert-based weighting or statistically derived weights (e.g., principal component analysis), may introduce additional subjectivity or require larger datasets than available in this study. Therefore, equal weighting was adopted as a transparent and replicable baseline approach for comparative analysis. The empirical study is based on a single methodological logic of processing, normalizing, and aggregating indicators. At the same time, it is acknowledged that equal weighting represents a simplifying assumption and may not fully capture the relative importance of individual components, which constitutes a limitation of the index construction. All data calculations were performed in Microsoft Office Excel 2021. Further quantitative analysis was carried out using three practical methods specified in the second stage of the study (Figure 1):
- An international comparative and index analysis was conducted. Countries were ranked by two integral indices, averages, standard deviations and coefficients of variation were calculated, and groups of leaders, “middle segment”, and countries with lower indicators were identified. This approach made it possible to correlate the empirical results with the analytical conclusions presented in the reports Ecommerce Europe [10], DHL [11] and Promodo [9], and to see how the statistical estimates are consistent with qualitative descriptions of the market;
- Correlation and regression analysis was used to formally test the hypothesis of a positive statistical relationship between AI adoption and the development of e-commerce. The dependent variable was the integral E-Commerce Index, and the explanatory variable was the AI Adoption Index; the control variables were GDP per capita and the Internet penetration level. Due to data availability constraints and the small sample size, other potentially relevant controls— such as institutional quality, innovation capacity, education level, and broader digital readiness—were not included in the model. The parameters of the linear model were estimated by the least squares method, and the statistical significance of the coefficients was checked by the t-test at a = 0.05. Given the small sample size, the estimated coefficients and significance levels should be interpreted with caution, as they may be unstable and sensitive to small changes in the data. The coefficient for the AI variable was interpreted as an estimate of the conditional association between AI maturity and the intensity of e-commerce development, holding other variables constant. Because the analysis is based on a small cross-country sample and observational secondary data, the regression estimates should not be interpreted as evidence of causality;
- Cluster analysis was used to identify typical combinations of the e-commerce development and AI adoption levels. Cluster analysis was appropriate to supplement the correlation and regression approach for the purpose of assessing the strength of the impact of AI on the development of e-commerce and its direction. While regression analysis is used to formally test the hypothesis of a statistically significant relationship, clustering provides a typology of countries according to the similarity of the combination of e-commerce and AI maturity levels, which is not reduced to a linear dependence. The k-means algorithm with Euclidean distance was chosen for clustering, as the analysis is based on two normalized dimensionless integral indices that have a metric nature and comparable scales. Due to the small sample size, formal cluster validation statistics (such as silhouette scores) were not applied, and the number of clusters was determined heuristically based on interpretability. Under such conditions, k-means provides stable and interpretable results, while alternative methods (hierarchical clustering or density algorithms) are less suitable for small samples and low-dimensional spaces. The interpretation of the resulting clusters as groups of “leaders”, “followers” and “catch-ups” is based on a comparison of the average values of the integral indices within each cluster with the average and marginal values of the sample. Leading countries are characterized by values of both indices exceeding the average level, “followers” — by indicators close to the average, while “catch-ups” have values significantly lower than the average for the sample.
4. Results
The application of a set of methods has a clear functional logic. Comparative and index analysis is used to describe inter-country differences and position countries in terms of the e-commerce development and AI adoption levels. Correlation and regression analysis provides a formal test of the hypothesis regarding the strength and direction of the statistical relationship between AI adoption and the development of e-commerce. Cluster analysis generalizes the results by identifying typical models of digital transformation among the sample countries.
Over the period 2023–2025, all countries in the sample demonstrated an increase in e-commerce volumes. This pattern suggests convergence dynamics, where catching-up economies grow faster in relative terms but do not eliminate structural gaps in absolute levels. In 2025, the share of e-commerce in retail turnover ranged from about 10–12% in Ukraine to over 20% in Poland (Table 1). In developed countries in Western Europe, this figure reached 16–18% (for example, in Germany – 18%, France – 16%), while in Southern Europe it remained lower (Italy – about 10%, Spain – 12%). High Internet penetration (over 85% of the population) in most of the analysed countries provides a wide base of online consumers, but the intensity of the transition to digital sales varies. The fastest growth rates in the share of online sales were recorded in the catching-up markets. These dynamics are typical for SME-dominated e-commerce structures, where growth reflects the gradual digitalization of small firms rather than the expansion of large platforms. In 2024, the share of e-commerce in Ukraine reached 10%, which is almost half that of Poland (20%), but the growth for the year was +25%.
The cumulative growth of online sales volume for 2023–2025 exceeded 40% in Ukraine and 35% in Spain and Poland, while it was relatively moderate (about 10–15%) in Germany and the Netherlands because of the already saturated market (Table 1). Therefore, although the relative growth rates were higher in countries with a lower base, the gap in the e-commerce penetration level between the leading and catching-up countries is still significant. These dynamics are characteristic of SME-dominated e-commerce structures. In catching-up countries such as Italy and Ukraine, the rapid growth from a low base reflects the gradual digitalization of small and medium-sized enterprises, which constitute the core of national online markets. Unlike mature markets dominated by large platforms, SME-driven systems expand through incremental adoption of digital tools, often triggered by necessity rather than strategic innovation. As a result, growth is volatile but structurally transformative, indicating a transition from fragmented offline retail toward platform-based micro-entrepreneurship.
Table 1. Dynamics of the Share of E-Commerce in Retail Trade and Growth of Online Sales (2023–2025).
|
Country |
Share of ecommerce 2023, % |
Share of ecommerce 2025, % |
Online sales growth 2023– 2025, % |
Characteristics of e-commerce development dynamics |
|
Germany |
15 |
18 |
10 |
Mature market with a high base; growth limited by saturation and stable consumption structure |
|
France |
12 |
16 |
15 |
Moderate growth against the background of active implementation of digital services and regulatory support |
|
Italy |
7 |
10 |
30 |
Market from a low starting base; growth driven by digitalization of small businesses |
|
Spain |
8 |
12 |
40 |
Accelerated development associated with changes in consumer behaviour and mobile commerce |
|
Poland |
15 |
22 |
35 |
Dynamic market of a transition economy with active involvement of international platforms |
|
Netherlands |
18 |
22 |
15 |
One of the most digitally mature markets in the EU with stable but slower growth |
|
Ukraine |
8 |
12 |
45 |
A catching-up market; high growth rates against the background of digital adaptation in times of crisis |
Source: calculated by the author based on DHL [11], Ecommerce Europe [10], Eurostat [6], Promodo [9], SHCAII [12]
In parallel with the development of the market, the diffusion rates of AI technologies in the business sector have increased. This indicates that AI diffusion is not uniform and depends on structural characteristics of national economies rather than purely on market size. The share of enterprises implementing AI technologies has increased significantly over three years (Table 2). As of 2025, about 20% of European companies on average used at least one of the AI tools, while in 2023 it was at the level of 10–15%. Among the studied countries, the Netherlands and Germany demonstrated the highest AI adoption level, ~30% and ~28% of enterprises use AI solutions in their activities, respectively (2025). The group with moderate AI diffusion includes France and Poland (approximately 18–20%), and the share of innovative companies in Spain is about 15%. The indicators are significantly lower in Italy (~10%) and especially in Ukraine (~8%), where AI technologies are still perceived by businesses to a limited extent. However, there was a significant increase in adoption even in these countries: in comparison, in 2023, only 4% and 2% of enterprises in Italy and Ukraine, respectively, used AI (Table 2).
Therefore, although all countries showed positive dynamics, the inter-country gap in the level of technological maturity remains significant – from the massive use of AI in advanced economies to isolated cases in developing ones. This asymmetry is particularly visible in SME environments, where AI adoption typically begins with low-cost, modular solutions rather than full-scale system integration. In Italy and Ukraine, AI diffusion is concentrated in individual functional blocks – such as customer communication or basic analytics – reflecting the resource constraints and risk sensitivity of small enterprises. In SME-centered markets, AI diffusion typically starts from modular, low-cost tools (such as chatbots and basic analytics) rather than from system-wide automation, which explains the fragmented but rapidly expanding adoption pattern.
Table 2. Share of Enterprises Using AI Technologies in 2023 and 2025, %.
|
Country |
2023, % |
2025, % |
Characteristics of the pace of AI adoption |
|
Germany |
15 |
28 |
Accelerated adoption due to corporate investment and government incentives for digitalization |
|
France |
10 |
20 |
Stable growth driven by national AI strategy |
|
Italy |
4 |
10 |
Uneven dynamics; AI adoption mainly in large enterprises |
|
Spain |
6 |
15 |
Average growth with emphasis on service industries and logistics |
|
Poland |
8 |
18 |
Intensification of AI adoption through adaptation of small and medium-sized businesses |
|
The Netherlands |
15 |
30 |
Highest rate of AI adoption among sample driven by high digital maturity |
|
Ukraine |
2 |
8 |
Growth from low start; impact of war situation hinders large-scale adoption |
Source: calculated by the authors based on DHL [11], Ecommerce Europe [10], Eurostat [6], Promodo [9], SHCAII [12]
The use of AI tools in e-commerce is becoming more comprehensive, covering customer service, logistics, and personalization (Table 3). In 2025, a significant share of online businesses have already integrated chatbots: about 50% of retailers in Germany, 45% in France, and 40% in Poland, while in countries with less mature digital markets these figures are lower (30% in Italy and ~25% in Ukraine). Logistics AI solutions are also being actively implemented: 35– 40% of platforms in Western Europe use algorithms for inventory management, while this level is 25–30% in Spain and Poland. The most widespread use of AI is personalization – over 60–70% of retailers in the Netherlands and Germany, 50–60% in France and Poland, and about 30% in Ukraine. Such differences are determined by different levels of digital maturity: developed markets have more resources to integrate innovations, while other countries focus on the basic elements of e-commerce. In SME-dominated markets, this pattern translates into a selective and pragmatic adoption strategy. Small enterprises prioritize tools with immediate operational value – chatbots for customer service and basic recommendation engines – while postponing capital-intensive solutions in logistics or data integration. This fragmented model of AI adoption is typical for SMEs and fundamentally differs from the systemic, end-to-end automation strategies observed in large corporations.
Table 3. Prevalence of AI Use in E-Commerce by Direction (as of 2025), % of Enterprises
|
Country |
Customer service (chat bots), % |
Logistics operations (warehouse, delivery), % |
Personalization of offers, % |
Characteristics of the AI adoption level |
|
Germany |
50 |
40 |
70 |
High level of AI integration in all directions |
|
France |
45 |
30 |
60 |
Rapid growth in personalization |
|
Italy |
30 |
20 |
40 |
Low digital maturity, limited adoption |
|
Spain |
35 |
25 |
50 |
Moderate expansion of AI, emphasis on personalization |
|
Poland |
40 |
30 |
50 |
Dynamic market, rapid scaling of solutions |
|
The Netherlands |
55 |
35 |
65 |
One of the European leaders in AI e-commerce |
|
Ukraine |
25 |
15 |
30 |
Early stage of implementation, uneven coverage |
Source: calculated by the authors based on DHL [11], Ecommerce Europe [10], Eurostat [6], Promodo [9], SHCAII [12]
An integral assessment of the achieved progress was carried out by calculating the E-Commerce Index and the AI Adoption Index (normalized values from 0 to 1). The obtained results of the country ranking confirm significant differences (Table 4). The highest E-Commerce Index was recorded in Germany (0.90), which reflects the combination of the largest volume of online sales and a high share of online trade in retail turnover. The group of leaders in terms of e-commerce development also includes the Netherlands and France (0.82 and 0.78, respectively). Spain and Poland have somewhat lower, but close values (about 0.6–0.7). In contrast, Italy (0.50) and Ukraine (0.32) demonstrated the lowest integral indicators of e-commerce development among the sample. Similarly, the Netherlands (0.88) and Germany (0.85) lead in the AI Adoption Index, followed by France (~0.70) and Poland (~0.50), Italy (0.40), and Ukraine (0.25). The average value of the E-Commerce Index for the seven countries is 0.66 with a standard deviation of 0.21 (coefficient of variation CV ~ 32%), while the average is 0.55 with σ = 0.25 for the AI Adoption Index (CV ~ 45%). This indicates a greater variability in the levels of AI adoption between countries compared to the indicators of the development of online commerce.
Table 4. Integral Indices of E-Commerce Development and AI Adoption (2025).
|
Country |
E-Commerce Index |
Rank (e-commerce) |
AI Adoption Index |
Rank (AI) |
|
Germany |
0.90 |
1 |
0.85 |
2 |
|
France |
0.78 |
3 |
0.70 |
3 |
|
Italy |
0.50 |
6 |
0.40 |
6 |
|
Spain |
0.65 |
5 |
0.55 |
4 |
|
Poland |
0.67 |
4 |
0.50 |
5 |
|
The Netherlands |
0.82 |
2 |
0.88 |
1 |
|
Ukraine |
0.32 |
7 |
0.25 |
7 |
Source: calculated by the author based on DHL [11], Ecommerce Europe [10], Eurostat [6], Promodo [9], SHCAII [12]
Cluster analysis (k-means algorithm) identified three clear groups of countries based on the combination of ecommerce development and AI adoption levels. However, given the limited number of observations, the cluster solution should be interpreted as an exploratory classification rather than a statistically validated segmentation. The first cluster (“leaders”) united the states with the highest values of both indices – it included Germany and the Netherlands. The second cluster (“followers”) included countries with average indicators (France, Spain, Poland). The third group (“catch-ups”) included Italy and Ukraine, which lag behind the others in both integral indices. The observed configuration is typical for economies where e-commerce ecosystems are primarily composed of small and mediumsized enterprises. In such systems, digital transformation proceeds through gradual capability accumulation rather than through large-scale platform restructuring. The distance between the clusters confirms a significant gap: the average value of the E-Commerce Index in the “leaders” cluster (~ 0.86) is more than twice as high as the similar indicator in the “catch-ups” cluster (~ 0.41), and the difference in the AI Adoption Index is even more striking (0.87 versus 0.33). So, Ukraine is clearly positioned in the group of countries that are significantly lagging behind in terms of the level of digital transformation in retail.
The results of the econometric analysis quantitatively confirm the close positive relationship between the AI adoption and the development of e-commerce (Table 5). The number of observations is very limited (n = 7), which constrains the robustness of statistical inference and increases the sensitivity of the results to individual data points. However, this result should be interpreted as a robust statistical association rather than as proof of a causal effect. In this table, Coefficient β reflects the strength and direction of the influence of the corresponding variable on the E-Commerce Index. The t-statistic is used to test the hypothesis of the significance of the coefficients, and the p-value shows the probability that the obtained effect is random. R² indicates the proportion of the variation of the dependent variable explained by the model, while the F-test assesses the overall statistical significance of the regression equation. All calculations are performed with df (degrees of freedom) = 3, which reflects the number of degrees of freedom for t-tests in the model.
Table 5. Results of Regression Analysis (dependent variable – E-Commerce Index).
|
Indicator |
β |
t-statistic (df=3) |
p-value |
|
Constant |
–0.12 |
–0.48 |
0.657 |
|
AI Adoption Index |
0.8 |
4.17 |
0.024 |
|
GDP per capita |
0.15 |
1.03 |
0.373 |
|
Internet penetration rate |
0.1 |
0.74 |
0.502 |
|
R² |
0.84 |
– |
– |
|
F (model) |
5.35 |
p = 0.091 |
– |
Source: calculated by the author based on DHL [11], Ecommerce Europe [10], Eurostat [6], Promodo [9], SHCAII [12]
According to the results of the regression estimation, the coefficient for the variable AI Adoption Index is positive and statistically significant (β ~ 0.8; p < 0.05). This means that a 0.1-point higher AI Adoption Index is associated, on average, with a 0.08-point higher E-Commerce Index, other things being equal; however, this estimate should be treated as indicative given the very small sample size. The control variables – GDP per capita and Internet penetration – were not statistically significant in this specification, which suggests that AI adoption is more strongly associated with intercountry differences in e-commerce development within the sample. Although the coefficient of determination (R² = 0.84) indicates a high proportion of explained variance, this result should be interpreted with caution, as with such a small sample size high R² values may arise from overfitting and do not necessarily indicate a reliable or robust model (F-test p = 0.091). Therefore, the regression results should be interpreted with caution, and the reported relationships should be considered indicative rather than statistically robust (Table 5). Thus, the statistical results provide preliminary evidence of a positive association between AI adoption and e-commerce development, but they do not offer strong statistical confirmation given the limited sample and marginal overall model significance.
So, the actual data show persistent differences in the development of e-commerce and AI adoption levels between the studied countries, and also confirm the positive correlation between these phenomena. Taken together, the results of the quantitative analysis outline a clear pattern: economies with higher AI maturity of business also tend to exhibit more intensive development of online trade. This creates an empirical basis for further discussion of the reasons for the identified differences and possible ways to reduce the digital divide.
5. Discussion
The obtained results suggest a positive association between AI adoption and the development of e-commerce; however, this relationship should be interpreted cautiously, as the overall regression model does not reach conventional levels of statistical significance. At the same time, the small sample size limits the reliability of statistical inference and implies that the identified relationships should be interpreted as preliminary rather than definitive. In addition, the short observation period limits the ability to capture lagged and cumulative effects of AI adoption on e-commerce development. This relationship may be partially associated with the dominance of small and medium-sized enterprises in national e-commerce ecosystems; however, this interpretation is indirect and should be treated with caution given the aggregated nature of the data. The strong relationship between the AI Adoption Index and the E-Commerce Index revealed in this study not only confirms the general thesis about the role of AI in the digital economy, but also clarifies it at the cross-country level. In contrast to the approach of Aljarboa, which focuses mainly on the micro-level of competitive advantages of individual enterprises, the obtained results indicate that the association between AI adoption and e-commerce development is observable at the level of national e-commerce markets and retains statistical significance even after taking into account macroeconomic factors [1]. Compared with the results of Marino et al. and Criveanu, where digital intensity is considered as a generalized driver of economic growth, this study shows that the depth of AI integration into e-commerce business processes, rather than the overall level of digitalization, is the key factor in differentiating between countries [2,34]. In contrast to these studies, our study shows that digital intensity alone is not a sufficient explanation for cross-country differences: the depth of AI adoption into key e-commerce business functions is the determining factor.
At the same time, the results of this study complement earlier studies with an important empirical clarification: the association of AI adoption with e-commerce development appears stronger than that of traditional macroeconomic factors in the estimated model, such as GDP per capita or the level of Internet penetration. So, the results of our study partially correct the conclusions of Orzoł and Szopik-Depczyńska, demonstrating that under the conditions of an established digital infrastructure, AI adoption is more strongly associated with variation in the development of ecommerce than the macroeconomic parameters included in the model [30]. Our results indicate that, given a high basic digital infrastructure, the innovative component associated with AI may serve as an important differentiating factor between countries. Nevertheless, these findings should be interpreted cautiously, because the empirical design does not allow us to infer that AI adoption causes e-commerce development; reverse influence and omitted contextual factors remain possible. In particular, the omission of additional structural variables, such as institutional quality, innovation capacity, and human capital indicators, may lead to omitted variable bias and affect the estimated relationships.
The comparison of clusters confirms the thesis of He and Liu about the uneven evolution of the directions of application of AI in e-commerce [16]. Leading countries (Germany, Netherlands) combine a high level of personalization, logistics automation and customer support, which corresponds to the model of “integrated use of AI” described by Pallathadka et al. [24]. In contrast, countries in the “catch-up” cluster demonstrate fragmented implementation of individual tools, which confirms Erdoğan’s warning about the prevalence of technical solutions without systemic economic effect [27]. However, in SME-driven environments, such fragmentation should not be interpreted solely as inefficiency. It represents a rational adaptation strategy under capital constraints, where small firms prioritize modular, low-risk AI tools with immediate returns. Thus, the “catch-up” pattern observed for Italy and Ukraine reflects not technological backwardness per se, but the structural logic of SME-centered digital ecosystems. Unlike regression analysis, clustering has independent analytical value, as it identifies typical patterns of combination of AI maturity and e-commerce development, which are not reduced to linear impact.
The results on the dominance of personalization as an AI application direction are consistent with the empirical findings of Necula and Păvăloaia and Valencia-Arias et al., which show that recommender systems have the most direct impact on consumer conversion and behaviour [4,35]. At the same time, the results of our study complement earlier studies by showing that the economic effect of personalization significantly depends on the overall level of AI maturity of the country, and not only on the scale of the market or industry structure. For SMEs, personalization tools often serve as the entry point into AI adoption. Unlike large corporations that deploy complex, integrated AI architectures, small enterprises rely on plug-in recommender systems and chatbot-based interaction. The study demonstrates that even this limited form of AI integration generates measurable macro-level effects, thereby revealing the aggregate economic relevance of micro-level SME innovations. This extends the findings of Madanchian, who focuses mainly on the marketing aspects of AI [26].
The inclusion of Ukraine in the international sample is of particular academic value. Unlike the studies of Romanchuk et al. and Volynets et al., where the analysis is reduced to the national context, our study shows the position of Ukraine relative to the EU countries [3,19]. The identified gap between Ukraine and the leading countries confirms the structural barriers to digital transformation, which are noted by Mushnykova et al., while the high growth rates of individual indicators are consistent with the results of Zatonatska et al. on the dynamics of demand in the context of transformation processes [31,32]. The obtained results for Ukraine extend beyond a purely national case and can be interpreted as representative of transition economies with SME-dominated markets, limited investment capacity, and high adaptive pressure. In such contexts, AI-driven e-commerce development follows a non-linear trajectory, where resilience and experimentation substitute for scale and capital intensity.
A number of limitations of the study should be noted. First, the analysis is based on aggregated national indicators, which does not allow taking into account intra-industry differences. Second, the short time horizon (2023–2025) limits the possibility of analysing long-term structural and lagged effects of AI adoption on e-commerce development. Third, the limited sample size (seven countries) reduces statistical power, increases sensitivity to individual observations, and may affect the stability of regression estimates. Fourth, the use of equal weights in constructing the composite indices may oversimplify the relative contribution of individual indicators and does not account for potential differences in their economic significance. Fifth, the regression model includes a limited set of control variables, which may not fully capture broader structural and institutional determinants of e-commerce development. Sixth, the clustering results are not supported by formal validation statistics due to the small sample size and should be considered indicative.
Despite these limitations, the results of our study contribute to the development of academically grounded ideas about the role of AI in e-commerce, demonstrating that AI appears to be one of several factors associated with the development of digital commerce ecosystems, rather than a dominant or system-forming driver. Therefore, unlike most previous studies that focus on individual aspects of the use of AI, our study offers a holistic quantitative framework for cross-country comparison of its economic effects in the field of e-commerce.
6. Conclusions
The study summarizes the current trends in the development of e-commerce in view of the spread of AI technologies and quantifies it in an inter-country comparative dimension. Based on the agreed statistics for 2023–2025, integral indices of e-commerce development and AI adoption were formed for six countries of the EU and Ukraine, which ensured the comparability of results and reproducibility of the analysis.
The obtained empirical results indicate persistent inter-country differences in the levels of e-commerce development and technological integration of AI. However, these findings should be interpreted with caution due to the small sample size, which limits the robustness and generalizability of the statistical results. The comparative analysis showed that countries with higher AI business maturity, as a rule, also demonstrate more intensive development of online trade, while economies with a lower level of AI adoption are characterized by fragmented digital transformation. The correlation and regression analysis confirmed that the AI Adoption Index is a statistically significant variable associated with variation in the development of e-commerce in the sample, while traditional macroeconomic variables play a supporting role. However, this finding should not be interpreted as evidence of a dominant or system-forming role of AI, but rather as an indication of its association with cross-country variation in e-commerce development. Cluster analysis, in turn, typified countries by a combination of e-commerce and AI maturity levels and distinguished the models of “leaders”, “followers”, and “catch-ups”.
The academic novelty of the study is the proposed comprehensive index approach to measuring the relationship between AI adoption and e-commerce development in a cross-country context, based on the most recent empirical and theoretical contributions in the field. Unlike most existing international empirical studies that focus on individual technologies or industry cases, our study combines integral indicators, econometric analysis, and clustering into a single quantitative framework. A separate contribution is the inclusion of Ukraine in a comparative sample with the leading EU markets, which not only reveals national characteristics, but also enables interpreting the results obtained in the broader context of transition economies.
The practical value of the obtained results is the possibility of their use by various groups of stakeholders. For government authorities, the results can be used as an analytical basis for shaping a digital transformation policy aimed at stimulating the implementation of AI in the trade sector. For businesses and online platforms, the study outlines the areas in which the use of AI provides the greatest economic effect, in particular in the personalization of offers, inventory management, and logistics processes. For investors and financial institutions, integral indices can be used as a tool for assessing the digital maturity of markets and the potential for their further growth. At the same time, our study has certain limitations. The analysis is based on aggregated national indicators, which does not allow taking into account intra-industry and company differences in the AI adoption. Furthermore, the limited time horizon (2023–2025) does not enable tracing the long-term structural effects of the AI use. In addition, because the study relies on observational and comparative cross-country data, its results do not establish a causal effect of AI adoption on ecommerce development. The use of equal weights in constructing integral indices, although methodologically justified for transparency and comparability, represents a simplifying assumption that may not fully reflect the relative importance of individual components.
Also, the results are particularly relevant for small and medium-sized enterprises, which dominate e-commerce markets in transition and catching-up economies. For SMEs, artificial intelligence does not function as a large-scale infrastructural technology, but rather as a scalable tool for incremental competitiveness. The empirical evidence suggests that even fragmented AI adoption at the aggregate level is associated with differences in national e-commerce performance; however, direct conclusions about SME-level behaviour cannot be drawn from the available data. This confirms that SME-driven digital ecosystems can achieve structural transformation without full platform-scale automation, relying instead on modular and low-risk technological integration. Thus, the study demonstrates that SMEbased digital ecosystems can achieve structural transformation without platform-scale automation, relying instead on incremental and modular AI integration.
Given these limitations, the prospects for further research are associated with expanding the time frame of analysis and moving to micro-level data, which enables assessing the differentiated impact of AI on individual segments of ecommerce. It is also appropriate to deepen the analysis of institutional and regulatory factors that mediate the economic effect of AI. For Ukraine, the study of the mechanisms for state support and stimulating innovations can accelerate the integration of AI without increasing structural imbalances in digital development.
All the Declarations and StatementsAuthor Contributions Statement
All authors contributed to the conception and design of the study, collection and processing of data, interpretation of the results, drafting of the manuscript, and critical revision of the final text.
All authors have read and approved the final version of the manuscript.
Conflict of Interest Statement
The authors declare that they have no known competing financial interests or personal relationships that could have appeared to influence the work reported in this paper.
Funding Declaration
None. This research received no external funding.
Data Availability Statement
The data used in this study were compiled by the authors from open statistical and analytical sources cited in the manuscript. The processed dataset is available from the corresponding author upon reasonable request.
Ethical Declarations
None. The study was based exclusively on open secondary statistical and analytical sources and did not involve human participants, animals, medical data, or personal sensitive data.
Acknowledgments
None.
Declaration of Generative AI in Scholarly Writing
None.
Abbreviations
None.
Appendix
None.