Air quality prediction in Visakhapatnam with LSTM based recurrent neural networks

Author: K. Srinivasa Rao, G. Lavanya Devi, N. Ramesh
Journal: International Journal of Intelligent Systems and Applications @ijisa
Article in issue: 2 vol.11, 2019.
Free access
The research activity considered in this paper concerns about efficient approach for modeling and prediction of air quality. Poor air quality is an environmental hazard that has become a great challenge across the globe. Therefore, ambient air quality assessment and prediction has become a significant area of study. In general, air quality refers to quantification of pollution free air in a particular location. It is determined by measuring different types of pollution indicators in the atmosphere. Traditional approaches depend on numerical methods to estimate the air pollutant concentration and require lots of computing power. Moreover, these methods cannot draw insights from the abundant data available. To address this issue, the proposed study puts forward a deep learning approach for quantification and prediction of ambient air quality. Recurrent neural networks (RNN) based framework with special structured memory cells known as Long Short Term Memory (LSTM) is proposed to capture the dependencies in various pollutants and to perform air quality prediction. Real time dataset of the city Visakhapatnam having a record of 12 pollutants was considered for the study. Modeling of temporal sequence data of each pollutant was performed for forecasting hourly based concentrations. Experimental results show that proposed RNN-LSTM frame work attained higher accuracy in estimating hourly based air ambience. Further, this model may be enhanced by adopting bidirectional mechanism in recurrent layer.
Air quality, air pollution, prediction, environment, deep learning, recurrent neural networks, long short term memory
Short address: https://sciup.org/15016569
IDR: 15016569 | DOI: 10.5815/ijisa.2019.02.03
Text of the scientific article Air quality prediction in Visakhapatnam with LSTM based recurrent neural networks
Published Online February 2019 in MECS
Urbanization along with digital era has become inevitable and has thrown significant challenges to the human race. Urban air pollution poses a significant hazard to the eco system. Air quality depreciates due to different types of pollutants produced into the atmosphere by natural and man-made developments. In general, the quality of air in the atmosphere is quantified by a measure that is universally known as the Air Quality Index (AQI) [1]. It depends on the concentration of pollutants in the atmosphere such as PM2.5, PM10, NO, NO2, NOX, NH3, SO2, CO, Ozone, Benzene, Toluene, and Xylene. Air quality forecasting techniques are being rapidly advanced as the demand for measuring pollution increases. Traditional approaches for air quality prediction use mathematical and statistical techniques [2]. These conventional forecasting models basically demand a great amount of computing resources. In addition, the model’s accuracy depends on the model structure itself and cannot improve regardless the amount of training data. With the recent advances in computation, novel modeling approaches for predicting AQI have been initiated. Deep learning is one such approach that produced state-of-the-art results for classification and prediction tasks.
Deep learning methodology has accomplished outstanding results in solving real world problems of various domains such as computer vision (autonomous cars, smart cameras) [3], natural language processors (Google home, Amazon Alexa) [4,5], traffic speed prediction and accident risk prediction [6] etc. Gradual downfall in the air quality in most of the urban areas around the globe has become a great challenge to the present society. With the promising results obtained by deep learning methods, researchers are inspired to get benefitted by adopting this methodology to various issues related to air quality studies.
Geographically, every location/place/city has its own distinguished features. As a reason, better results could be achieved if air quality studies/research is carried out region wise. This gives a broader elevation to features like population (square kilometers), industries located; vehicles in the region etc. and can be studied with more inference. As a reason, this research concentrates to carry out the proposed methodology for the city Visakhapatnam.
This paper presents a deep learning based approach for predicting air ambience in Visakhapatnam. The main contributions of this research paper are:
-
• LSTM based RNN framework for forecasting concentrations of air pollutants in Visakhapatnam is proposed.
-
• Empirical analysis has been carried out on dataset of Visakhapatnam and the proposed model achieved superior results over baseline approaches.
-
• Prediction of the concentration levels of pollutants in hourly basis is emphasized over day wise and seasonal prediction as considered by most of the models.
The overall structure of this research paper is as follows. Section 2 presents related work. Proposed approach RNN-LSTM is given in Section 3. Section 4 discusses about the experimental setup for evaluation of the proposed model. Finally, Section 5 gives conclusions along with future scope of the work.
-
II. Related Work
Deep learning approaches have emerged as powerful solutions to mitigate these limitations over conventional methods [13]. Most popular deep learning techniques are Multi Layer Perceptron (MLP), Deep Belief Nets (DBN), Convolutional Neural Networks (CNN), Recurrent Neural Networks (RNN) and Auto Encoders (AE) [8, 9, 10, 11, 20]. Particularly, RNN based models for predicting air quality have drawn much attention in the recent times.
RNN [12] is a family of neural networks for processing sequential data. RNN can be assumed as adding of loops to the basic feed forward neural network design. For instance, in a certain input layer, every neuron may pass its signal edgewise in adding forward to the subsequent layer. The output of the neural network may feedback as an input to the network with next input vector and it is continued in the similar fashion. The primary technique for training in feed forward neural networks is to back propagate error and update the neural network weights. Back propagation cannot be accommodated in RNN, because of the recurrent or loop connections. This problem is addressed with adjustment of back propagation technique called Back Propagation Trough Time (BPTT).
Whenever Back propagation is used in RNN, the error or gradients that are calculated in order to update the weights can get unsteady. This problem is called as exploding gradients for very large numbers and vanishing gradient problem for very small numbers. This problem has been addressed by a novel kind of architecture termed as Long Short Term Memory Networks (LSTM) [7]. It was introduced by Hochreiter and Schmidhuber where a memory block takes the place of each neuron in the hidden layer of RNN [12]. While many LSTM architectures differ in their structure and activation functions, all of them have explicit memory cells with complicated dynamics allowing it to easily memorize information for an extended number of time steps.
Several statistical models have been used to forecast air quality. Li et al. have studied air quality forecasting using multiple layer regression on satellite data [26]. Box et al. have used time series analysis techniques for forecasting and monitoring air quality [33]. Nieto et al . have used SVM based regression model to study the air quality at local scale in Oviedo urban area. Machine learning techniques equally gained much attention [34]. E Kalapanidas et al. have proposed a naïve approach using machine learning techniques for air quality prediction [32]. Athanasiadis et al . have performed elaborate studies on air quality data in real time through machine learning approach [31]. Dixian et al. have developed an approach for optimizing and regularization of machine learning models for air quality prediction [32].
These studies point out that conventional methods need prior knowledge about the model structure and are based on theoretical hypothesis. Also, they work with various data constraints. Statistical models apply simple parameter based methods surpassing the complicated structures. Hence, these models may not reveal valuable insights of the data.
Xiang et al. have proposed a RNN based model for predicting air pollutant concentrations along with an evaluation strategy [27]. A deep air system was developed by Vikram et al. for forecasting pollution in Beijing [14]. Athira et al. have applied various RNN variants for air quality prediction [35].
-
III. Proposed Approach
This paper puts forward a RNN based model for forecasting pollutant concentrations by considering temporal sequential data of a particular pollutant.
Model Hypothesis/ Problem Formulation
The hypothesis of this model is, given a temporal sequence data of pollutant concentration values and metrological parameters of a particular location, the model will capture the dependencies in the data and predicts the next hour pollutant concentrations. The intuition is to derive inferences from sequential features to better represent data. The model is trained by providing hourly concentration values of pollutants to uncover hidden patterns across the past temporal values of the pollutants.
Given, metrological parameters m ={m 1 , m 2 , m 3 , m 4 , m 5 ,m 6 } and pollutant concentrations x t , t = 1..T as a paired input X ={( m, x t )}, the objective of the proposed model is to recognize patterns and predict x t+1 . RNN architecture depicted in Figure 1 is used to model concentrations of air pollutants in this paper.
At each time step, the model comprises of processing input, recurrent and output layers.
Input Layer: This layer generates dense embedding of pollutant concentrations and metrological parameters by concatenation.
X e = f ( x t , m ) (1)
where the function f generates embedding vector x te for the given input of vectors x t , and m . Thus obtained embedding vector is passed to subsequent recurrent layer. Recurrent Layer: This layer generates hidden representations of uncovered sequential features from embedding vector xt e . The hidden states ht are computed by using input from previous time step h t-1 and current input x te . The hidden state is now updated using the following equation:
h = 0 ( x t , h t - 1 ) (2)
Where Φ is a memory cell module of LSTM.
Output Layer: This final layer generates concentration values of next hour time step of the pollutant considered with y t .
LSTM [7] is preferred in this architecture as it is a special kind of RNN that alleviates gradient vanishing problem and has the capability of learning long term dependencies. The proposed architecture, RNN-LSTM is vital to enhance the prediction performance of concentration values.
In contrast to the RNN layer cell module, RNN-LSTM has three gates to preserve long term dependencies. The essential components of LSTM layer are states: provide information to the hidden layer, output layer.
gates: monitor information flow of states.
ot = ^(WX 0 xt + Wh 0 ht-1 + b0)
ct = ft * ct-1 + it * tanh(Wxgxt + bg )
ht = Ot *tanh(Ct)
Here σ is the logistic sigmoid function or ReLU.
-
i, f, o and c are input gate, forget gate, output gate, and cell activation vectors respectively. All these vectors are of the same size as the hidden vector h.
Wxi , Wxf ,Wxo ,Wxg are projection matrices.
Whi , Whf , Who are recurrent weight matrices.
This model is trained for learning parameters by Adam, a stochastic gradient descent optimization technique. The loss function used in this model is root mean square error (RMSE) function. Finally, training is carried out for fixed number of time steps using back propagation through time (BPTT).
-
IV. Experimental Setup
The model is trained with the real time data collected from the Central Pollution Control Board (CPCB), of the city Visakhapatnam for the period July 1, 2016 to May 17, 2018 [18, 19]. This is an industrial city situated in coastal area with bowl type geographical structure located in state of Andhra Pradesh, India [15, 16, 17]. Moreover, it is rapidly transforming into dense urban area due to advents of digitalization. The set of air pollutants and meteorological parameters used in this research study are shown in Tables 1 and 2 respectively.
Table 1. List of pollutants considered
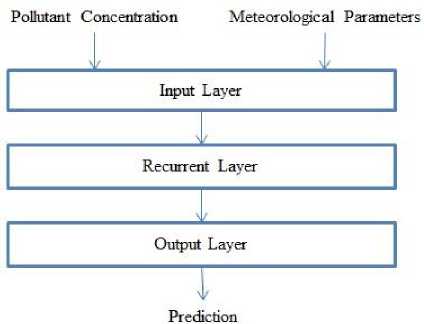
Fig.1. RNN Architecture for predicting pollutant concentrations
The computations over states and gates at time step t are defined as follows:
i t = ^ W Xi X t + W hi h t - I + b i) (3)
f = a (W f x , + W f h - i + b f ) (4)
|
Sno |
Parameters |
Unit |
|
1 |
PM 2.5 (Particulate matter 2.5) |
ug/m3 |
|
2 |
PM 10 (Particulate matter 2.5 to 10) |
ug/m3 |
|
3 |
NO (Nitrogen oxide) |
ug/m3 |
|
4 |
NO 2 (Nitrogen dioxide) |
ug/m3 |
|
5 |
NO X (Nitrogen oxides) |
ug/m3 |
|
6 |
NH3 (Ammonia) |
ug/m3 |
|
7 |
SO 2 (Sulfur dioxide) |
ug/m3 |
|
8 |
CO (Carbon monoxide) |
ug/m3 |
|
9 |
Ozone |
ug/m3 |
|
10 |
Benzene |
ug/m3 |
|
11 |
Toluene |
ug/m3 |
|
12 |
Xylene |
ug/m3 |
Table 2. Meteorological parameters
|
Sno |
Parameters |
Unit |
|
1 |
Ambient Temperature |
0C |
|
2 |
Relative Humidity |
% |
|
3 |
Wind Direction |
degree |
|
4 |
Solar Radiation |
W/mt2 |
|
5 |
Pressure |
mmHg |
|
6 |
Rain Fall |
mm |
Data obtained from the aforementioned source has to be preprocessed as noisy data affects the performance of the forecasting model. Missing values add more noise to data [23]. For the proposed model, missing values were imputed by mean values of the respective parameter [24]. Thus, the final dataset considered has 14,379 samples for each pollutant. Descriptive statistics of each pollutant of the city Visakhapatnam is given in Table 3.
Table 3. Summary statistics of pollutants
|
PM2.5 |
PM10 |
NO |
NO 2 |
NO x |
NH 3 |
SO 2 |
CO |
Ozone |
Benzene |
Toluene |
Xylene |
|
|
min |
0 |
0 |
-4.28 |
-32.98 |
-3.6 |
-13.85 |
-8.88 |
0 |
-106.9 |
0 |
0 |
0 |
|
Q1 |
30.5 |
69.25 |
2.45 |
13.78 |
9.92 |
5.92 |
6.06 |
0 |
9.48 |
2.65 |
5.52 |
1.08 |
|
Q2 |
47 |
94 |
4.67 |
23.28 |
17.1 |
9.95 |
10.78 |
0.54 |
22.15 |
3.95 |
8.52 |
2.23 |
|
Q3 |
64 |
123 |
11.95 |
42.81 |
31.72 |
13.45 |
18.63 |
1 |
59.53 |
6 |
12.22 |
4.25 |
|
max |
890 |
862 |
453 |
195.6 |
408.25 |
275.85 |
627.53 |
20.92 |
628.67 |
57.52 |
88.8 |
68.68 |
|
mean |
50.11 |
103.24 |
12.78 |
31.84 |
26.21 |
9.99 |
20.56 |
0.61 |
37.41 |
4.77 |
9.63 |
3.64 |
|
std |
32.41 |
58.27 |
22.71 |
26.68 |
27.45 |
8.03 |
51.12 |
0.68 |
38.87 |
3.31 |
6.53 |
4.43 |
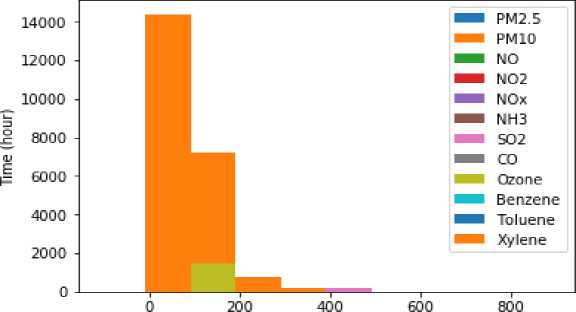
The graphical representation of the Visakhapatnam air pollutants data is presented in Figure 2 and 3.
pollutants values
Fig.2. Bar chart of air pollutants
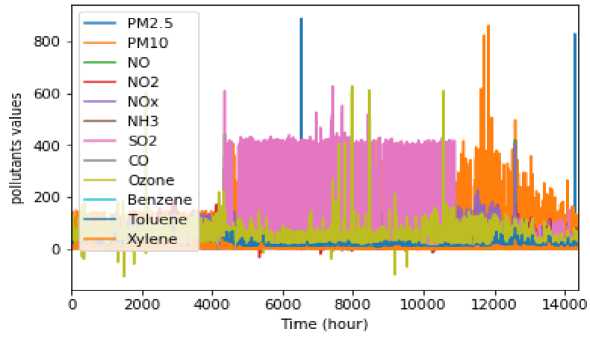
Fig.3. Mat plot of air pollutants
The objective of this paper is to develop a framework to predict the air pollutant concentration of the next hour on the basis of the past air quality data. Performance obtained by RNN-LSTM has to be evaluated empirically [25]. The metrics considered for evaluation are Root Mean Squared Error (RMSE), Mean Absolute Error (MAE) and Coefficient of Determination (R2) [27]. 70% of the dataset was considered for training and the remaining 30% is utilized for testing the model. Cross validation is adopted to minimize the bias at the training phase. The results obtained on evaluation of RNN-LSTM model are compared against variants of base line regression technique Support Vector Regressor (SVR) [21,22]. The values obtained are depicted in Table 4. Comparison was performed with statistical technique, SVR with linear and non liner kernels. It is well known for its performance in fore casting time series data.
Table 4. Performance comparison of RNN-LSTM with baseline models
|
SNO |
POLLUTANT |
SVR- KERNEL-RBF |
SVR- KERNEL-POLY |
SVR- KERNEL- LINEAR |
RNN-LSTM MODEL |
||||||||
|
RMSE |
MAE |
R2 |
RMSE |
MAE |
R2 |
RMSE |
MAE |
R2 |
RMSE |
MAE |
R2 |
||
|
1 |
PM2.5 |
25.72 |
661.61 |
0.31 |
30.01 |
900.54 |
0.08 |
19.92 |
396.87 |
0.59 |
17.97 |
322.81 |
0.70 |
|
2 |
PM10 |
34.04 |
1158.43 |
0.65 |
32.48 |
1054.8 |
0.69 |
36.69 |
1346.7 |
0.61 |
31.23 |
975.04 |
0.78 |
|
3 |
NO |
36.02 |
1297.39 |
-1.46 |
35.26 |
1243 |
-1.36 |
39.97 |
1597.3 |
-2.03 |
20.09 |
403.79 |
0.26 |
|
4 |
NO 2 |
12.6 |
158.74 |
0.79 |
13.63 |
185.83 |
0.74 |
13.63 |
185.83 |
0.74 |
10.36 |
107.27 |
0.82 |
|
5 |
NO X |
26.35 |
694.04 |
0.09 |
25.99 |
675.78 |
0.12 |
27.34 |
747.71 |
0.03 |
17.55 |
308.1 |
0.59 |
|
6 |
NH 3 |
19.85 |
394.09 |
-5.08 |
19.85 |
393.88 |
-5.01 |
19.62 |
385.14 |
-4.88 |
8.66 |
74.91 |
-0.01 |
|
7 |
SO 2 |
66.42 |
4412.19 |
-0.69 |
66.96 |
4483.4 |
-0.67 |
66.94 |
4481 |
-0.67 |
71.11 |
5056.1 |
-0.41 |
|
8 |
CO |
1.42 |
2.02 |
-3.27 |
1.32 |
1.75 |
-2.69 |
1.63 |
2.67 |
-4.63 |
0.47 |
0.22 |
0.43 |
|
9 |
OZONE |
47.48 |
2253.98 |
-0.47 |
47.31 |
2238.6 |
-0.46 |
49.58 |
2457.7 |
-0.6 |
28.04 |
786.39 |
0.48 |
|
10 |
BENZENE |
2.68 |
7.14 |
0.36 |
2.59 |
6.67 |
0.39 |
2.75 |
7.54 |
0.32 |
1.59 |
2.53 |
0.71 |
|
11 |
TOLUENE |
4.47 |
19.96 |
0.54 |
4.52 |
20.41 |
0.52 |
4.35 |
18.89 |
0.56 |
3.23 |
10.48 |
0.75 |
|
12 |
XYLENE |
3.82 |
14.61 |
0.27 |
3.69 |
13.61 |
0.32 |
3.48 |
12.08 |
0.39 |
1.44 |
2.08 |
0.63 |
The whole outcomes point out that RNN-LSTM model attains higher prediction accuracy when compared to
SVR model. Mat plot of compared models are depicted in Figure 4.
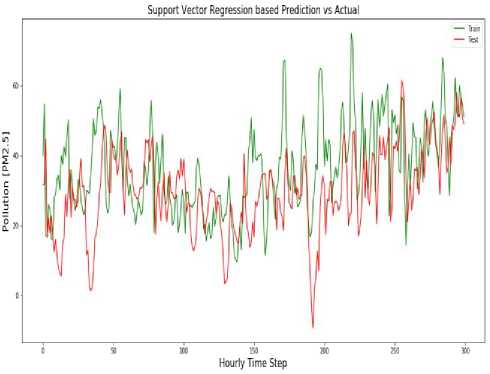
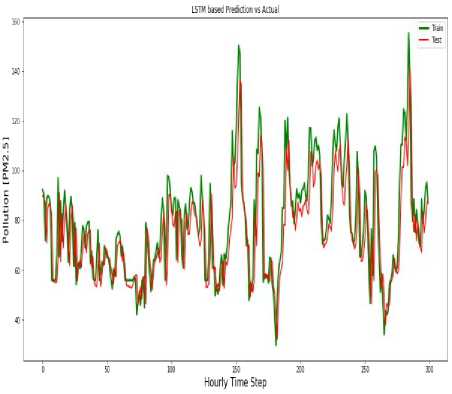
Fig.4. SVR Model vs. RNN-LSTM Model Prediction performance graph
A quick view of the model performance is given in Figure 5.
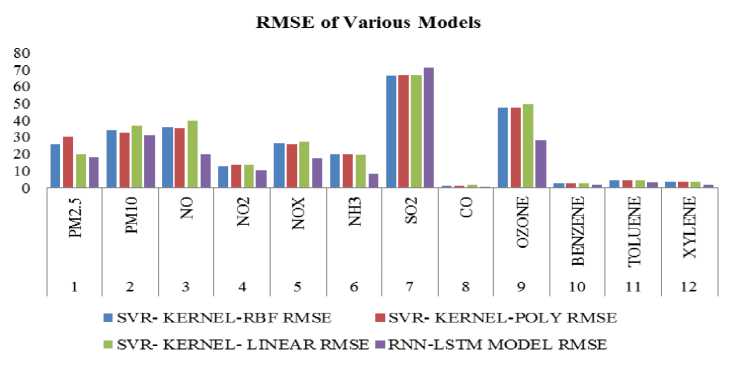
Fig.5. Performance Graph of RNN- LSTM and SVR models
Algorithms used in this experimental study are SVR-KERNEL-RBF (SVR with the radial basis function kernel), SVR-KERNEL-POLY (SVR with the polynomial kernel), SVR-KERNEL-LINEAR (SVR with the linear kernel) and RNN-LSTM. From the results (Table 4, Figure 4 and Figure 5), It clearly indicates that RNN-LSTM approach archives better performance in terms of evaluation metrics.
-
V. Conclusion
The purpose of the current study is to determine efficient forecasting model for hourly concentration levels of air pollutants. This paper proposed RNN-LSTM model that outputs pollutant concentrations, given temporal sequence data as input. Real time data of the city Visakhapatnam having 12 air pollutant values is considered for experimental analysis. The results of the work carried out support the idea that deep learning based techniques for forecasting air quality achieve promising performance over conventional strategies. The present work was carried out by considering single air pollutant values and metrological parameters at time for all the 12 pollutants chosen. This work can be extended by performing multivariant modeling of the 12 pollutants simultaneously. Also, the proposed model can be extended by bidirectional mechanism.
Acknowledgements
References Air quality prediction in Visakhapatnam with LSTM based recurrent neural networks
- Ganganjot Kaur Kang, Jerry Zeyu, Sancho, Shengqiang Lu, and Gang Xie. Air Quality Prediction: Big Data and Machine Learning Approaches [J]. International Journal of Environmental Science and Development, 2018, 9(1): 8-16.
- Niharika, Venkatadri M, and Padma S Rao. A Survey on Air Quality forecasting Techniques [J] International Journal of Computer Science and Information Technologies, 2014, .5():103-107.
- OriolVinyals, Alexander Toshev, SamyBengio and DumitruErhan. Show and tell: ANeural Image Caption Generator [C] in Proceedings of the IEEE Conference on Computer Vision and Pattern recognition, 2015, 3156–3164.
- Alex Graves, Abdel-rahman Mohamed and Geoffrey Hinton. Speech Recognition with Deep Recurrent Neural Networks[C], in Acoustics, Speech and Signal processing, IEEE, 2013, 6645– 6649.
- R.Collobert, JWeston, AUnified architecture for natural language processing:Deep neural networks with multitask learning[C], In Proceedings of the 25th International Conference on Machine Learning, 2008, 5-9.
- HongleiRen, You Song, Jingwen Wang, Yucheng Hu andJinzhi Lei. A Deep Learning Approach to the Citywide Traffic Accident Risk Prediction[R], https://arxiv.org/pdf/1710.09543.15, April, 2018.
- B. Hochreiter and J. Schmidhuber. Long Short Term Memory[J], Neural Computation, 1997, 9(): 1735-1780.
- J. Schmidhuber. Deep Learning in Neural Networks An Overview, 2014.
- M. Langkvist, L. Karlsson, and A. Loutfi. A Review of Unsupervised Feature Learning and Deep Learning for Time-Series Modeling[R], Pattern Recognition Letters, June, 2014, 42: 11-24.
- Y. LeCun, Y. Bengio, and G. Hinton. Deep Learning[R], Nature, 2015, 521: 436-444.
- I. M. Coelho, V. N. Coelho, E. J. d. S. Luz, L. S. Ochi, F. G. Guimarães, and E. Rios. A GPU Deep Learning Meta Heuristic based Model for Time Series Forecasting[R], Applied Energy, 2017.
- Z. C. Lipton et al. A Critical Review of Recurrent Neural Networks for Sequence Learning[R], 2015.
- Zhongang Qi et al. Deep Air Learning: Interpolation, Prediction, and Feature Analysis of Fine-grained Air Quality[R], In: CoRR abs/1711.00939,arXiv: 1711.00939. URL: http://arxiv.org/abs/1711.00939,2, Nov, 2017.
- Vikram Reddy et al. Deep Air: Forecasting Air Pollution in Beijing, China[R], 2017.
- TVBPS Rama Krishna, MK Reddy, RC Reddy, RN Singh and S Devotta. Modelling of Ambient Air Quality over Visakhapatnam Bowl Area[C], Proc Indian NatnSciAcad, 2006, 72(1): 55-61.
- SrinivasaRao S, N. SrinivasaRajamani, and E. U. B. Reddi. Dispersal Conditions and Assimilative Capacity of Air Environment at Gajuwaka Industrial Hub in Visakhapatnam [J], International Journal of Scientific Research in Science, Engineering and Technology, 2015, 1(4).
- https://www.visakhapatnamsmartcity.com/
- https://app.cpcbccr.com/ccr/#/caaqm-dashboard-all/caaqm-landing
- https://timesofindia.indiatimes.com/city/visakhapatnam/Ranked-5th-clean-city-Vizag-finds-air-pollution-on-the-rise/articleshow/51737679.cms
- Ian Goodfellow,YoshuaBengio and Aaron Courville. Deep Learning, MIT Press, 2016.
- KostandinaVeljanovska and Angel Dimoski. Air Quality Index Prediction Using Simple Machine Learning Algorithms [J], International Journal of Emerging Trends & Technology in Computer Science (IJETTCS), January – February 2018, 7(1).
- Bingyue Pan. Application of XGBoost algorithm in hourly PM2.5 concentration prediction[C], IOP Conf. Series: Earth and Environmental Science 113, 2018.
- Jiawei Han, Micheline Kamber, and Jian Pei. Data Mining: Concepts and Techniques, 3rd Edition, The Morgan Kaufmann Series in Data Management Systems, 2011.
- M. Sujatha, G. Lavanya Devi, K. SrinivasaRao and N. Ramesh. Rough Set Theory Based Missing Value Imputation[J], Cognitive Science and Health Bioinformatics. Springer Briefs in Applied Sciences and Technology. Springer, Singapore, Online ISBN 978-981-10-6653-5, 2018.
- Rami Al-Rfou et al. Theano: A Python framework for fast computation of mathematical expressions[R],arXiv preprint arXiv:1605.02688,2016.
- Li.C, Hsu N.C, Tsay.S. A Study on the potential applications of satellite data in air quality monitoring and forecasting [J], Atmos.Environ, 2011, 45:3663-3675.
- Xiang Li et al. Long short-term memory neural network for air pollutant concentration predictions: Method development and evaluation [J], Elsevier Ltd., Environmental Pollution, September, 2017, 231: 997-1004.
- Ibrahim Kok et al. A Deep Learning Model for Air Quality Prediction in Smart Cities[C], IEEE International Conference on Big Data (BIGDATA), 2017.
- S. Sharma , U. Kalra , S. Srivathsan , K.P.S. Rana , and V. Kumar. Efficient Air Pollutants Prediction using ANFIS Trained by Modified PSO Algorithm[C], IEEE, 2015.
- Athanasiadasi.I.N, Kaburaos,V.G, Mittkas P.A, and Petridis.V. Applying machine learning techniques on air quality data for real-time decision support[C], ITEE, 2003.
- Dixian Zhu,Changjie Cai, Tianbao Yang, and Xun Zhou. A Machine learning approach for air quality prediction: Model regularization and optimization[C], Big data and cognitive computing, 2018.
- E.Kalapanidas and N.Avouris. Applying machine learning techniquesin air quality prediction, 1999.
- Box G.E.P, Jenkins G.M. Time series analysis: forecasting and control”, J.Operational Res, 1976, 22:199-201.
- Nieto P.G, Combarro E.F,Del Coz Diaz J.J. A SVM- based regression model to study the air quality at local scale in Oviedo urban area(Northern Spain): a case study[J], Appl.Math.Comput, 2013, 8923-8937.
- Athira V, Geetha P, Vinayakumar R, Soman K P. DeepAirNet: Applying Recurrent Networks for Air Quality Prediction”,Elsevier, Procedia computer science, 2018, 132:1394-1403.
