An Algorithm for Assessing the Pathogenicity of Genetic Mutations in Tumor Based on a Retrospective Study of Pathogenic and Neutral Genetic Variants

Author: Bug D.S., Narkevich A.N., Tishkov A.V., Petukhova N.V.
Journal: Сибирский журнал клинической и экспериментальной медицины @cardiotomsk
Section: Цифровые технологии в медицине и здравоохранении
Article in issue: 1 т.40, 2025.
Free access
Introduction. Cancer is accounting for 16.8% of all deaths and 22.8% of noncommunicable disease-related deaths, approximately. The diagnostic, prognostic, and therapeutic aspects of patient management majorly depend on mutations that drive the oncogenic process. However, evaluating the clinical significance of the variant is a major challenge, as many of them become variants of unknown significance (VUS).Aim: of the current study is to create a new algorithm for classification of missense variants.Material and Methods. Data from the NCBI Assembly, Uniprot, GnomAD, and OncoKB databases was processed with Python 3 to assess oncogenicity, population frequency of missense variants, as well as their occurrence in orthologous sequences. We selected 314 known benign polymorphisms and 332 reported pathogenic mutations of BRCA1, BRCA2, DICER1, PIK3CA, and TP53 genes from the ClinVar database for training and testing datasets.Results. We have developed the algorithm that provides three criteria based on oncogenicity and population frequency of a variant, as well as its occurrence in orthologous sequences for assessing its potential pathogenicity. A variant was classified as neutral if the following was true: a) a variant doesn’t meet the criterion for oncogenicity; b) a variant meets at least one of the remaining criteria. All other variants were deemed to be pathogenic. The new algorithm demonstrates high sensitivity (94.95% (88.61%, 98.34%)) and specificity (96.52% (91.33%, 99.04%)) in classifying benign and pathogenic variants. The algorithm requires a position of a variant to be represented in population databases and to correspond to an appropriately aligned region in a multiple sequence alignment of orthologs, along with two adjacent positions.Conclusion. The algorithm might be used to evaluate the variants of other oncogenic genes, possibly making the classification of genetic variants more precise, intensifying molecular diagnostics.
Molecular pathology, mutation, clinical relevance, algorithms
Short address: https://sciup.org/149147873
IDR: 149147873 | UDC: 575.174.8:616-006-079.7:575.224 | DOI: 10.29001/2073-8552-2025-40-1-226-234
Алгоритм оценки патогенности мутаций при опухолях на основе ретроспективного исследования патогенных и нейтральных генетических вариантов
Во всем мире на долю злокачественных новообразований приходится примерно 16,8% всех смертей и 22,8% смертей, связанных с неинфекционными заболеваниями. Диагностические, прогностические и терапевтические аспекты ведения онкологических больных в значительной степени зависят от наличия драйверных генетических мутаций. Однако оценка клинической значимости этих вариантов может быть сложной задачей, и значение многих из них не удается определить.Цель исследования: разработка нового алгоритма для классификации миссенс-вариантов.Материал и методы. Данные из сборников NCBI Assembly, Uniprot, GnomAD и OncoKB были загружены и обработаны с использованием Python 3 для оценки онкогенности миссенс-вариантов и их распространенности в человеческой популяции и среди последовательностей-ортологов. Всего было отобрано 314 известных доброкачественных полиморфизмов и 332 патогенные мутации генов BRCA1, BRCA2, DICER1, PIK3CA и TP53 базы данных ClinVar, которые составили обучающий и тестовый наборы данных.Результаты. Был создан алгоритм, предусматривающий три критерия, основанных на онкогенности, распространенности варианта в популяции и присутствия его в гене-ортологе. Отнесение варианта к нейтральным производилось при: а) несоответствии критерию онкогенности; б) соответствии хотя бы одному из двух оставшихся критериев. Все остальные варианты относились к патогенным. Разработанный алгоритм продемонстрировал высокую чувствительность (94,95% (88,61%, 98,34%)) и специфичность (96,52% (91,33%, 99,04%)) классификации доброкачественных и патогенных вариантов из проверочного датасета. Для работы алгоритма необходимо, чтобы позиция варианта была представлена в популяционных базах данных, а также соответствовала правильно выровненному участку множественного выравнивания ортологов вместе с двумя примыкающими позициями.Заключение. Разработанный алгоритм потенциально может быть применен для оценки вариантов в других онкогенах и антионкогенах, что может повысить точность классификации генетических вариантов и улучшить молекулярную диагностику.
Text of the scientific article An Algorithm for Assessing the Pathogenicity of Genetic Mutations in Tumor Based on a Retrospective Study of Pathogenic and Neutral Genetic Variants
Cancer poses a significant threat to society, public health, and the economy. It is responsible for approximately 16.8% of all deaths and 22.8% of deaths associated with non-communicable diseases worldwide [1]. Cancer cells accumulate numerous genetic alterations throughout their lifespan, but only a select few of these alterations contribute to cancer progression. Predictions of pathogenic mutations are essential as they lay the foundation for the subsequent identification of cancer-causing pathways and clinical applications [2]. After identifying the set of mutations in a patient's tumor, it is common to observe a small number of clinically significant events, as well as a larger number of genomic variations that have uncertain clinical significance. [3].
Breast cancer is one of the most common cancers, accounting for 21.2% of all malignant tumors in women. This highlights the importance of studying the BRCA1 and BRCA2 genes, which are associated with this type of cancer. The detection of mutations in these genes allows for the prescription of targeted therapy for patients. PIK3CA mutations have been found in certain types of malignant tumors. In particular, these mutations are associated with poor outcomes and chemoresistance in patients with advanced breast cancer that is hormone receptor positive and HER2 negative. Pathogenic variants in the DICER1 gene lead to the development of DICER1 syndrome and myelodysplastic syndrome.
Somatic mutations in the TP53 gene are common in malignant tumors and are associated with a poor prognosis [4]. They occur in about 5-10% of patients with myelodysplastic syndrome and acute myeloid leukemia, leading to a decrease in survival rates and response to chemotherapy [5].
There are a great number of computational methods for predicting the pathogenicity of missense variants. In 2015, the American College of Medical Genetics and Genomics (ACMG) proposed several criteria for assessing the pathogenicity of genetic variants [6]. One such criterion is in silico analysis, which has also been included in guidelines for the assessment of somatic variants developed by the Association for Molecular Pathology, the American Society of Clinical Oncology, and the College of American Pathologists in 2017 [7]. In 2022, Clinical Genome Resource, Cancer Genomics Consortium, and Variant Interpretation for Cancer Consortium have also recommended the use of this approach for somatic variant interpretation [8].
Despite the fact that predictive programs are recognized in international guidelines for the interpretation of sequence variants, their specificity and sensitivity levels are not high enough to be used in determining patient management strategies [9–11]. In this paper we have developed a prediction algorithm that is based on different variant characteristics, including evolutionary conservation.
The aim of the current study is to create a new algorithm for the classification of missense variants. Additionally, the sensitivity and specificity of the new algorithm as well as widely-used predictors should be assessed using the same set of known pathogenic mutations and benign polymorphisms.
Material and Methods
The algorithm was created using Python 3 and additional libraries for data obtaining and processing. The following variant characteristics were considered: the evolutionary conservation, minor allele frequency (population frequency), oncogenicity, constraint, and localization in a known hotspot.
Genetic variation dataset
We obtained 314 benign and 332 pathogenic missense variants of BRCA1 (protein sequence identifier NP_009231), BRCA2 (NP_000050), DICER1 (NP_001258211), TP53 (NP_000537), and PIK3CA (NP_006209) genes from the
ClinVar database to evaluate sensitivity and specificity of the new algorithm as well as other predictors using the ClinVar dataset of known pathogenic and benign missense variants (Table 1).
Table 1 . The distribution of pathogenic and benign variants from the ClinVar database
Таблица 1 . Распределение патогенных и доброкачественных вариантов базы данных ClinVar
|
Gene symbol |
Variant number |
|
|
Benign |
Pathogenic |
|
|
BRCA1 |
151 |
98 |
|
BRCA2 |
148 |
47 |
|
TP53 |
6 |
106 |
|
DICER1 |
7 |
34 |
|
PIK3CA |
2 |
47 |
|
Total |
314 |
332 |
The dataset was shuffled and split into a training and testing set in a 2:1 ratio. The training set was used to determine the population frequency threshold as well as for feature selection.
Oncogenicity
The oncogenicity of each variant was evaluated using the OncoKB database [12]. According to the documentation, variants are considered oncogenic if one of the following is true:
– experimental data from at least one study shows that the variant causes cancer (oncogenicity);
– the variant is located in a well-known area of the genome that is often associated with cancer development (a hotspot);
– the variant has been previously detected in a patient who responded to targeted therapy.
Variants that are likely to cause cancer (“Likely Oncogenic”) are those for which experimental data shows one of the following:
– the variant is linked to the development of a specific type of cancer or hereditary tumor syndrome;
– the variant is located in a hotspot;
– the presence of the variant leads to resistance to therapy, as indicated by clinical or laboratory studies.
Population frequency
Population frequency of each variant was assessed via the GnomAD database [13]. To determine the threshold value of the population frequency, we used ROC analysis with the calculation of the Youden index:
J=Sepop+Sppop–1, where Sepop and Sppop are the sensitivity and specificity of determining pathogenic mutations in a training dataset, respectively.
Evolutionary occurrence
Amino acid sequences were obtained from the NCBI Assembly and Uniprot Proteomes databases for evaluation of the evolution of studied genes. BUSCO scores were used to identify sequences from the most complete genomic (proteomic) datasets. We used the «cluster of orthologous group» method and the construction of phylogenetic trees in order to distinguish between orthologs and paralogs
-
[14] . BLAST+ was used to generate clusters of orthologous groups. The MAFFT program was used for multiple sequence alignment.
Sequences of BRCA2 and DICER1 orthologs were split by their domain limits according to the PROSITE database and realigned. During the analysis of the resulting multiple sequence alignments we evaluated two features for each variant:
– the occurrence of an alternative amino acid in at least one sequence of the alignment;
– the occurrence of another amino acid of the same biochemical group without changes of the neighboring residues in at least one sequence of the alignment.
Constraint
The constraint score is an observed to expected ratio of missense variants in a gene. Higher score indicates that the transcript is more intolerant of variation. The constraint scores for each gene were obtained via the GnomAD database. The constraint variable was set to the score value.
Hotspot
To assess the localization of the variant at a mutational hotspot, we used the “Cancer Hotspots” database, which was compiled as a result of a study of 24,592 tumors. The data was obtained from publicly available sources, such as The Cancer Genome Atlas and The International Cancer Genome Consortium, as well as from independently published data. The hotspot variable was set to “1” if a variant was located in a mutational hotspot, and “0” if it was not.
Feature selection
Feature selection was performed by selecting two variables with the highest Chi-square statistics:
where r and c represent the numbers of rows and columns in a contingency table, respectively; Eij and Oij are the numbers of expected and observed values in a cell located in row i and column j.
Prediction programs
Along with our algorithm, the following pathogenicity predictors were tested: PolyPhen2 (both HumDiv and HumVar variants), SIFT, LRT, MutationTaster, MutationAssessor, FATHMM, FATHMM-MKL, PROVEAN, MetaSVM, MetaLR, M-CAP, EVE, and AlphaMissense.
Evaluation and cross-validation of the algorithm
For the evaluation of the algorithm, sensitivity, specificity and accuracy were calculated. The Clopper-Pearson formula was used to determine 95% confidence intervals.
Three-fold cross-validation was used to evaluate the reproducibility of the algorithm's performance. The dataset was divided into three equal groups, and in each step of the cross-validation process two groups were combined and used for training while the remaining group was used for testing. Additionally, an odds ratio natural logarithm and its 95% confidence interval were calculated:
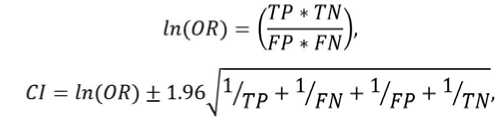
where OR is the odds ratio, and CI is the upper bound of the 95% confidence interval when the "+"-sign is used in the formula, or the lower bound if the "-"-sign is used.
Results
Oncogenicity criterion
There are a variety of databases for interpreting the clinical significance of genetic variants that collect evidence about the pathogenicity of a particular mutation. One of these databases is OncoKB. Its key features are its open access policy, assessment of therapeutic significance, and its focus on oncology.
We introduced an obligatory rule to consider all mutations found in OncoKB with the label “Oncogenic” as those that disrupt the gene's function. These included either variants recognized as causing cancer based on the results of experimental studies, or located in a known hotspot of the gene, or previously detected in a patient who responded to targeted therapy with respect to the mutated gene.
In total, two variables described the oncogenicity of a variant for sets of “Oncogenic” and “Likely oncogenic” mutations. A variable is set to “1” if a particular variant is present in the mutational set and to “0 if it is not.
Population frequency criterion
The frequency of variants in the population is currently used to determine their clinical effect. This approach helps to distinguish between rare mutations that cause genetic diseases and common, harmless genetic variations found in the genomes of healthy individuals [15]. To determine the population frequency threshold, we used variants from the training dataset.
To find the optimal threshold for the population frequency, we used ROC analysis. The classifier categorized all variants with a frequency above the threshold as neutral, while those below were classified as pathogenic. For each point on the ROC curve, we calculated the Youden’s index. The threshold for the population frequency was determined by finding the point on the curve that corresponded to the highest Youden’s index among all calculated values. This threshold was found to be 0.00071% (Figure 1).
It's important to note that most variants with frequencies above the threshold are known to be oncogenic mutations. Therefore, the population frequency criterion is insufficient and we need to consider other criteria when classifying their pathogenicity.
The population frequency variable was set to “1” if a particular variant has a minor allele frequency exceeding the threshold, and to “0” in other cases.
Evolutionary occurrence criterion
The database for studying evolution was created using 191 the most complete genomes and proteomes of NCBI Assemblies and UniProt Proteomes based on the BUSCO score. In total, there were more than 4 million annotated sequences in our new database, which can be used to build multiple sequence alignments of orthologous sequences
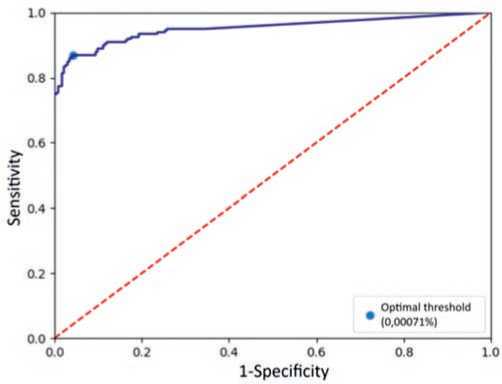
Fig. 1. ROC curve of a classifier based on population frequency of variants Рис. 1. ROC-кривая классификатора на основе популяционной частоты вариантов for each annotated gene. The code used for phylogenetic analysis can be found in the repository at https://gitverse. ru/d_bug/ortologi.
The presence of the same or a similar substitution in the sequence of at least one orthologous protein was identified as an occurrence of:
– the alternative amino acid;
– any amino acid from the biochemical group of the alternative residue (the classification of amino acids into biochemical groups used in the algorithm is illustrated in Figure 2);
– any amino acid not belonging to the biochemical group of the reference residue;
– any amino acid but the reference.
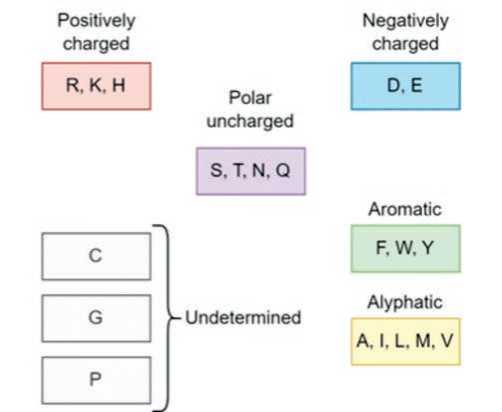
Fig. 2. Classification of biochemical amino acid groups used for the algorithm
Рис. 2. Классификация биохимических групп аминокислот, использованная в алгоритме
We created additional criteria for each of these categories, which represented matching neighboring amino acids between the human sequence and the ortholog in question.
In total, there were eight variables for describing the evolutionary conservation of a variant position: each variable is set to "1" if certain criteria are met and "0" otherwise.
Feature selection
Two variables with the highest Chi-square statistics were identified: the population frequency and the evolutionary occurrence. The latter was most significant when the amino acids from the biochemical group of an alternative residue were present in a variant position with matching amino acids from human protein in neighboring positions, or when the alternative amino acid was present with or without matching neighboring residues.
Algorithm formalization and requirements
Finally, we have developed a new algorithm which is based on three criteria:
– The oncogenicity criterion for classifying variants is whether they are listed among known oncogenic mutations in the OncoKB database.
– The population frequency criterion is met if the variant in question is present in the human population with an allele frequency exceeding the threshold value of 0.00071% which was determined with ROC-analysis.
– The evolutionary occurrence criterion is based on the similarity of a mutated human gene sequence to the sequence of one or several of the orthologous genes. Orthologous genes are defined based on the phylogenetic tree topology and the graph structure built on the basis of the «cluster of orthologous group» method. This criterion is satisfied when there is a presence of the exact same variant in at least one orthologous sequence or when there is a presence of an amino acid from the same biochemical class with simultaneous match of the neighboring amino acids in an orthologous sequence.
If a variant fails to meet the criteria for oncogenicity and at most one other criterion, it is classified as a neutral variant by the algorithm. In all other cases, it is classified as pathogenic. The algorithm scheme is outlined in Figure 3.
The algorithm requires the variant position to be represented in population databases. Therefore, it cannot be located in problematic genomic regions, such as low-mappability islands or repetitive regions.
The position of interest must also correspond to an aligned region in multiple sequence alignments of orthologous proteins. Since evolutionary criteria require the assessment of adjacent positions, these positions should also be well-aligned.
Algorithm evaluation
Following the previous studies on the evaluation of prediction programs, we measured the sensitivity and specificity of our new algorithm as well as other widely used predictors by using a dataset of known benign and pathogenic variants from the ClinVar database [16, 17]. The new algorithm demonstrated high sensitivity (94.95%) and specificity (96.52%) of predicting the pathogenicity of variants from the dataset (Figure 4, Table 2).
Cross-validation
For each of the cross-sectional groups, the threshold population frequency was recalculated, distinguishing between pathogenic and neutral genetic variants. The values obtained were 0.00071%, 0.00074%, and 0.00077%.
In all three cases the population frequency and evolutionary occurrence were the most valuable features. The latter was set to "1" in case of an alternative amino acid, regardless of the neighboring residues, or in case of
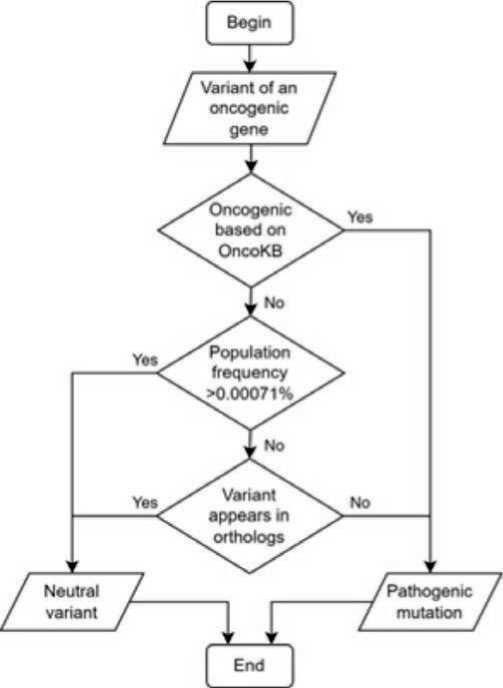
Fig. 3. Scheme of the proposed algorithm
Рис. 3. Схема предлагаемого алгоритма
amino acid belonging to the same biochemical group as the alternative residue, with mandatory matching of neighboring amino acids between the human protein sequence and its ortholog.
The sensitivity, specificity, and accuracy of detecting pathogenic mutations, as well as area under the ROC curve and odds ratio for the cross-sectional groups are presented in the Table 3.
There were no statistically significant differences in the area under the ROC curve in between each pair of different steps (p > 0.05). The 95% confidence intervals for the odds ratios of each subgroup contained the odds ratio values of the two remaining subgroups.
The variant dataset, as well as the implementation of the algorithm in the Python programming language is available at pathogenicity_assessment.
Discussion
Hereby, we present the new algorithm for assessing the pathogenicity of missense variants of BRCA1, BRCA2, DICER1, PIK3CA , and TP53 genes. Its main advantages are high specificity and sensitivity which were achieved by thorough revision of the existing predictors’ algorithms.
First, there is no generally accepted set of the most complete proteomes or genomes that would be used universally for evolution study, just as there is no algorithm to obtain such a set. The problem of standardizing a dataset selection for evolutionary study is not resolved yet. In this study, rather than selecting sequences randomly, we used BUSCO scores to obtain the most complete proteome sequence datasets, which minimizes the possibility of missing any orthologous genes. The instructions for assembling a custom database based on the BUSCO scores are outlined in the project repository:
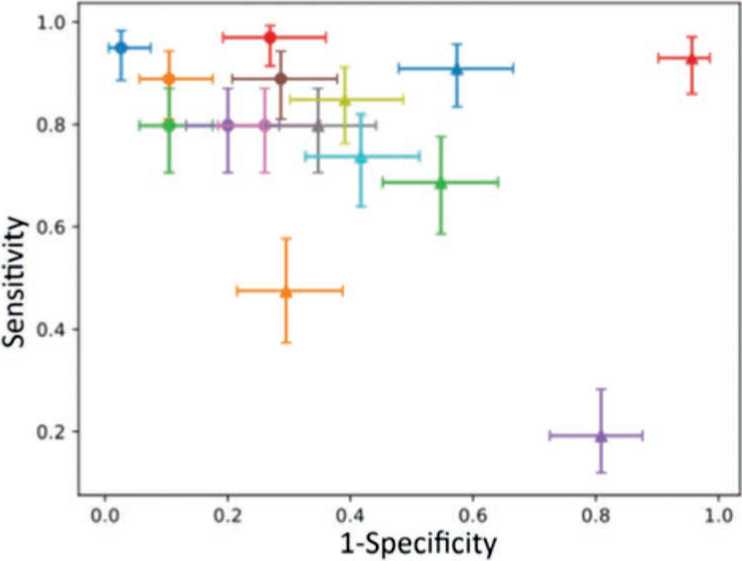
Fig. 4. Sensitivity and specificity of variant classification based on pathogenicity assessment
Рис. 4. Чувствительность и специфичность классификации вариантов на основе оценки патогенности
-
• Proposed algorithm
-
• LRT
-
• AlphaMissense
-
• FATHM-MKL
-
• MetaSVM
-
• MutationTaster
-
• Polyphen2 (HVAR)
A MetaLR
-
▲ PolyPhen2 (HDIV)
A FATHMM
A SIH
A PROVEAN
A EVE
A M-CAP
A MutationAssessor
Table 2 . Sensitivity, specificity, and accuracy of the tested algorithms
Таблица 2 . Чувствительность, специфичность и точность исследованных алгоритмов
|
Name |
Se (CIl, CIh), % |
Sp (CIl, CIh), % |
Acc (CIl, CIh), % |
|
Proposed algorithm |
94.95 (88.61, 98.34) |
96.52 (91.33, 99.04) |
95.79 (92.17, 98.06) |
|
AlphaMissense |
88.89 (80.99, 94.32) |
89.57 (82.48, 94.49) |
89.25 (84.31, 93.06) |
|
LRT |
79.80 (70.54, 87.20) |
89.57 (82.48, 94.49) |
85.05 (79.55, 89.54) |
|
FATHMM-MKL |
96.97 (91.40, 99.37) |
73.04 (63.97, 80.89) |
84.11 (78.51, 88.74) |
|
MetaSVM |
79.80 (70.54, 87.20) |
80.00 (71.52, 86.88) |
79.91 (73.90, 85.06) |
|
MutationTaster |
88.89 (80.99, 94.32) |
71.30 (62.12, 79.35) |
79.44 (73.40, 84.65) |
|
MetaLR |
79.80 (70.54, 87.20) |
73.91 (64.90, 81.66) |
76.64 (70.38, 82.13) |
|
Polyphen2 (HVAR) |
79.80 (70.54, 87.20) |
65.22 (55.77, 73.86) |
71.96 (65.43, 77.87) |
|
Polyphen2 (HDIV) |
84.85 (76.24, 91.26) |
60.87 (51.33, 69.84) |
71.96 (65.43, 77.87) |
|
SIFT |
73.74 (63.93, 82.07) |
58.26 (48.70, 67.39) |
65.42 (58.63, 71.77) |
|
FATHMM |
90.91 (83.44, 95.76) |
42.61 (33.44, 52.17) |
64.95 (58.15, 71.33) |
|
PROVEAN |
47.47 (37.34, 57.76) |
70.43 (61.21, 78.58) |
59.81 (52.91, 66.44) |
|
EVE |
68.69 (58.59, 77.64) |
45.22 (35.92, 54.77) |
56.07 (49.15, 62.83) |
|
M-CAP |
92.93 (85.97, 97.11) |
4.35 (1.43, 9.85) |
45.33 (38.53, 52.26) |
|
MutationAssessor |
19.19 (11.97, 28.34) |
19.13 (12.39, 27.52) |
19.16 (14.11, 25.08) |
Note: Se – sensitivity, Sp – specificity, Acc – accuracy, CIl – lower bound of the 95% confidence interval, CIh – the higher bound of the 95% confidence interval.
Table 3 . Sensitivity, specificity, accuracy, area under the ROC curve, and odds ratio logarithm of each cross-validation step
Таблица 3 . Чувствительность, специфичность, точность, площадь под ROC-кривой и логарифм отношения шансов каждой из перекрестных групп
|
Measure |
Step 1 |
Step 2 |
Step 3 |
|
Se (CIl, CIh), % |
92.79 (86.29, 96.84) |
94.44 (88.30, 97.93) |
94.69 (88.80, 98.03) |
|
Sp (CIl, CIh), % |
98.10 (93.29, 99.77) |
96.26 (90.70, 98.97) |
95.10 (88.93, 98.39) |
|
Acc (CIl, CIh), % |
95.37 (91.65, 97.76) |
95.35 (91.61, 97.75) |
94.88 (91.03, 97.42) |
|
AUROC (CIl, CIh) |
0.954 (0.927, 0.982) |
0.954 (0.925, 0.982) |
0.949 (0.919, 0.979) |
|
ln(OR) (CIl, CIh) |
6.40 (4.92, 8.07) |
5.99 (4.79, 7.38) |
5.76 (4.63, 7.06) |
Note: Se – sensitivity, Sp – specificity, Acc – accuracy, AUROC – area under the ROC curve, ln(OR) – odds ratio natural logarithm, CIl – lower bound of the 95% confidence interval, CIh – the higher bound of the 95% confidence interval.
Second, even the modern predictors don’t classify homologous sequences into orthologs and paralogs, which can lead to prediction errors [18]. In this algorithm, both the «cluster of orthologous group» method and the construction of phylogenetic trees were used to take only orthologous sequences into the analysis. To implement this method, we created our own tool, available at the project repository:
Third, predictors use full protein sequences for alignment, which can cause misalignment in case of multidomain proteins. As structural and functional compartments of a protein, domains of a single protein may have slightly different evolutionary history [19]. For the new algorithm, we have aligned the fragments of multidomain proteins to observe evolutionary history of each individual domain.
Using this approach, we have managed to get correct pathogenicity predictions for three known DICER1 mutations: p.E1705K, p.E1913K, and p.D1822V. In the original multiple sequence alignment, there were E, K, and N residues at the 1705th position, E, K, L, and V at the 1814th position, D, V, C, K, and Y at the 1822nd position. After the realignment of DICER1 amino acid subsequences there were exclusively E, E, and D at the 1705th, 1813th, and 1822nd positions, respectively, which reflects complete conservation and immutability of these amino acids.
Fourth, the majority of predictors do not use population and cancer databases for decision-making. We obtained data from GnomAD and OncoKB and designed the criteria for them to use in classifying pathogenic and neutral variants. This introduces an “unfair advantage” of our algorithm, as it uses the OncoKB database, which might contain mutations already listed in ClinVar as pathogenic variants. However, after removing variants from the OncoKB database from the dataset, the updated sensitivity (94.12%, (86.80%, 98.06%)), specificity (96.52% (91.33%, 99.04%)), and accuracy (95.50% (91.63%, 97.92%)) values did not change significantly.
Finally, a significant problem of a great number of variant pathogenicity prediction programs is the use of machine learning algorithms for interpreting the results. While the utilization of these algorithms can lead to an improvement in sensitivity and specificity, it may incorporate an uninterpretative part into the prediction algorithm, which cannot be explained in biological or medical context. This fact is widely known and addressed as the “black box problem” – the difficulty of deciphering the reasoning behind an artificial intelligence system’s predictions or decisions [20].
The main drawback of the algorithm is that it focuses on cancer-related genes and cannot be used for variant prediction unrelated to cancer. The positions of the variants of interest should also be sufficiently represented by population databases, as well as in the multiple alignment of orthologous sequences. However, fine-tuning of the population allele frequency limit as well as the rules for meeting the evolutionary criterion might help optimize the algorithm for usage in case of other genetic diseases.
It's important to note that the results of the algorithm need to be updated regularly to keep up with the growing amount of data on variant populations, oncogenicity, and evolution.
Conclusion
We have developed a highly specialized algorithm that can classify missense mutations based on their oncogenic potential, population frequency, and evolutionary context. This algorithm can be useful in complex diagnostic scenarios involving cancer, where it is impossible to determine the pathogenicity of a mutation using other methods.
