An extensive study of similarity and dissimilarity measures used for text document clustering using k-means algorithm

Author: Maedeh Afzali, Suresh Kumar
Journal: International Journal of Information Technology and Computer Science @ijitcs
Article in issue: 9 Vol. 10, 2018.
Free access
In today’s world tremendous amount of unstructured data, especially text, is being generated through various sources. This massive amount of data has lead the researchers to focus on employing data mining techniques to analyse and cluster them for an efficient browsing and searching mechanisms. The clustering methods like k-means algorithm perform through measuring the relationship between the data objects. Accurate clustering is based on the similarity or dissimilarity measure that is defined to evaluate the homogeneity of the documents. A variety of measures have been proposed up to this date. However, all of them are not suitable to be used in the k-means algorithm. In this paper, an extensive study is done to compare and analyse the performance of eight well-known similarity and dissimilarity measures that are applicable to the k-means clustering approach. For experiment purpose, four text document data sets are used and the results are reported.
Text Document Clustering, Similarity Measures, Dissimilarity Measures, Distance Measures, K-means Algorithm
Short address: https://sciup.org/15016299
IDR: 15016299 | DOI: 10.5815/ijitcs.2018.09.08
Text of the scientific article An extensive study of similarity and dissimilarity measures used for text document clustering using k-means algorithm
Published Online September 2018 in MECS DOI: 10.5815/ijitcs.2018.09.08
In today’s era , the majority of produced data through various digital resources are in unstructured form, mainly text. Seth Grimes, a leading industry analyst, having specialization in data analysis technologies, published an article that claims, approximately 80% of the data that is produced in organizations are in the text format [1]. Consequently, analyzing and organizing this very large amount of unstructured data in an effective and efficient way demands hardship, which sometimes might be frustrating [2].
Clustering is one of the most significant and useful methods of data mining. In this method, the input objects are grouped into a smaller number of meaningful and coherent subgroups based on specified features. The text document clustering is an effective way to improve the performance of web search, search engines, and browsing techniques [3, 4]. It organizes the collection of text documents into coherent groups, in such a way that the documents in each group are much the same to each other and very different to the documents in other groups. K-means algorithm is a popular clustering algorithm and one of the top ten data mining algorithms [5, 6]. It is a partitioning method algorithm that divides the set of target objects into k number of clusters based on the similarity or dissimilarity (distance) that is considered. Basically, the similarity measure is a function that is used to estimate the degree of similarity between the pair of objects and dissimilarity or distance is a numeric value that finds out how much the objects are far apart from each other. In clustering the collection of text documents they assist us to evaluate the homogeneity of the documents in order to achieve clusters with a high intracluster and low inter-cluster [7]. There are a variety of distance and similarity measures proposed in the literature. However, all the similarity and dissimilarity are not suitable to be used in the k-means algorithm. A survey is required to understand the effectiveness of these measures and select the appropriate ones that provide more coherent and accurate clusters.
The purpose of this paper is to provide a comparative analysis of most popular similarity and dissimilarity (distance) measures that are suitable for clustering the text documents by using the k-means algorithm. To begin with, the documents in the corpus are pre-processed and represented in the document term matrix form. Further, a TF-IDF weighting scheme is used to indicate the importance of words in documents. In addition, the k-means clustering algorithm is deployed, by utilizing a variety of distance and similarity measures. At the final stage, four data sets known as BBCSport, BBC, Classic and WebKB are used for experiment and the achieved results are evaluated using evaluation measures such as purity and entropy.
The basic outline of this paper is as follows. In the next section, some related works are presented. In section 3, steps that are followed in the methodology are described. Section 4 discusses the document preparation steps which is divided into three subsections of preprocessing, document representation and term weighting. In addition, in section 5, the k-means clustering algorithm is explained in detail. Eight well-known similarity and dissimilarity (distance) measures that are suitable for the k-means algorithm is reviewed in section 6. The data sets and experiments are determined in section 7 and 8. Finally, conclusions and potential future work are given in section 9.
-
II. Related Works
Up to this date, several attempts has been done by researchers to find out the most effective similarity or dissimilarity measure for clustering the text documents through using the k-means algorithm.
Huang [7] compared and analyzed the effectiveness of similarity measures such as Euclidean distance, Cosine similarity, Jaccard coefficient, Pearson correlation coefficient and Averaged Kullback-Leibler Divergence for text documents clustering. They have selected the standard k-means as clustering algorithm in order to group similar documents to form coherent clusters. For an experiment, they have used seven data sets with different characteristics. The results obtained from the experiment showed that the Euclidean distance performed worst, while the performances of the other four measures were quite similar.
Singh P. [8], experimented five well-known similarity and distance measures as such, Euclidean, Cosine, Mahalanobis, Jaccard and Pearson. They have compared the performance of these similarity measures using standard k-means algorithm. They believed that representation of objects, similarity measures and the clustering algorithm itself are the components that are influential in the final results of clustering.
Steinbach et al. [9], compared two main approaches for clustering the documents, agglomerative hierarchical algorithm and k-means (standard k-means and bisecting k-means). To evaluate the quality of clusters the entropy, F-measure and UPGMA are used. The result of investigation showed that the bisecting k-means technique produce significantly better results as compared to hierarchical approaches. Moreover, they claim that the results of clustering is highly dependent on the nature of documents.
Garga and Guptab [10] studied various partitioning and hierarchical clustering algorithms used in text mining alongside their metrics and demerits in detail. Moreover, they have discussed the ideas of proficiently using the algorithms for effective clustering of text documents.
-
III. Methodology
The different steps followed in the methodology are as follow,
-
1. The initial step is to choose a document data set or a corpus of text documents to perform the analysis.
-
2. A preprocessing of the documents is required to perform certain transformation that prepare them for analysis.
-
3. Representing the documents in a document term matrix and considering each document as a vector of its terms based on the TF-IDF weighting method.
-
4. Apply different similarity and dissimilarity (distance) measures to evaluate the similarity of every pair of documents.
-
5. Apply k-means over the collection of documents.
-
6. Generating the clusters of documents.
-
7. Evaluate the achieved results.
The overview of the process is shown in Fig. 1.
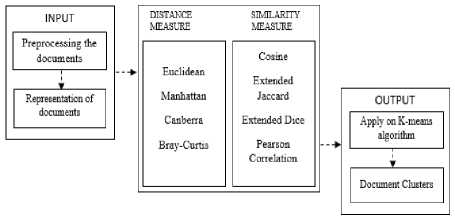
Fig.1. Flow Chart of the Methodology
-
IV. Document Prepration
In this section, in order to reduce the complexity of the text documents and make the process of analyzing and organizing convenient some transformations are performed on the text documents.
-
A. Preprocessing
Preprocessing is the first step that is taken in the process of clustering the text documents. Basically, it cleans and prepares the data. As the text documents may contain lots of noise and unwanted data, therefore, it is required to perform some basic and standard transformation upon them, in order to prepare them for further analysis [11]. The process involves the following steps,
-
1. Characters which are in upper case are converted to lower case.
-
2. Numbers and Punctuations are removed.
-
3. Stop words, such as a , and , are , do are removed as they appear commonly in the documents and don’t carry any valuable information.
-
4. Particular symbols such as /, |, @, // are converted to spaces.
-
5. Extra whitespaces are stripped.
-
6. To stem the words, Porter’s suffix-stripping algorithm is used [12]. The reason behind stemming is to map the words with different endings into a unique form, so it is helpful in reducing the total number of distinct terms in documents which is beneficial in reducing the processing time. For instance, the words such as dependent, dependency are reduced to its common base form, depend.
-
B. Document Representation
The keystone in clustering the text documents is representation of documents into a well-defined structure. The machine learning algorithms doesn’t have the capability to work directly with raw text, so the text should be converted into vector of numbers [13]. A popular and mostly used method for representing the documents into unique form is bag of words model, where the words are counted in a bag regardless of their order and position in the text [14]. In this experiment, n numbers of documents with m unique words are converted to an n × m matrix which is called document term matrix. In DTM, documents are represented in rows and distinct words are represented in columns. Each entry of the matrix is the frequency of words occurring in a particular document [7]. Assume D = {d1, d2 , ……, dn} is a data set that has n number of documents and T = {t1, t2 ,….., tm } is a set of m distinct terms, which occur in dataset D . The overall representation of DTM matrix is demonstrated in Table 1.
Table 1. Document Term Matrix
|
t 1 |
t 2 … |
||
|
d 1 |
tf(t 1 , d 1 ) |
tf(t 2 , d 1 ) |
tf(t m , d 1 ) |
|
d 2 |
tf(t 1 , d 2 ) |
tf(t 2 , d 2 ) |
tf(t m , d 2 ) |
|
d n |
tf(t 1 , d n ) |
tf(t 2 , d n ) |
tf(t m , d n ) |
The tf(dn, tm) denotes the frequency of term tm E T in document dn e D. Based on this representation the documents can be represented thruogh the Vector Space Model as well. In this model each docuemts is veiwed as a vector in a vector space [15]. Every document is refred by their term vector. For instance term vector of document d1 and d2 is illustrated as follows, d1 = tf(t1,d1),tf(t2,d1),...,tf(tm,d1) (1)
d 2 = tf(t1,d 2 ),tf(t2,d 2 ),...,tf(tm,d 2 ) (2)
This vector representation is shown in Fig. 2.
Furthermore, the term vectors are used to find out how much the documents are similar or dissimilar. There are several similarity and dissimilarity (distance) measures available. They measure the similarity in various ways like considering the absence and presence of the terms, evaluating the angle between two document vectors or by calculating the distance. However, in section 6 mostly used similarity and dissimilarity measures that are applicable to the k-means algorithm are explained in detail.
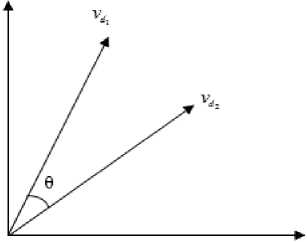
Fig.2. Representation of documents d 1 and d 2 on vector space
-
C. Term Weighting
The most general and basic approach of weighting the terms in the documents clustering is term frequency (tf). It simply counts the occurrence of each word in a document [16, 17]. Another mostly used and reliable way to weight the terms is the term frequency and inverse document method. This approach indicates the importance of every word in the documents based on the fact that the words that appear frequent in small number of documents but rare in others are more relevant. The formula for this weighting schema is defined as,
D inverse document frequency = log( )
df(t)
Where |D| is the number of documents in dataset and df(t) is the number of documents that term t appears in it. Further, the tfidf is computed as follow, tfidf = normalized term frequency(tf) x inverse document frequency (idf)
It is simply the multiplication of normalized term frequency (tf) into inverse document frequency (idf). The reason behind the normalizing the term frequency is that in the collection of the documents, there may be documents that are longer than other ones that causes bias. To eliminate it, the term frequency is normalized, through dividing term frequency of every term by the sum of term frequency of all the terms appearing in document [18]. The formula for normalized term frequency is defined as, normalized term frequency (tf) = tf(tj, di)
Z tf(tj , di )
k
Moreover, in the large datasets that are taken for the experiment, the document term matrix that is created is a sparse matrix and contain some infrequent words which might have unfavorable effective on the final result of the process of clustering, therefore the words which are less than a given threshold have been discarded.
-
V. Clustering Algorithm
Clustering is a widely used technique in data mining. The aim of clustering is to organize the input objects into distinct groups. The objects in one group are similar to each other as much as possible and dissimilar to objects in other group [19] [20]. In this experiment, the standard k-mean algorithm is used. K-means algorithm is a partitioning algorithm, that n objects in the given dataset are partitioned into k distinct groups [21]. It is significant to consider that each object can be the member of only one group. K-means algorithm has an iterative performance. Consider, a dataset of n objects need to be partitioned into k number of pre-specified clusters. Firstly, k numbers of objects are randomly selected as initial cluster centers. Then, based on the minimum distance of other objects to initial cluster centers, the remaining objects are assigned to its corresponding cluster. Next, the new centroids are recomputed and based on the new centroids the objects are reassigned. The iteration is continued until there is no change in the clusters [22] [23].
In this experiment, documents are the input data set. To begin with, k number of documents are selected randomly as initial centroids. Then based on the similarity or dissimilarity (distance) measure that is selected, other documents are assigned to its corresponding cluster based on the minimum value of distance or similarity measure. To calculate the new cluster centers, the mean of each dimension over all the documents in the cluster is calculated. Assuming C to be a set of documents. Its centroid is defined as,
→→ t = 1 t (6)
cC →∑ d t∈c d which is the mean value of all term vectors in the set [7]. The documents are reassigned based on the new centroids. The iteration is pursued until there is no change in the clusters of documents.
-
VI. Similarity and Dissimilarity
Organizing the text documents into sensible groupings is beneficial in many applications. The result of a clustering algorithm is highly dependent on the selection of appropriate similarity and dissimilarity measure. Ideally, they are useful in determining the closeness or separation of documents. There are a various similarity and dissimilarity measures that have been proposed. The evaluation of these measures that are applicable on clustering the text documents are regarded as a subject of research that is recommended in various domains. In this section, eight popular similarity and dissimilarity (distance) that are used in clustering the text documents using the k-mean algorithm are explained in detail.
-
A. Dissimilarity (Distance) Measures
As discussed earlier, dissimilarity (distance) measures are used to determine that how much the two documents are alike. Their prominent attribute is that they range from 0 to ∞. The zero indicates the two documents are similar and the ∞ indicates a low degree of similarity which means that the two documents are different [24, 25]. In this section four well known distance measures such as Manhattan, Euclidean, Bray-Curtis and Canberra are discussed.
Manhattan dissimilarity [26] measure evaluates the distance between two points in a grid, based on the number of horizontal and vertical steps that have to be taken to go from one point to other. It is simply calculated by taking the sum of the absolute values of the differences of the elements in two vectors [27]. Consider two documents d 1 and d 2 are represented based on their term vector d = ( t1d1,t2d 1 ,...,tmd 1 ) and d= ( t1d 2, t2d 2 ,...,tmd 2 ) . Manhattan distance of d 1 and d 2 is as follows,
m manhattan distance (d ,d ) = ∑Itd -td I (7) i=1
Euclidean distance is the most widely used dissimilarity measure in clustering. It computes the distance among two vectors, by calculating the square root of the sum of squared differences between corresponding elements of two vectors [7]. The Euclidean distance of two documents d1 and d2 is defined as,
m
Euclidean distance (d ,d ) = ∑ (t i d 1 -t i d 2 ) 2 (8)
i=1
Bray-Curtis distance measure was developed in 1957 by J. Roger Bray and John T. Curtis. It is a popular dissimilarity measure mostly used in ecology [28]. The general formula for calculating the Bray-Curtis dissimilarity between two documents d 1 and d 2 is expressed as,
m
∑ I tid 1 -tid 2 I
Braycurtis distance (x, y) = i=1 (9)
∑ I tid 1 +tid 2 I i=1
The Canberra distance is quite similar to Manhattan distance [29]. It is calculated through dividing the absolute difference between variables of two points by the sum of the absolute variables of two points. The generalized equation to calculate Canberra distance between two documents d 1 and d 2 is provided as,
Canberra distance (x, y) =
m td -td
T l^d |+ | td2|
For a better understanding, let d1={2,5,3,0} and d2={3,5,4,1} be two documents with m=4 number of attributes. The table 2 shows the results of every dissimilarity measure between the two documents.
Table 2. Distance Measures for Document d 1 and d 2
|
Distance Measure |
Calculation |
|
Manhattan |
1 2-3| + |5-5| + |3-V| + ^-7 | = 3 |
|
Euclidean |
4(2 - 3) + (5 - 5)2 + (3 - 4) + (0 -1) = 1.73 |
|
Bray-Curtis |
2-3+5-5+3-4+0-1 1 2 + 3| + |5+5|+|3+4| + 0+1| |
|
Canberra |
223 + 525 + 324 + 021 = 134 2 + 3 5 + 5 3 + 4 0 + 1 " |
-
B. Similarity Measures
Similarity measure is a function that helps us to quantify the degree of similarity between the documents in order to discover the closest ones [30]. In other words it evaluates that how much the documents are related to each other. The general property of all the similarity measures is that they map to the range of [-1, 1] or [0, 1]. The 0 or -1 represents minimal similarity and 1 represents absolute similarity. In order to use the similarity measures in clustering by employing the k-means algorithm they have to be converted to a dissimilarity measure, therefore this is done through subtracting by one.
dissimilairty = 1 - similarity (11)
Cosine similarity, Jaccard coefficient, Dice coefficient and Pearson correlation are the most popular similarity measures used in clustering algorithms.
Cosine similarity is an angle based measurement, used to quantify the cosine of the angle between two vectors and to find out how related they are to each other [3]. The cosine similarity of documents d1 and d2 is computed with following formula, cosine similarity (d ,d ) = 1 . 2
m d/- d2 = 1 td x td i=1
m
II d J1 = J1( td i )2
V i =1
m
II d 2 11 = JK td 2 )2
V i =1
The cosine value is bounded between [0, 1]. If documents are similar, their vectors will be in the same direction from origin, thus, they form a relatively small angle, which its cosine value will be near to one. On the other hand, when two vectors are in different direction from the origin, they form a wide angle and the value of the cosine is near to zero, consequently, the documents are dissimilar, and they map no similarity. In k-means algorithm the dissimilarity is considered, therefore cosinedissimilarity(d 1 , d 2 ) = 1- cosinesimlarity(d 1 , d 2 ) .
Jaccard coefficient or Tanimoto coefficient evaluates the similarity of two documents based upon the presence or absence of terms in documents [7].
, I d n d2|
Jaccard similarity (d ,d ) = (16) 12 d и d 2|
Ideally, it is applied on binary vectors through dividing the total number of common terms between two documents by the entire number of terms that exists in at least one of the two documents. The generalized formula is written as,
ExtendedJaccard similarity (d ,d ) = d1. d2 (17) d12+ d2 2-(d1.d2)
In addition, the value of extended Jaccard similarity is always between 0 and 1. When it is 1, two documents are identical, conversely when it is 0 means that two documents are completely dissimilar. By considering the inverse of Jaccard coefficient, ExtendedJaccarddissimilairty = 1-ExtendedJaccardSimilarity , it can modify to a coefficient of dissimilarity.
As similar to Jaccard coefficient the Dice coefficient is also based on the absence and presence of the words in documents [7]. The distinction is multiplying two into the number of common terms in the compared documents divided by the total number of terms in both documents. The formula is,
. I d , n d2|
Dice similarity (dv , d2) = 2 x у—:—:—- (18)
-
12 d 1 + d 2
In applying Dice coefficient in K-means clustering algorithm the extended Dice coefficient is used. Considering the two documents d1 and d2 the extended Dice coefficient is represented as,
Extendeddice similarity (dx , d2) = ^ X 1х - ^22 (19)
d 1 + d 2
ExtendedDicedissimilarity = 1- ExtendedDicesimilarity , modifies the Extended Dice coefficient to a dissimilarity measure.
Pearson’s correlation is used to find the relationship between two variables [4]. There are different forms of Pearson’s correlation. The commonly used formula is defined as,
Pearson correlation (x, y) = n X d1 d 2 - X d1X d 2
Jn X ( d 1 ) 2 -( X d 1 ) x 4n X ( d 2 ) 2 -( X d 2 ) 2
Pearson’s correlation has a value between [-1, +1]. In order to use the Pearson’s correlation in K-means algorithm if PearsonCorrelation > 0 then dissimilarity is Pearsondissimilairty = 1- PearsonCorrelation and if PearsonCorrelation ≤ 0 then it’s Pearsondissimilarity = |PearsonCorrealtion |.
As an instance, let d1={2,5,3,0} and d2={3,5,4,1} be two documents with m=4 number of attributes. The table 3 demonstrates the results of different similarity measure between the two documents.
Table 3. Similarity Measures for Document d 1 and d 2
|
Similarity Measure |
Calculation |
|
Cosine |
(2? 3) + (5? 5) + (3 x 4) + (0 x 1) = 0 97 V 2 2 +5 2 +3 2 +02 X 332 + 52 4 42 +l2 |
|
Extended Jaccard |
(2 x 3)+(5 x 5)+(3 x 4) + (0 x 1) (2 2 +5 2 +3 2 +0 ) + (3 +5 2 +4 +1 )-((2 x 3)+(5 x 5)+(3 x 4) + (0 x 1)) = 0.93 |
|
Extended Dice |
2 x [ (2 X 3) + (5 X 5) + (3 X 4) + (0 X1) ] —555555= 0.96 (22+52+32+02)+(32+52+42+12) |
|
Pearson |
(4 x ( 2 x 3 + 5 x 5 + 3 X 4 + 0 ' 1))-((10) x (13)) =(т 4 x [ (4 x 38) ] - (10)2 x 4 X x [ 4 x 51 ] - (13)2 |
Table 5. Distribution of Documents per Class in BBCSport Data Set
|
Dataset |
No. of Documents |
|
athletics |
101 |
|
cricket |
124 |
|
football |
265 |
|
Rugby |
147 |
|
Tennis |
100 |
|
Total |
737 |
As shown in Table 6, BBC data set consist of 2225 documents collected from BBC news website, which is about stories from five topics such as business, entertainment, politics, sport and technology [31].
Table 6. Distribution of Documents per Class in BBC Data Set
|
Dataset |
No. of Documents |
|
business |
510 |
|
entertainment |
386 |
|
politics |
417 |
|
sport |
511 |
|
Tech |
401 |
|
Total |
2225 |
Classic data set is a popular data set used in text mining. It contains of 7095 abstracts of scientific papers. The data set consist of four collections named as CACM, CISI, CRAN and MED. The data set can be obtained from [32]. For classic data set after the whole data is preprocessed the obtained document term matrix was huge consisting of 7095 rows and 18678 columns. To make the data set smaller in order to analysis it easier, 2000 of the most frequent words are selected.
-
VII. Data Sets
Four data sets, named as BBCSport, BBC-fulltext, Classic and WebKB, respectively, are used in the experiment are discussed below. Table 4 shows some prominent characteristics of the four data sets.
Table 4. Description of the Data Sets Used in the Experiment
|
Data Set |
Number of Documents |
Number of Classes |
DTM Dimensions |
|
BBCSport |
737 |
5 |
737 * 9678 |
|
BBC |
2225 |
5 |
2225 * 21221 |
|
Classic |
7095 |
4 |
7095 * 18687 |
|
WebKB |
8282 |
4 |
8282 * 269610 |
The BBCSport data set displayed in Table 5, consist of 737 documents from the BBC Sport website. It is a collection of sports news articles from 2004 to 2005. The data set is categorized on five areas namely, athletics, cricket, football, rugby and tennis [31].
Table 7. Distribution of Documents per Class in Classic Data Set
|
Dataset |
No. of Documents |
|
Cacm |
3204 |
|
Cisi |
1460 |
|
cran |
1398 |
|
med |
1033 |
|
total |
7095 |
Table 8. Distribution of Documents per Class in WebKB Data Set
|
Dataset |
No. of Documents |
|
student |
1641 |
|
faculty |
1124 |
|
staff |
137 |
|
department |
182 |
|
course |
930 |
|
project |
504 |
|
other |
3764 |
|
total |
8282 |
WebKB data set is a collection of documents that are webpages from computer science departments of various universities in January 1997, collected by the World Wide Knowledge Base (Web→Kb) project of CMU text learning group. The data set consist of 8282 pages that are manually classified into 7 groups. The distribution of the documents per class is displayed in table 8. However, for the experiment purpose 1396 documents are randomly selected. As the documents are long so the document term matrix dimensions are 1396 * 56103 which is difficult to analysis, so the top 5000 most frequent words are selected. The data set can be obtained from [33].
-
VIII. Experimental Results
In this section, four datasets are employed for the experiment. Two popular evaluation parameters known as purity and entropy are adopted to gauge the clustering performance.
The Purity is used to quantify the coherence of a cluster. Let C i be a cluster of size n i , then the purity of cluster C i is defined to be,
P(Ci ) = 1 maxh (nih ) (21) ni where maxh(nih) is the number of documents that are from the dominant category in cluster Ci and nhi represents the number of documents from cluster Ci assigned to category h. The purity 0 indicates a bad clustering and 1 indicates a perfect clustering [7].
Moreover, entropy is a measure to evaluate the quality of the clusters. As it is a negative measure the lower the entropy, better is the quality of the clusters. The entropy of a cluster Ci with size ni is formally defined as, khh
E(Ci) = - 1 ∑nilog(ni) (22) logc h=1 nini where c is the total number of categories in the data set and nhi is the number of documents from the hth class that were assigned to cluster Ci [7].
Tables 9 and 10 illustrate the purity and entropy values of distance measures. As it can be seen from these two tables, Bray-Curtis offers the best performance in both accuracy and entropy for all four data sets and Manhattan is the runner-up except for Classic dataset that Canberra provided better values.
Table 9. Purity Results for Distance Measures
|
Data |
BBCSport |
BBC |
Classic |
WebKB |
|
Manhattan |
0.7584 |
0.4323 |
0.5864 |
0.5229 |
|
Euclidean |
0.4586 |
0.2328 |
0.4515 |
0.3925 |
|
Canberra |
0.3595 |
0.2296 |
0.7568 |
0.4061 |
|
Bray-Curtis |
0.9131 |
0.9550 |
0.7651 |
0.5981 |
|
Table 10. Entropy Results for Distance Measures |
||||
|
Data |
BBCSport |
BBC |
Classic |
WebKB |
|
Manhattan |
0.3460 |
0.7731 |
0.6648 |
0.8192 |
|
Euclidean |
0.8252 |
0.9914 |
0.8344 |
0.9407 |
|
Canberra |
0.9522 |
0.9954 |
0.3647 |
0.9285 |
|
Bray-Curtis |
0.1885 |
0.1350 |
0.3227 |
0.7196 |
|
Table 11. Purity Results for Similarity Measures |
||||
|
Data |
BBCSport |
BBC |
Classic |
WebKB |
|
Cosine |
0.9457 |
0.9460 |
0.7506 |
0.5128 |
|
Extended Jaccard |
0.9267 |
0.9456 |
0.8415 |
0.4820 |
|
Extended Dice |
0.9267 |
0.9456 |
0.8415 |
0.4820 |
|
Pearson |
0.9430 |
0.7838 |
0.5155 |
0.4204 |
|
Table 12. Entropy Results for Similarity Measures |
||||
|
Data |
BBCSport |
BBC |
Classic |
WebKB |
|
Cosine |
0.1444 |
0.1553 |
0.3561 |
0.8269 |
|
Extended Jaccard |
0.1619 |
0.1558 |
0.2664 |
0.8523 |
|
Extended Dice |
0.1619 |
0.1558 |
0.2664 |
0.8523 |
|
Pearson |
0.1516 |
0.3292 |
0.7430 |
0.9233 |
In addition, tables 11 and 12 shows the purity and entropy values, respectively, obtained by k-means on testing the data sets. For the BBCSport, BBC and WebKB data set the best purity and entropy is achieved by cosine similarity measure. Moreover, for Classic data set the Extended Jaccard and Dice provided the better result. Note that the two similarity measure of Extended Jaccard and Dice performed same to each other in all four data sets.
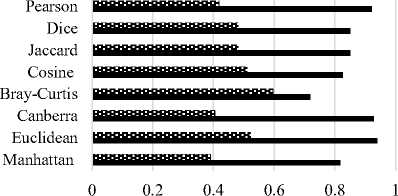
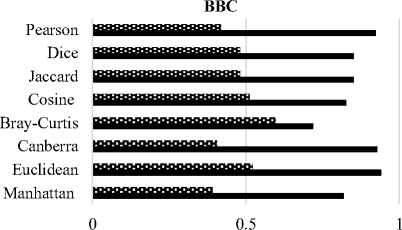
Overall, for BBC and WebKB data set the Bray-Curtis distance measure performed better as compared to others.In addition, for BBCSport data set the highest purity and lowest entropy was obtained by Extended Jaccard and Dice Coefficient. The Cosine similarity measure provided better values than their counterparts. For simplicity, Fig. 3 displays the purity and entropy results in the bar graphs.
BBCSport
в Purity ■ Entropy
№ Purity ■ Entropy
(a)
(b)
Classic
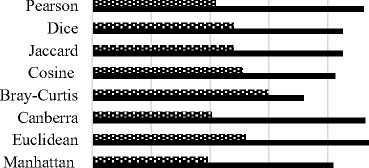
0 0.2 0.4 0.6 0.8 1
и Purity ■ Entropy
WebKB
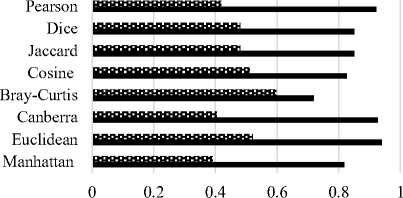
№ Purity ■ Entropy
(c)
(d)
Fig.3. Purity and Entropy Values for Different Data sets by K-means Algorithm. (a) BBC. (b) BBC. (c) Classic. (d) WebKB
-
IX. Conclusion
To conclude, the investigation among the distance measures considered for evaluation, the Bray-Curtis have provided the best results for all four data sets in both purity and entropy cases. Among the similarity measures the Extended Jaccard and Dice coefficient and cosine similarity measures Provides considerably good results as compared to others. However, it’s complicated to decide that which measure provides the best result in all data sets, due to reason that every data set shows a different behaviour while clustering them. But it is important to consider that the similarity measures, which are based on the absence and presence of the terms in the documents provides the better results as compared to other similarity measures. For future work, as the amount of data is drastically increasing, organizing this massive amount of text documents through existing clustering algorithms need laborious efforts. Therefore, developing innovative mining techniques that will use platforms such as Hadoop and MapReduce that will have the potential to parallelize the process of clustering will be an interesting topic of research work.
References An extensive study of similarity and dissimilarity measures used for text document clustering using k-means algorithm
- S. Grimes, "A Brief History of Text Analytics," BeyeNetwork, October, vol. 30, 2007.
- Ishwarappa and J. Anuradha, "A brief Introduction on Big Data 5Vs Characteristics and Hadoop Technology," Procedia Computer Science, vol. 48, pp. 319-324, 2015.
- J. Han, M. Kamber and J. Pei, "Data Mining: Concepts and Techniques", Amsterdam: Morgan Kaufmann, 2012.
- D. B. Patila and Y. V. Dongreb, "A Fuzzy Approach for Text Mining," International Journal of Mathematical Sciences and Computing (IJMSC), vol. 4, pp. 34-43, 2015.
- X. Wu et al., "Top 10 Algorithms in Data Mining," Knowledge and Information Systems, vol. 14, no. 1, pp. 1-37, 2008.
- P. Rathore, D. Kumar, J.C. Bezdek, S. Rajasegarar and M. S. Palaniswami, " A Rapid Hybrid Clustering Algorithm for Large Volumes of High Dimensional Data," IEEE Transactions on Knowledge and Data Engineering, 2018.
- A. Huang, "Similarity Measures for Text Document Clustering," in Proceedings of the Sixth New Zealand Computer Science Research Student Conference (NZCSRSC2008), Christchurch, New Zealand, 2008, pp. 49-56.
- P. Singh and M. Sharma, "Text Document Clustering and Similarity Measures," Dept. of Computer Science & Engg, IIT Khanpur, India 2013.
- M. Steinbach, G. Karypis, and V. Kumar, "A Comparison of Document Clustering Techniques," in KDD Workshop on Text Mining, 2000, vol. 400, no. 1, pp. 525-526: Boston.
- N. Garga and R. K. Gupta, "Exploration of Various Clustering Algorithms for Text Mining," International Journal of Education and Management Engineering, vol. 8, no. 4, pp. 10-18, Aug 2018.
- G. Williams, "Hands-on Data Science with R Text Mining," 2014.
- M. F. Porter, "An Algorithm for Suffix Stripping," Program, vol. 14, no. 3, pp. 130-137, 1980.
- E. Haddi, X. Liu, and Y. Shi, "The Role of Text Pre-processing in Sentiment Analysis," Procedia Computer Science, vol. 17, pp. 26-32, 2013.
- R. Zhao and K. Mao, "Fuzzy Bag-of-Words Model for Document Representation," IEEE Transactions on Fuzzy Systems, vol.26, no. 2, pp. 794-804, 2018.
- G. Salton, A. Wong, and C. S. Yang, "A Vector Space Model for Automatic Indexing," Communications of the ACM, vol. 18, no. 11, pp. 613-620, Jan 1975.
- G. Salton and C. Buckley, "Term-weighting Approaches in Automatic Text Retrieval," Information Processing & Management, vol. 24, no. 5, pp. 513-523, 1988.
- M. Jabalameli, A. Arman and M. Nematbakhsh, "Improving the Efficiency of Term Weighting in Set of Dynamic Documents," International Journal of Modern Education and Computer Science, vol. 7, no. 2, pp. 42-47, Aug 2015.
- M. Afzali and S. Kumar, "Comparative analysis of various similarity measures for finding similarity of two documents," International Journal of Database Theory and Application, vol. 10, no. 2, pp. 23-30, 2017.
- A. Luthra and S. Kumar, "Extension of K-Modes Algorithm for Generating Clusters Automatically," International Journal of Information Technology and Computer Science (IJITCS), vol. 8, no. 3, pp. 51-57, DOI: 10.5815/ijitcs.2016.03.06, March 2016, ISSN: 2074-9007 (Print), ISSN: 2074-9015 (Online).
- S. Kumar and M. Garg, "Improving the Initial Centroids of K-Means Clustering Algorithm to Generalize its Applicability," Journal of the Institution of Engineers (India): Series B, vol. 95, no. 4, pp. 345-350, ISSN: 345-350, ISSN: 2250-2106, DOI: 10.1007/s40031-014-0106-z, July 2014.
- A. Khandare and A. Alvi, "Efficient Clustering Algorithm with Enhanced Cohesive Quality Clusters," International Journal of Intelligent Systems and Applications, vol. 10, no. 7, pp.48-57, Aug 2018.
- A. K. Jain, "Data clustering: 50 years beyond K-means," Pattern recognition letters, vol. 31, no. 8, pp. 651-666, 2010.
- A. Maedeh and K. Suresh, "Design of Efficient K-Means Clustering Algorithm with Improved Initial Centroids," MR International Journal of Engineering and Technology, vol. 5, no. 1, pp. 33-38, ISSN: 0975-4997, June 2013.
- S.-S. Choi, S.-H. Cha, and C. C. Tappert, "A survey of binary similarity and distance measures," Journal of Systemics, Cybernetics and Informatics, vol. 8, no. 1, pp. 43-48, 2010.
- J. Ma, X. Jiang, M. Gong, "Two-phase Clustering Algorithm with Density Exploring Distance Measure," CAAI Transactions on Intelligence Technology, vol. 3, no. 1, pp. 59-64, Jan 2018.
- F. Bellot and E. E. Krause, "Taxicab Geometry: An Adventure in Non-Euclidean Geometry," The Mathematical Gazette, vol. 72, no. 461, p. 255, 1988.
- Y. S. Lin, J. Y. Jiang, and S. J. Lee, "A Similarity Measure for Text Classification and Clustering," IEEE Transactions on Knowledge and Data Engineering, vol. 26, no. 7, pp. 1575-1590, 2014.
- M. G. Michie, "Use of the Bray-Curtis Similarity Measure in Cluster Analysis of Foraminiferal Data," Journal of the International Association for Mathematical Geology, vol. 14, no. 6, pp. 661-667, 1982.
- J. Y. Jiang, W. H. Cheng, Y. S. Chiou, and S. J. Lee, "A Similarity Measure for Text Processing," in Machine Learning and Cybernetics (ICMLC), 2011 International Conference on, 2011, vol. 4, pp. 1460-1465: IEEE.
- S. Santini and R. Jain, "Similarity Measures," IEEE Transactions on Pattern Analysis and Machine Intelligence, vol. 21, no. 9, pp. 871-883, 1999.
- D. Greene and P. Cunningham, "Practical Solutions to the Problem of Diagonal Dominance in Kernel Document Clustering," in Proceedings of the 23rd International Conference on Machine Learning, 2006, pp. 377-384: ACM.
- "Classic3 and Classic4 DataSets | Data Mining Research," Data Mining Reaserch RSS. [Online]. Available: http://www.dataminingreaserch.com/index.php/2010/09/classic3-classic4-classic4-datasets/. [Accessed: 27- Jul-2018].
- "CMU World Wide Knowledge Base (Web->KB) Project," [Online]. Available: http://www.cs.cmu.edu/~webkb/. [Accessed: 15-Jan-2018].
