Analysis of operating conditions for wheeled non-suspended vehicles based on experimental research

Author: Ryabov I.M., Pozdeev A.V., Erontaev V.V., Timoshin N.V., Diakov A.S., Golubchik T.V., Dygalo V.G., Chudakov O.I., Evseev K.B., Zakirov R.A.
Section: Краткие сообщения
Article in issue: 4 т.22, 2022.
Free access
Wheeled unsuspended machines include many slow-moving machines whose transport speed does not exceed 30-40 km/h. A distinctive feature of these machines is that the wheels and axles of these machines are rigidly attached to the frame, with no elastic and damping devices responsible for the smooth running of the vehicle. Examples of unsuspended wheeled machines are tractors, combines, as well as other agricultural, construction and special machines, the operation of which is carried out mainly on roads with uneven pavement. This article is devoted to the analysis of the operating conditions of wheeled non-suspended vehicles based on experimental studies obtained by NATI and other research organizations. Typical operating conditions for suspensionless machines are fields and dirt roads, which are very diverse and can be in different conditions depending on the intensity of operation, repair work and other factors. It was found that most (55%) of the total operating time per year, wheeled tractors carry out transport work, and a smaller (45%) they operate in the fields. The speed of movement of wheeled tractors during most operations in the fields is 5-10 km / h, for harvesting hay and silage crops - 10-15 km / h, for transport operations - 20-25 km / h. An analysis of the heights and lengths of irregularities in fields, dirt and gravel roads showed that their values vary in narrow ranges. It was found that the spectrum of the microprofile changes significantly with increasing speed. This makes it difficult to accurately determine the ranges of the most probable disturbance frequencies.
Wheeled unsuspended machine, operating conditions, transport speed, operating speed
Short address: https://sciup.org/147239494
IDR: 147239494 | UDC: 629.369 | DOI: 10.14529/engin220407
Анализ условий эксплуатации колесных бесподвесочных машин на основе экспериментальных исследований
К колесным бесподвесочным машинам относятся многие тихоходные машины, транспортная скорость которых не превышает 30-40 км/ч. Отличительной особенностью данных машин является то, что колеса и мосты этих транспортных средств жестко крепятся к раме, при этом в конструкции автомобиля отсутствуют упругие и гасящие устройства, отвечающие за плавность хода транспортного средства. Примерами бесподвесоччных колесных машин являются трактора, комбайны, а также другие сельскохозяйственные, строительно-дорожные и специальные машины. Типичными условиями эксплуатации бесподвесочных машин являются поля и грунтовые дороги, которые весьма разнообразны и могут находиться в различном состоянии в зависимости от интенсивности эксплуатации, проведения ремонтных работ и других факторов. Данная статья посвящена анализу условий эксплуатации колесных бесподвесочных машин на основе экспериментальных исследований, полученных НАТИ и другими научно-исследовательскими организациями. Выявлено, что большую часть (55 %) от общего времени работы за год колесные тракторы осуществляют транспортные работы, а меньшую (45 %) они эксплуатируются на полях. Скорость движения колесных тракторов при выполнении большинства операций на полях - 5-10 км/ч, на уборке сена и силосных культур - 10-15 км/ч, на транспортных работах - 20-25 км/ч. Анализ высот и длин неровностей полей, грунтовых и гравийных дорог показал, что их значения изменяются в узких диапазонах. Установлено, что спектр микропрофиля значительно изменяется при увеличении скорости движения. Это затрудняет точное определение диапазонов наиболее вероятных частот возмущающего воздействия.
Text of the brief report Analysis of operating conditions for wheeled non-suspended vehicles based on experimental research
Currently, a large number of wheeled non-suspended vehicles (KBM) are produced and operated: tractors, combines and other agricultural, construction-road and special wheeled vehicles[1–20]. The absence of a suspension, on the one hand, simplifies the design of the machine and lowers its cost, but, on the other hand, the ride smoothness is reduced, since in the KBM the only elements protecting their skeleton from vibration resulting from wheel collisions on uneven roads are pneumatic tires that have low vibration protection properties [1–3].
Typical operating conditions for MSC when performing various agricultural operations are fields, and when performing transport operations – dirt roads, which are very diverse and can be in different states depending on the intensity of operation, repair work and other factors [4]. They can be classified as follows:
-
1) smooth roads with a small number of low irregularities;
-
2) uneven, worn out roads with a large number of irregularities of various heights, as well as areas with large irregularities;
-
3) roads with soft, pliable surfaces.
Analysis of various operating conditions for wheeled non-suspended vehicles on the basis of experimental research
As a result of experimental studies, the proportion of the time spent by wheeled and tracked tractors on performing various agricultural operations during the year was determined, as well as the speed of their implementation (Table 1).
Table 1
Shares of the time spent by tractors on performing various agricultural operations during the year and the speed during their implementation [4]
|
Agricultural operations |
Wheeled tractors Tracked tractors Time for the operation average Time for the operation average in % of the total time of speed in in % of the total time of speed in usein a year km/h use in a year km/h |
|
Plowing Cultivation Sowing Inter-row processing Disking Fertilization Hay cleaning Silage harvesting Transport works |
– – 35 5–8 5 8–10 5 5–8 5 8–10 4 5–8 5 10 – – – – 6 5–8 5 5–8 – – 15 10–15 10 10–12 10 10–15 – – 55 20–25 25 10–15 |
Analysis of Table 1 allows us to draw the following conclusions:
-
– most of the time – 55% of the total operating time per year, wheeled tractors carry out transport operations, 45% of them are operated in the fields;
-
– the speed of movement of wheeled tractors in the fields during most operations varies within 5–10 km/h;
-
– on 2 operations – when harvesting hay and silage crops, the speed is 10–15 km/h;
-
– on transport works, the speed is 20–25 km/h.
The operating experience shows that the greatest vibrations of the KBM skeleton occur on uneven dirt roads with a hard surface. In the fields, KBM sway less, since the surface is soft and has damping properties. Attached agricultural machines also reduce the vibrations of wheeled tractors, because reduce the natural frequency. In the case of movement across the furrows in fields with row crops, the vibrations of the skeleton are significantly enhanced, since the KBM overcomes periodic irregularities of a short length (0.4–1.1 m) with a height of up to 45 mm. However, in such conditions, the KBM is rarely operated.
As a result of experimental studies by NATI and other research organizations, the characteristics of their microprofiles were determined [4–6]. In addition, it was revealed that some irregularities have smooth edges and are symmetrical about the middle, and the profile with several irregularities is close to sinusoidal. However, no in-depth analysis and generalization of the obtained data was carried out.
In [4], the parameters of roughness collected by measurements were processed by the methods of mathematical statistics. The obtained distribution densities of heights and lengths of irregularities of fields and a dirt road in the form of experimental and theoretical diagrams, which are shown in Fig. 1 and 2, also plotted the graphs of the theoretical distribution densities of irregularities heights obtained by the formula:
-
(hi - mh
and the lengths of irregularities according to the formula:
(S« -S)^N, _____________________i=1 os Jin
( s i - m s ) 2
2.0
s
where σ h and m h – mean square deviation (RMSD) and mathematical expectation of irregularities heights; σ s и m s – RMSD and mathematical expectation of irregularity lengths .
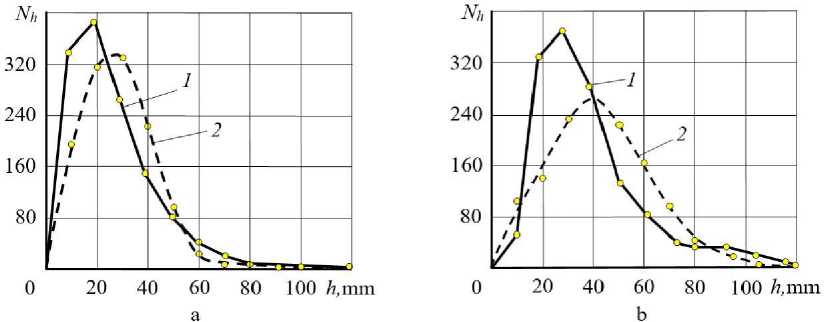
Fig. 1. Distribution of irregularities heights: a – on stubble (across furrows; m h = 26 мм, σ h = 15 мм); b – on a dirt road ( m h = 39 мм, σ h = 22,2 мм); 1 – experimental data;
2 – calculated data according to the formula (1)
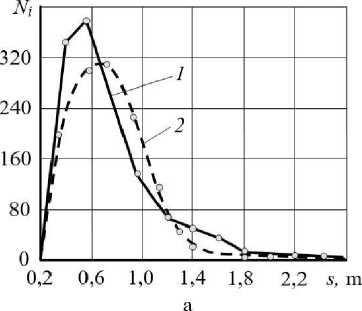
Fig. 2. Distribution of irregularities lengths: a – on stubble (across furrows; m s = 0,72 м, σ s = 0,32 м); b – on a dirt road ( m s = 1,93 м, σ s = 0,94 м); 1 – experimental data;
2 – calculated data according to the formula (2).
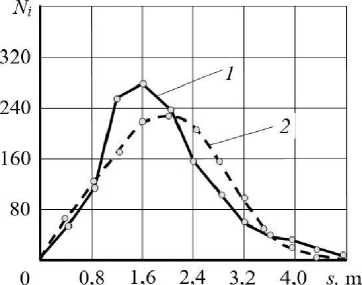
Fig. 3 shows the results of an experimental study of highways in the form of diagrams of the distribution density of heights and irregularities.
Fig. 3. Characteristics of road irregularities operated by vehicles [6]:
a – distribution of heights of irregularities per 1 km of track; b – distribution of irregularities lengths: 1 – heavily worn cobblestone highway; 2 – heavily worn dirt road; 3 – dirt road
From the diagrams (Fig. 1a, 2a and 3a) it follows that the most probable heights of irregularities are within the following limits:
– on the field ………………………………………. 10–45 mm;
-
– on a dirt road …………………………………….. 20–60 mm;
-
– on a heavily worn cobblestone highway .................15–70 mm;
-
– on a heavily worn dirt road………………………..10–80 mm;
-
– on a broken crushed stone highway ……………….30–100 mm.
The diagrams in Figures 2b, 3b and 4b show that the most probable irregularity lengths are within:
-
– on the field ………………………………………... 0.3–1.4 m;
-
– on a dirt road ……………………………………….0.7–3.0 m;
-
– on a heavily worn cobblestone highway .................. 0.6–1.8 m;
-
– on a heavily worn dirt road ...................................... 1.0–3.0 m;
-
– on a broken crushed stone highway ………….…….1.0–3.5 m.
Fig. 4 shows the dependences of the height of irregularities h of different roads on their length s, from which it can be seen that as the length of the irregularities increases, their height increases proportionally. These dependencies are the reason for the increase in the intensity of vibrations of machines with an increase in the speed of movement, since in this case the resonance is caused by ever longer irregularities that have a large height.
The results of the study of unevenness of sections of a dirt road of various degrees of wear are given in Table 2 [4].
Analysis of the data in Table 2 shows that the length of irregularities in areas with different degrees of wear differs slightly, the height of irregularities in slightly worn areas is on average 50% less than in highly worn areas.
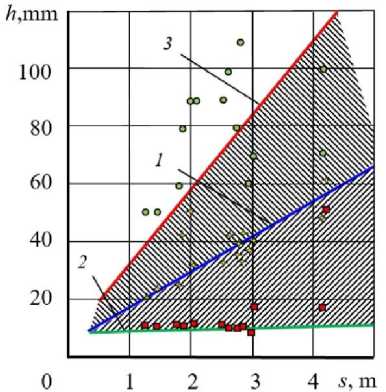
Fig. 4. Dependences of the height of the unevenness on the length of the unevenness: 1 – on a dirt road; 2 – on a cement concrete highway; 3 – on a dirt road 1 – heavily worn cobblestone highway; 2 – heavily worn dirt road; 3 – dirt road
Table 2
Parameters of unevenness of sections of a dirt road of various degrees of wear [4]
|
Plot |
Section length L in m |
The number of irregularities on the site |
Length irregularities s in m |
Height irregularities h in mm |
Distance between irregularities (step) a in mm |
|
Badly worn |
85 |
51 |
1,41 |
38 |
1,6 |
|
105 |
64 |
1,40 |
34 |
1,39 |
|
|
92 |
54 |
1,42 |
38 |
1,61 |
|
|
Medium worn |
47 |
33 |
1,25 |
29 |
1,26 |
|
65 |
33 |
1,25 |
29 |
1,26 |
|
|
Badly worn |
60 |
38 |
1,25 |
33 |
1,16 |
|
Medium worn |
36 |
25 |
1,22 |
32 |
1,30 |
|
Little worn |
51 |
32 |
1,07 |
23 |
1,28 |
The classification and parameters of unevenness of dirt and gravel roads, obtained as a result of processing these measurements, are shown in Table 3 [4].
Comparison of the research results obtained on the basis of Figures 1, 2 and 3 with the data of Tables 2 and 3 shows that they basically correspond to each other. A slight difference is observed in the ranges of variation of the parameters of irregularities; in the tables they are narrower than in the figures. Analysis of the distribution density diagrams of the heights of irregularities (Fig. 1a, 2a and 3a) and the data of tables 2 and 3 allows us to draw the following conclusions:
-
1) on stubble across furrows: expected height of irregularities m h = 26 mm, standard deviation σ h = 15 mm, expected length of irregularities m s = 0,72 m, σ s = 0,32 m;
-
2) on a dirt road: the mathematical expectation of the height of irregularities m h = 39 mm, standard deviation σ h = 22,2 mm; expected length of irregularities m s = 1,93 m, σ s = 0,94 m;
-
3) on a heavily worn gravel road there are bumps of the maximum length – 3,5 m, which can cause resonance vibrations at high speed (25–35 km/h).
Table 3
Classification and parameters of unevenness of dirt and gravel roads
|
Roads |
Height irregularities h in mm |
Length irregularities s in mm |
Distance between irregularities (step) a in mm |
|
Ground: |
|||
|
Little worn |
20–30 |
1,0– 1,1 |
1,0– 1,5 |
|
medium worn |
30–40 |
1,0–1,5 |
1,5–2,0 |
|
badly worn |
40–70 |
1,5–2,5 |
2,0–2,5 |
|
Gravel: |
|||
|
Little worn |
10–20 |
1,2– 1,5 |
1,5– 1,8 |
|
medium worn |
20–30 |
1,5–2,0 |
1,8–2,0 |
|
badly worn |
30–60 |
2,0–3,5 |
2,0–3,5 |
The microprofile of various sections of roads and agrophones can be represented as a random alternation of protrusions and depressions of various sizes and shapes, and described by a continuous random function [7]. It is assumed that the random process of the impact of the micro-profile of a road or a field on a tractor is stationary (independent of the start of the reference time) and ergodic, i.e. allowing to construct the characteristics of the distribution of a random function of the microprofile according to one of its implementations.To characterize a random micro-profile, it is convenient to use the correlation function K(х) or spectral density S(p) . Fig. 5 shows the spectral densities of a sample series of microprofiles of a potato field, obtained on the basis of experimental measurements when a tractor is moving at different speeds in gears I and II. Fig. 6 shows the spectral densities of a sample series of microprofiles of virgin lands and deposits [8].
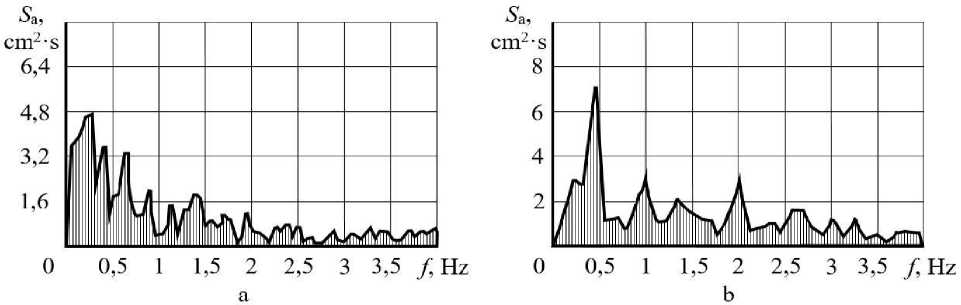
Fig. 5. Spectral densities of sample series of microprofiles of a potato field, obtained on the basis of experimental measurements: a – potato field (I gear); b – potato field (II gear)
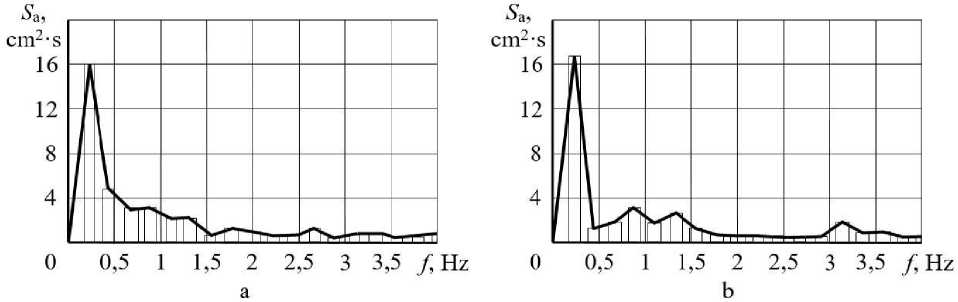
Fig. 6. Spectral densities of sample series of microprofiles of agricultural phones obtained on the basis of experimental measurements: a – virgin lands; b – deposits
Analysis of the curves in Fig. 5 and 6 leads to the following conclusions:
-
1) on all considered agrophones, the main frequency spectrum is in the range of 0 ... 1.5 Hz, i.e. means that there are irregularities of great length and height on the fields, which do not affect the smooth running of the KBM;
-
2) in the frequency range of 2–4 Hz (in which the resonance of various MSCs on agrophones is possible), there are peaks on all spectra of the fields, they indicate the frequencies in which the height of the irregularities is greater;
-
3) with an increase in the speed of the tractor (when switching from the first gear in the potato field (Fig. 5a) to the second gear (Fig. 5b)), the spectrum changes significantly, sharp peaks appear at frequencies in the frequency range of 2–4 Hz, in which the KBM resonance is possible with the same frequency of natural vibrations of the frame on the tires.
A significant change in the spectrum of the micro-profile with an increase in the speed of movement makes it difficult to accurately determine the most likely frequency ranges of the disturbing effect of a dirt road and various fields when tractors and other MSCs move at different speeds, therefore, to find these frequency ranges, it is advisable to use statistical data on the most probable lengths of irregularities on the roads and fields above.
Conclusions
-
• Typical operating conditions for suspensionless machines when performing various agricultural operations are fields, and when performing transport operations, dirt roads.
-
• Most of the time – 55% of the total operating time per year, wheeled tractors carry out transport operations, and 45% of them operate in the fields.
-
• The speed of wheeled tractors in the fields during most operations varies within 5–10 km / h, when harvesting hay and silage crops the speed is higher – 10–15 km / h, and in transport operations the speed is 20–25 km / h.
-
• Heights and lengths of irregularities of fields and dirt roads are in the ranges: 10–60 mm and 0.7– 3.0 m, respectively.
-
• The spectrum of the micro-profile changes significantly with increasing speed, which makes it difficult to accurately determine the frequency ranges of the disturbance.
Acknowledgements
The work is financially supported by the Ministry of Science and Higher Education of the Russian Federation as part of a comprehensive project to create high-tech production “Creation of high-tech production of an unified family of vehicles “Arctic Bus” to organize the safe transportation of passengers and mobile points of the social sphere in the regions of the Far North in conditions of low temperatures (up to minus 50 °C) to ensure the connectivity of the territories of the Arctic zone of the Russian Federation” under the agreement № 075-11-2021-058 dated 06/25/2021 (Government Contract ID
000000S407521QLY0002)
References Analysis of operating conditions for wheeled non-suspended vehicles based on experimental research
- Виброзащитные свойства пневматических шин бесподвесочных машин и пути их повышения / И.М. Рябов, А.В. Поздеев, А.Ю. Соколов и др. // Автомобильная промышленность. -2014. - № 8. - С. 20-22.
- Соколов, А.Ю. Повышение виброзащитных свойств шины за счет внутренней пневматической демпфирующей системы: автореферат дис. ... кандидата технических наук: 05.05.03 / Соколов Александр Юрьевич. - Волгоград, 2014. - 18 с.
- Системы подрессоривания современных тракторов: (Конструкция, теория и расчет) / Д.А. Попов, Е.Г. Попов, Ю.Л. Волошин и др. -М.: Машиностроение. - 1974. - 174 с.
- Митянин, П.И. Исследование поглощающей и сглаживающей способностей шины при колебаниях грузового автомобиля: автореферат дис. на соискание ученой степени кандидата технических наук. (05.05.03) /П.И. Митянин //Моск. автомоб.-дор. ин-т. -М., 1975. - 26 с.
- Работа автомобильной шины / В.И. Кнороз, А.С. Шелухин, И.П. Петров и др. - М.: Транспорт. - 1976. - 238 с.
- Kotiev, G.O. Advanced development and testing of off-road vehicle / G.O. Kotiev, A.S. Diakov // DEStech Transactions on computer science and engineering // 2017 2nd International Conference on Computer, Mechatronics and Electronic Engineering (CMEE 2017). - 2018. - P. 464-467. DOI 10.12783/dtcse/cmee2017/20021.
- Designs and development of Russian scientific schools in the field of cross-country ground vehicles building / G.O. Kotiev, B.V. Padalkin, A.B. Kartashov et al. // ARPN Journal of Engineering and Applied Sciences. - 2017. - Т. 12. - No. 4. - С. 1064-1071.
- Experimental studies of the snowmobile engine rubber-metal vibration dampers specifications / A.S. Diakov, A.V. Pozdeev, M.V. Lyashenko et al. // IOP Conf. Series: Materials Science and Engineering. - 2020. - Vol. 709, Iss. 3. - Art. no. 044001. DOI: 10.1088/1757-899X/709/4/044001.
- Experimental evaluation of the effect of cryogenic treatment of brake discs of the vehicle on the performance characteristics / V.G. Dygalo, I.S. Zhukov, A.S. Diakov et al. //IOP Conference Series: Materials Science and Engineering. - 2020. - Vol. 820 , Iss. 1. - Art. no. 012004. DOI: 10.1088/1757-899X/820/1/012004
- Analysis of the current state of research in the field of improving the smooth ride of vehicles equipped with suspension / V.V. Novikov, A. V. Pozdeev, K. V. Chernyshov et al. // IOP Conference Series: Materials Science and Engineering - 2020. - Vol. 820, Iss. 1. - Art. no. 012035. DOI: 10.1088/1757-899X/820/1/012035.
- Giannakos, К. Modeling the influence of short wavelength defects in a railway track on the dynamic behavior of the Non-Suspended Masses / K. Giannakos // Mechanical Systems and Signal Processing. - 2016. - Vol. 68-68. - P. 68-83.
- Vibrational control of air suspension system using PID controller / K. Prabu, J. Jancirani, J. Dennie et al. // Journal of Vibroengineering. - 2013. - Vol. 15. - P. 132-138.
- Active suspension system based on linear switched reluctance actuator and control schemes / J. Lin, K. W. E. Cheng, Z. Zhang et al. // IEEE Transactions on Vehicular Technology - 2013. -Vol. 62. - P. 562-572.
- Guo, L.-X. Robust H-control of active vehicle suspension under non-stationary running / L.-X. Guo, L.-P. Zhang // Journal of Sound & Vibration - 2012. - Vol. 331. - P. 5824-5837.
- Non-fragile H-control for half-vehicle active suspension systems with actuator uncertainties / H. Li, H. Liu, C. Hilton et al. // Journal of Vibration & Control. - 2013. - Vol. 19. - P. 560-575.
- Sun, W. Finite frequency H-control for vehicle active suspension systems / W. Sun, H. Gao, O. Kaynak //IEEE Transactions on Control Systems Technology. - 2011. - Vol. 19. - No. 2. -P. 416-422.
- Active suspension control with frequency band constraints and actuator input delay / W. Sun, Y. Zhao, J. Li et al. // IEEE Transactions on Industrial Electronics. - 2012. - Vol. 59. - No. 1. -P. 530-537.
- Lian, R.-J. Enhanced adaptive self-organizing fuzzy sliding-mode controller for active suspension systems / R.-J. Lian // IEEE Transactions on Industrial Electronics. - 2013. - Vol. 60. -P. 958-968.
- Adaptive sliding-mode control for nonlinear active suspension vehicle systems using T-S fuzzy approach / H. Li, J. Yu, C. Hilton et al. // IEEE Transactions on Industrial Electronics. - 2013. -Vol. 60. - P. 3328-3338.
- Development of a sliding mode controller for semi-active vehicle suspensions/ J.-L. Yao, W.-K. Shi, J.-Q. Zheng et al. // Journal of Vibration & Control. - 2013. - Vol. 19. - P. 1152-1160.
