Application of Cloud Theory in Association Rules

Author: Zhaohong Wang
Journal: International Journal of Information Technology and Computer Science(IJITCS) @ijitcs
Article in issue: 3 Vol. 3, 2011.
Free access
The data mining is to discover knowledge from the database, quantitative association rules mining method is difficult for their values are too large. The usual means is dividing quantitative Data to discrete conception. The Cloud model combines fuzziness and randomness organically, so it fits the real world objectively, a new method to mine association rules from quantitative data based on the cloud model was proposed, which first take the original data distribution in the database into account, and then use the trapezoidal cloud model to complicate concepts division, and transforms qualitative data to the quantitative concept, in the conversion take account of the basic characteristics of human behavior fully, divides quantitative Data with trapezium Cloud model to create discreet concepts, the concept cluster within one class, and separated with each other. So the quantitative Data can be transforms to Boolean data well, the Boolean data can be mined by the mature Boolean association rules mining method to find useful knowledge.
Cloud Theory, Association Rules, Trapezium-Cloud Model, Conception Division, Frequent Item Sets
Short address: https://sciup.org/15011624
IDR: 15011624
Text of the scientific article Application of Cloud Theory in Association Rules
Published Online June 2011 in MECS
-
I. Introduction
The origin of data mining is to discover knowledge from the database (Knowledge Discovery in Database, called KDD), which first appeared in August 1989, held in Detroit, the Eleventh International Joint Conference on Artificial Intelligence. KDD is the process to identify valid, novel, potentially useful and ultimately understandable patterns from the data.
-
A. Data Mining
Data mining use some specific algorithm with acceptable efficiency to generate some specific patterns within the limited steps.
Thus, the whole KDD process is a knowledge-user centered, human-computer interaction process of exploration. Data mining is the most important step in knowledge discovery.
Data Mining and Knowledge Discovery are based on the database, artificial intelligence, statistics, visualization technology, is a new cross-disciplinary, its research is very extensive.
Despite much progress, data mining and knowledge discovery is still facing many difficulties and challenges:
First of all, the database itself, the real world data in the database is dynamic and the number is large, Sometimes the data is incomplete, there is noise, uncertainty, loss of information, information redundancy, and data sparse.
Second, the existing theory and the algorithm has yet to be developed, such as qualitative and quantitative conversion, uncertainty reasoning and some fundamental problems have not been solved, so to develop new and efficient data mining algorithms is efficient.
The diversity of database types, namely, the algorithm for relational databases may not be suitable for object-oriented database, as well as large scale databases and high dimensional data problems;
Knowledge representation includes how to represent knowledge effectively, so that people easily understand, such as how the data visualization, to promote people to take the initiative to learn that knowledge. Therefore, indepth knowledge of that data mining is an important step towards the practical.
The current data mining and knowledge discovery system is not satisfactory; people can not get what they want like the relational database system SQL language do. Another problem is the combination the data mining systems and practical application was not enough, so the data mining and other technologies, especially the combination of data warehouse technology is an important in future.
The object of data mining may involve issues of personal privacy, as more people aware of the problem, there may lead to a number of other contradictions. For example: people refuse to use credit cards, or complain about violations of personal privacy, etc.
Network and Distributed KDD environment issues;
Popularization of data mining has a great relationship with the user knowledge structure and the cultural background.
Relational knowledge reflects a dependency between the event and other events or the associated knowledge, also known as dependency relationship. Such knowledge can be used for database normalization, query optimization.
-
B. Association Rules
Mining association rules in data items of the transaction database was introduced by R. Agrawal for the first time. A typical example of association rules is the "90% of customers who buy bread and butter will also buy milk", its intuitive meaning is that if the customers bought something and what is the tendency that they also buy other things, to find all the rules like this is valuable for the determination of marketing strategy. Other applications of association rules include additional mail, catalog design, additional sales, storage planning, and customer buying patterns division and so on. For some more extensive use, association rules can be applied in other areas, such as medical researchers hope to identify common features of patients who suffer from a disease from thousands of existing medical records, which provide help for the cure of the disease. These applications database are extremely large, therefore, not only need to design efficient algorithms for mining association rules, but also should find ways to solve how to maintain and update these rules, how to verify the worthiness of these rules, how to mine association rules from a distributed database.
Association rule mining refers mainly to get the knowledge such as "customers bought tea . also purchased the coffee," which meet the minimum support and the minimum confidence. At present association rules can be divided into two types: Boolean association rules and quantitative association rules, and most of the research are focused on the Boolean association rules research.
First, give the formal description of association rules mining: Suppose I = (i1, i2... im) is a collection of m different items, T = (t1, t2... tn) is a transaction database, t j is a group of items of I set, t j ∈ I. Each transaction with a unique identifier TID linked. If X is a subset of I with X ∈ t j , we say that a transaction contains X. An association rule is a "X ^ Y" implication, in which X E I, Y ∈ I, and X∩Y=Φ.
Definition 1: If the ratio of transaction T contains X ∪
Y is Sup, the association rules X ^ Y in T has a support degree Sup.
support(x U y)
Sup = ——— --— x 100%
n (1)
Support (X ∪ Y) stands for the number which support X ∪ Y transactions, n stands for the total number of transactions.
Definition 2: If the ratio transaction T contains X also contains Y is Conf, then the confidence level of association rules X ^ Y in T is Conf.
Conf = support(x U y) x 100% support(x) (2)
Association rules are called the strong association rules if they meet the minimum support and minimum confidence [1] [2].
Definition 3: Boolean association rules are got from the transaction database whose items values are 0 or 1.
Mining process is as follows:
-
(1) Identify the transaction database T in all the nonempty sets which meet user-defined minimum support degree, if the item sets meet the minimum support degree which are called frequent item sets.
-
(2) Using frequent item sets generate the required association rules. For each frequent item sets A, identify all non-empty subset A ∈ a, if support(A)
——— — > min conf support(a) , then generated association rules a ^(A-a) [1][2].
The above methods only consider whether the transaction contains the item, regardless of the number of item, for example, they only consider whether a particular transaction contains tea, regardless of a pound of tea or five pounds of tea; a lot of useful information are lost[3][4].
In applications, quantitative attribute Data quantity gathered in a certain range may contain very useful knowledge. Upper and lower limits in the expression is too rigid, for example: for
-
II. Cloud Theory
In the past years, people mainly focused on the research of data mining algorithms, little attention was paid on the expression of knowledge and the quantitative and qualitative conversion, basically followed the previous AI Research results. In the field of artificial intelligence, the main methods to study knowledge and the uncertainty reasoning are the statistical, evidence theory and fuzzy set theory methods; the uncertainty is divided into fuzziness and randomness to study. Randomness is the uncertainty which is clearly defined but not always happened event.
For example: a coin toss experiment, the result is clear, either national emblem side is up, or the score side is up, does not exist other state, but the results of each test was random. Probability theory and mathematical statistics study the statistical regularity of random phenomena; it has been studied for hundreds of years. Another uncertainty is already there but it is difficult to give precise definitions, called fuzzy. Fuzzy concept is in the prevalence of daily life and work, for example, "young people", "tall", "Fat Man", "job security", "reliable" and so on.
To study these widespread fuzziness, American scientists L.A.Zadeh introduced the concept of fuzzy sets in 1965 as the main tool to deal with fuzziness, fuzzy set theory give the concept of membership degree to describe the fuzzy nature of things, However, once a precise description of membership functions to fuzzy sets were defined, fuzzy concept were forced into the exact calculations, since then, in the definition of the concept, theorem statements and proof of mathematical thinking session, they have not any slightest fuzziness no longer. This is the limitations of the traditional fuzzy set theory. To solve this problem, [4] presented qualitative and quantitative transformation model uncertainty - the cloud model on the basis of the traditional fuzzy set theory and probability and statistics, it fully integrated concept of fuzziness and randomness to complicate the natural conversion between concepts and quantitative values.
Cloud model is a qualitative and quantitative conversion model; it combines fuzziness and randomness organically.
Set U is a mathematical domain U={x}, T is the language value associated with the U. μT (x) is a stable tendency random number which expressed the elements x subordination of T concept, subordination’s distribution in the domain is known as the cloud [5][6].
Cloud mathematical expected curve is its subordination curves from the view of fuzzy set theory. However, "thickness" of the curve is uneven, waist is the most scattered, the top and bottom of the curve are convergent, cloud's "thick" reflects the subordination degree randomness, near to or away from the concept center have smaller subordination randomness, while concept center have the largest subordination randomness, which is consistent with people's subjective feelings.
-
A. The normal cloud model
The digital features of the normal cloud characterized by three values with the expectation Ex, entropy En excess entropy He) fig.1.
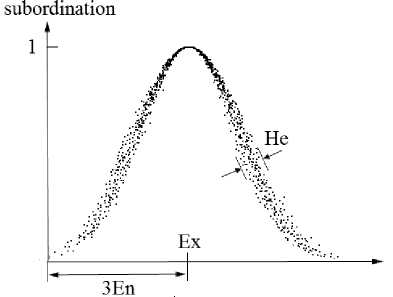
Figure 1. The digital features of the normal cloud
The expected value Ex: Ex is the center value of the concept domain and the most representative qualitative value of the concept, it should be 100% belongs to the concept; Ex reflect the value of the information center of the qualitative knowledge.
Entropy En: is a qualitative measure of the concept’s fuzziness, reflecting the accepted range values of the concept domain; the greater the En is, the range of values represented by the concept is the greater, the more vague the concept is.
Hyper entropy He: can be described as entropy En of entropy, reflecting the degree of dispersion of the cloud droplets.
Since entropy reflects the range of the domain language can be the accepted by people, and hyper entropy He is entropy’s entropy, He is small, random entropy En change is small, indicating that people is more consistent that a qualitative value of belong to the concept; on the contrary, if He is large, randomized entropy En change a lot, that indicates people have big differences in understanding a qualitative value belong to the concept, which reflects the understanding is not the same whether the qualitative concepts is accepted. As a result, people do not know the extent to which a cloud droplet belongs to the concept. So in order to reflect the concept that people have some same understanding, while there are some differences, it is more appropriate that En and He ratio is usually between 15 to 40. Fig.2 (a-f) He changes reflects the different situations.
We can be seen Fig. 2 (f), although En equal to1, but He is 50, this indicated that the random entropy can be broadly range from -149 to 151 to calculate the degree of membership of each cloud droplets, so that the changes of random entropy will be very large, almost like that each cloud droplet will use a completely different entropy [5].
Thus, use the cloud model to represent the membership function is to determine the digital features of the cloud model, if the concept itself is clear and it is understood consistently by almost all people, you can use smaller En and He. If the concept itself is vague, our understanding is very inconsistent, you can use larger En and He.
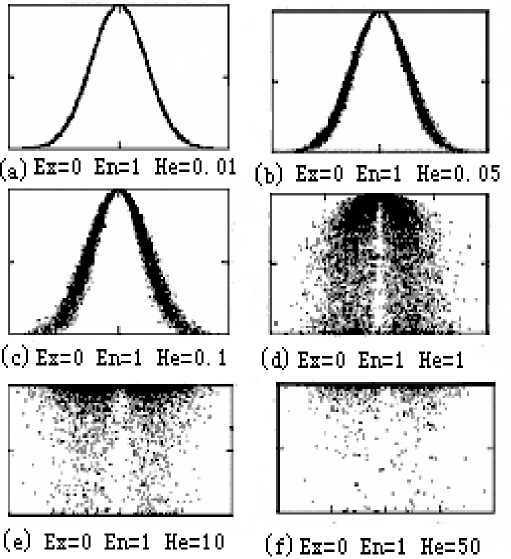
Figure 2. Cloud model changes with He
The normal cloud is the most important cloud model, because various branches of the social and natural sciences have proved the normal distribution’s universality. The equation of normal cloud curve:
(Ц - Ex) 2
-
MEC A ( µ ) = e 2En 2
Definition 4: A X, a variable of any inter-district of basic variable X, who’s Contribution to qualitative concept A is A C :
AC ~ Ц (х) * Ax/V2nEn
Obviously, all the elements total contribution C to the conceptual domain à is:
+∞ +∞ 2 2
∫ µ Ã(x) dx ∫ e - ( x - Ex ) /2 En dx
C =-∞
-∞
= 1
C = 1 Ex +∫ 3 µ En à ( x ) dx = 99.74%
Because 2 π En Ex - 3 En
,
for a qualitative knowledge, clearly, the expected curve is a normal curve. Elements do not fall into [Ex-3En, Ex-3En] can be ignored, because it has been proved that approximately 99.74% elements of model fall into the range of [Ex-3En, Ex-3En] by the mathematical characteristics of normal distribution.
-
B. Trapezoidal cloud model
Extending the normal cloud model to get trapezoidal cloud model, trapezoidal cloud model can be expressed by six values, they are the expected number: Ex 1 and Ex 2 , entropy: En1 and En 2 , hyper entropy: He 1 and He 2 .
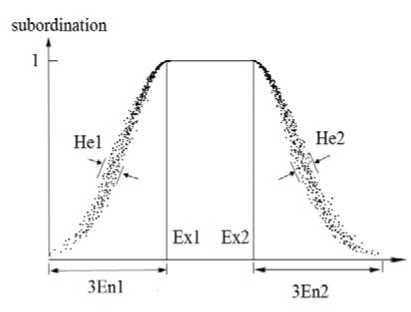
Figure 3. The digital features of Trapezoidal cloud model
Seen from fig.3, Trapezoidal cloud curve equations are determined by the expectation and the Entropy are following:
(x-Ex1)2
MEC a (x) = e 2Eni2 ( Ex 1-3 En1 <= x <= Ex 1 )
MEC a (x) = 1 ( ex1<=x<=EX2 )
(x-Ex2)2
MEC a (x) = e 2En22 ( Ex 2<= x <= Ex 2+3 En 2 )
Clearly, the left and the right half-cloud expectation curve is a normal curve.
It can complete the qualitative and quantitative transform more accurately, if there is a range belongs to the concept totally, then it can be expressed by the upper edge of Trapezoid, if only one value belongs to the concept totally, then the upper edge of Trapezoid degenerate to a point, trapezoidal cloud model also degenerated into the normal cloud model. He1 and He2 can have different values, and thus the concept of the border on behalf of different fuzzy situation, when the He1 and He2 all degenerate to 0, trapezoidal cloud model expressed a concept with accurate border subordination, when one of the He1 or He2 degenerate to 0, which expressed a concept with one accurate border subordination and one vague border subordination, so trapezoidal cloud model has a better generality.
Ш. Dividing Quantitative Data to Concepts Using Trapezoidal Cloud Model
-
A. Cloud Transform
Any function can be decomposed into cloud-based superposition with allowed error range, which is Cloud Transform. The equation is:
mm
g ( x ) * S c f ( x ) (0 < g ( x ) - S cf ( x ) < 8 )
j = 1 j = 1 (7)
g(x): data distribution function fj(x): cloud-based expectations function cj :coefficients
-
m: the number of superimposed cloud, ε: user-defined maximum error
From the concept of clouds: in the domain the element’s subordination to the concept has statistical and random properties. In addition, the high-frequency elements’ contributions to the concept are higher than the low-frequency elements. That is the reason to use probability density function of data distribution to get the concept set, so the concept division algorithms can be done.
According to the definition of cloud transform, the quantitative attribute’s domain dividing into m concepts can evolve to a problem to get answers from the formula: g ( x ) = ir c f i ( Ex 1 j , Ex 2 j , En 1 j , En 2 j He 1 A He 2 j ) + 8
j = 1 I
.e. to get Ex1 j , Ex2 j , En1 j , En2 j , He1 j , He2 j and c j for each cloud concept, the quantitative attribute domain is divided into a number of concepts by using cloud model, the data in each concept aggregate, and the data between different concepts separated [7][8].
-
B. Concept division algorithm
Cloud transform recover the data distribution concepts from a large number of property values, the conversion is from quantitative Data to qualitative concept, is a clustering problem essentially. Local peak of the histogram is that the data aggregation part, taking it as a concept center is reasonable, the higher the peak, indicating more data convergence there, deal with it with priority. The concept division algorithm is:
Algorithm 1: Concept division algorithm
Input: the domain of quantitative attributes that need the concept division, the overall error threshold ε, and the peak height error threshold εy, the length error εx between trapezoidal top edge and the minimum value.
Output: m concepts and the corresponding digital features of attribute i.
{
-
(1) Count the each possible values x of attribute i and get
the actual data distribution function g (x);
-
(2) j=0;
-
(3) Clouds= Ф; g’(x)=g(x);
-
(4) while max(g’(x))>ε
-
(5) Ex j =Find_Ex(g’(x));
-
(6) Ex1 j =search1(g’(x),ε y ,ε x );
-
(7) Ex2 j =search2(g’(x),ε y ,ε x );
-
(8) En1 j =Find_En(c j ,Ex1 j ,ε);
-
(9) En2 j =Find_En(c j ,Ex2 j ,ε);
-
(10) gj(x)=c j *Cloud(Ex 1 ,En1 j ,Ex2 j ,En2 j );
-
(11) g’(x)=g’(x)-g j (x);
-
(12) j=j+1;
-
(13) endwhile
-
(14) for j=0 to m-1 do
-
(15) Clouds(Ex1 j ,=Ex2 j ,En1 j ,En2 j ,He1 j ,He2 j )=
Calculate_He(g j (x), g’(x),Cloud(Ex1 j ,Ex2 j ,En1 j ,En2 j ));
-
(16) endfor
}
In Step 1, using statistical methods to get the actual data distribution function g(x);
Step 2, 3 does variable initialization;
Step 4 the division of the process is ended, if the error limit less than a given error;
Step 5 Search for the peak value of c j of property in the data distribution function g(x), and its corresponding value x is defined as the cloud model center (expectation);
Step 6, 7 search approximate horizon line near the peak (within the error limit threshold ε y ), if the width is greater than the minimum width of the threshold value ε x , where were identified as uniformly distributed, the two endpoints of the line are recorded as the trapezoidal top edge endpoints Ex1 j , Ex2 j ; otherwise get the trapezoidal top edge endpoints are equal to the peak point value Ex1 j =Ex2 j =Ex j , trapezoidal cloud degenerated into the normal cloud. Trapezoidal cloud height coefficient is the function value of the Ex1 j or Ex2 j ;
The step 8, 9 calculate cloud model entropy En1 j and En2 j to fit g (x) for the half-liter cloud with Ex1 j , halffalling cloud with Ex2 j . to get En1 j searching left area of the cloud model with Ex1 j , to get En2 j searching right area of the cloud model with Ex2 j , the entropy value increase from 0 step from the smaller value until the threshold ε is greater than the difference between the half-normal cloud value and distribution histogram value;
The step 10 calculates distribution function of the corresponding Trapezoidal;
Step 11 use the original data minus the known distribution function of trapezoidal cloud model data distribution to get the new data distribution function g'(x);
Repeat step 4 to 12 until the peak value is less than the error threshold;
Step 14, 15, 16 determine half hyper entropy of all cloud model with the residuals of distribution histogram.
W. Mining Association Rules From Concepts
Mapped From Quantitative Data
Dividing quantitative attributes into several concepts using concept division algorithm, mapping the attributes data to the corresponding concept, sometimes, one attribute value may be mapped to different concepts, then mapping it to the concept that the attribute data has the largest subordination.
-
C. Cloud Generator
Cloud generation algorithms can be achieved using the software, and also can be implemented by firmware, algorithms generated cloud droplets by the three digital characteristics of cloud are called Cloud Generator, also known as the basic cloud generator, it is the basis for uncertainty reasoning, it produces a cloud droplets which show some forms distribution[9][10][11]. Fig.4 Schematic diagram of a forward cloud generator.
|
Ex ------ |
||
|
En ------ He ------ |
CG |
Drop (x, y) |
Figure 4. The generator of the forward cloud model
Algorithm 2: forward cloud generator algorithm
/ * Input: the expectations of the cloud forecast model Ex, entropy En and hyper entropy He
Output: predicted values X = (x1, x2 ... xi ..., xn) * /
{
-
(1) Produce normal random entropy En' with expectation En, MSE He;
-
(2) produce a normal random number x with expectation Ex, MSE E n‘;
( x - Ex ) 2
-
(3) Calculate y = e 2 En 2
-
(4) Take (x, y) as a forecast data;
-
(5) Repeat steps 1 through 4, until a required number of forecasts data produced.
}
The step 2 in forward cloud generator algorithm, 99.74% of the forecast data will fall (Ex-3En, Ex +3En) range from the statistical knowledge; so that you can predict the precise degree of reality to fit the data well. The predictive value of y is essentially the membership degree of x under this model, it is just a reference value, if the actual prediction system does not require, dispense it, of course it can be used for membership degree analysis.
Random number generation method is the key to the whole algorithm. Almost all programming languages have a function that generated uniform random number between [0, 1], according central limit theorem [12][13], the way generate normal random number using uniform random function is as follows:
Algorithm 3: Algorithm for generating normal random numbers
/* Input: Ex, En
Output: the random number x in accordance with the normal distribution N (Ex, En) */
{
-
(1) generate 6 uniform random number between [0,1],
6 sum = ^ rand i calculate the sum of them: i =1
/ / Randi is uniform random number between [0,1]
-
(2) generate random number x with the standard normal distribution N (0,1) according to the central limit theorem:
x = sum-6
-
(3) transform x to meet the normal distribution N (Ex, En)
-
x: x = Ex + x*En
ц i = exp
( x - Ex ) 2 2 En i 2
-
(3) Let (x, μi) be a droplet 。
}
Algorithm 5: Y condition cloud generator algorithm
{
-
(1) Eni = G(En, He)
// produce a normal random number Eni with
expectation En, MSE he;
-
(2) Calculate x i = Ex ± V-2ln( " )En'
(4) return x
-
(3) Let (xi,μ) be a droplet.
}
Cloud can be generated according to different conditions, given the value of x in the domain are called X condition cloud generator (see Fig.5), given the degree membership a particular value are called Y condition cloud generator (see Fig.6 b). X condition cloud generator generated cloud droplets in a same vertical line, the abscissa values are x, the vertical axis were the
}
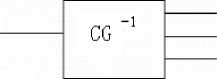
To get the three digital characteristics of the qualitative value (Ex, En, He) with a normal distribution of cloud droplets as a set of samples (xi, μi), are called backward cloud generator, shown in Fig.7, the general said is CG -1. Forward and backward cloud generator c combined to achieve qualitative and quantitative conversion at any time.
probability distribution of membership values. Y condition cloud generator generated cloud droplets in the same horizontal line, and divided into two groups by the expected Ex, the membership value of the vertical axis are μ, the two groups of the abscissa values were, respectively, the probability distributed. The two conditions cloud generator models are basics of uncertainty reasoning.
drop(x1?yi)
Ex En He
Figure 7. The backward cloud generator
Ex En He

dropCx.yi)
Algorithm 6: Algorithm of backward cloud generator {
-
(1) Ex = mean(xi)
-
(2) En = stdev(xi)
Figure 5. The generator of the X condition-cloud
Eni' =
- (xi - Ex) 2
2ln( μ i )
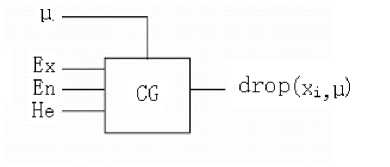
Figure 6. The generator of the Y condition-cloud
he = stedv(En i )
Algorithm 4: X condition cloud generator algorithm
{
-
(1) Eni = G(En, He)
// produce a normal random number Eni with expectation En, MSE he;
-
(2) Calculate
}
The Formula to calculate the mean and standard deviation are as follows:
mean (xi) = (x1 + x2 + ...... xn) / n
stdev (xi) = sqrt (((x1-mean (xi)) 2 + (x2-mean (xi)) 2 + ......+ (xi-mean (xi)) 2) / (n-1))
in the Boolean association rules I={i1,i2 , … , im}, the original meaning of ii is to buy not to buy tea, through the concept division algorithm a quantitative attribute value is extended to buy a lot of tea, buy some tea, buy little tea. Of course, every transaction belong to one of these situations only, problems can be solved by the Boolean association rules mining, using the famous Apriori frequent item set algorithm and the non-frequent
-
item sets of FP-tree algorithm can carry out association rules mining[14][15].
-
V . Experimental Analysis
Take two typical supermarket retail food rice and millet as example, the majority data scattered between 0.5-5kg, Extract 20000 transaction records randomly as experiment data, use concept division algorithm with error threshold ε=0. 5, and the peak height error threshold εy=0.03, the length threshold error between trapezoidal top edge εx =0.03. Then every transaction record data are divided into buy a lot of rice (millet), buy some rice (millet), buy little rice (millet), the number of the concepts can be more or less according to the threshold values.
Using the famous Apriori algorithm to mine the database with the concepts mapped from the quantitative data, MinSup=30%, MinConf=80%. We get the following results.
-
< a lot of rice> ⇒ ,
-
< some rice> ⇒
, -
4. Conclusion
to improve its accuracy further, reduce error thresholds, and lower the minimum support for association rules and, but this will take more time, the minimum support degree and the minimum confidence degree shouldn’t too small, so do the error thresholds, if so, the association rules does not make sense, the minimum support degree and the minimum confidence degree are given by the experts in the field.
In this paper, we propose a new method to mining association rules from quantitative data based on the trapezoidal cloud model, which first take the original data distribution in the database into account, and then use the trapezoidal cloud model which combines fuzziness, randomness and uncertainty organically, and transforms the quantitative concept and qualitative data each other, in the conversion take account of the basic characteristics of human behavior fully, because of the presence of randomness, the same quantity data may belongs to different concept. for the people’s age falls into the interval (18,35), we all think that he was young, but the 16-17 year-olds should be assigned to the concept “young” or not, that different people may have different views, even the same individuals may have different views at different times.
concept division algorithm Based the trapezoidal cloud model take the above situation into account, not all the data have the above characteristics, only the elements on the conceptual border have this randomness, and the randomness can not affect the whole concept, the elements fall into the interval (Ex1, Ex2) fall into its own concept, which are their certainty. Therefore, this method can simulate the phenomena of human society better. The quantitative data are change into Boolean data in a reasonable manner, use sophisticated Boolean association rule mining algorithm, and we can achieve quantitative association rules. Using the quantitative data mining method can excavate more knowledge from database to support decision-making better.
References Application of Cloud Theory in Association Rules
- J. Han, and M. Kamber, Data Mining Concepts and Techniques, 2nd ed., Morgan Kaufmann Publishers: 2006, pp.98-112.
- Mehmed Kantardzic, Datamining Concepts, Models, Methods and Algorithms, Beijing: Tsinghua University Press, 2009.
- Lu Qiu-gen, Fuzzy clustering algorithm and implementation, Computer Knowledge and Technology, 2008, vol.3 (27) , pp.1987-1990.
- Liao Zhian, Data Fuzzy processing, Journal of Ezhou University, 2005, vol. 12(6), pp.49-51.
- Li De-yi and Liu Chang-yu, Discussion of the universal nature on the normal cloud model. China Engineering Science, 2004, vol. 6, pp. 28-33.
- Liu Chang-Yu, Li Deyi, Du Yi, Statistical analysis of normal cloud model, Information and Control, in Chinese, 2005, 34 (2), pp. 236-239
- Li Deyi, Meng Haijun, Shi Xuemei, Membership cloud and membership cloud generator, Computer Research and Development, in Chinese, 1995, 32 (6) pp. 15-20
- Li Deyi. Triple inverted pendulum control and dynamic balance based on clouds model, China Engineering Science, in Chinese, 1999, l (2), pp. 41-46
- Li Deyi, Du Yi, Uncertainty Artificial Intelligence, Beijing: National Defense Industry Press, 2005
- Lu Huijun, Wang Ye, Li Deyi, Reverse cloud application in the qualitative evaluation, Journal of Computers, 2003, 26 (8) pp. 1009-1014
- Fan Zhoutian, Fuzzy Matrix Theory and Applications, Beijing: Science Press, 2006.
- LuJianjiang, Zhang Yanlin, Song Zilin, Fuzzy Association Rules and Application, Beijing: Science Press, 2008.
- Wang Hu, Mao Wenting, telecom customer behavior study based on cloud model and association rules, Journal of Wuhan University of Technology (Information and Management Engineering), 2009, vol.31 (5), pp.77-79.
- Yan Yuejin, Li Zhoujun, Chen Huowang, Efficient maximal frequent itemsets Mining Based on FP-Tree, Journal of Software, 2005, vol.16(2), pp.215-222.
- J Han, J Pei, Y Yin, Mining Frequent Patterns without Candidate Generation A Frequent Pattern Tree Approach, data Mining and knowledge discovery, 2004, vol. 8, pp.53-87.
