Application of Data Mining in the Classification of Historical Monument Places

Author: Siddu P. Algur, Prashant Bhat, P.G. Sunitha Hiremath
Journal: International Journal of Intelligent Systems and Applications(IJISA) @ijisa
Article in issue: 8 vol.8, 2016.
Free access
The economic development and promotion of a country or region is depends on several facts such as- tourism, industries, transport, technology, GDP etc. The Government of the country is responsible to facilitate the opportunities to develop tourism, technology, transport etc. In view of this, we look into the Department of Tourism to predict and classify the number of tourists visiting historical Indian monuments such as Taj- Mahal, Agra, and Ajanta etc.. The data set is obtained from the Indian Tourist Statistics which contains year wise statistics of visitors to historical monuments places. A survey undertaken every year by the government is preprocessed to fill out the possible missing values, and normalize inconsistent data. Various classification techniques under Decision Tree approach such as- Random Tree, REPTree, Random Forest and J48 algorithms are applied to classify the historical monuments places. Performance evaluation measures of the classification models are analyzed and compared as a step in the process of knowledge discovery.
Tourist Classification, Random Tree, Random Forest, J48 Algorithm, REP Tree
Short address: https://sciup.org/15010849
IDR: 15010849
Text of the scientific article Application of Data Mining in the Classification of Historical Monument Places
Published Online August 2016 in MECS
-
I. Introduction
Data Mining is a method of retrieving formerly unknown, suitable, potentional useful and unknown patterns from large data sets (Connolly, 1999). Nowadays the amount of data stored in Government databases is increasing rapidly. In order to get required benefits from such large data and to find hidden relationships between variables using different data mining techniques developed and used (Han and Kamber, 2006). There are increasing research interests in using data mining in different Government sectors such as Tourism, Health, Travels, Army, and Education etc.
Tourism in India is economically significant and is increasing rapidly. The measured that in the year 2012, the tourism produced 6.4 trillion or 6.6% of the nation's GDP [1]. It supported 39.5 million employments, 7.7% of its total employment. The sector is predicted to grow at an average annual rate of 7.9% till 2023 making India the third fastest growing tourism destination over the next decade. India has a large medical tourism sector which is expected to grow at an estimated rate of 30% annually to reach about ₹95 billion by 2015 [1].
About 22.57 million tourists arrived in India in 2014, compared to 19.95 million in 2013. This ranks India as the 38th country in the world in terms of foreign tourist arrivals. Domestic tourist visits to all states and Union Territories numbered 1,036.35 million in 2012, an increase of 16.5% from 2011. In 2014, Tamil Nadu, Maharashtra and Uttar Pradesh were the most popular states for tourists. Chennai, Delhi, Mumbai and Agra have been the four most visited cities of India by foreign tourists during the year 2011. Worldwide, Chennai is ranked 38 by the number of foreign tourists, while Mumbai is ranked at 50, Delhi at 52 and Agra at 66 and Kolkata at 99. The Knowledge of approximate number of visitors to a place of historical monuments can help the Government to provide adequate resources. By looking into these statistics, to predict the number of visitors for the next year is helpful for the Government to provide adequate resources such as halting, waters, and some other tourist friendly resources in the historical monuments places to increase the number of visitors every year, thereby to get increase in the overall GDP of the country.
In this work, a dataset is taken which contains the information of number of visitors to 55 historical monuments places from the year 2002 to 2013. The different data mining strategies such as preprocessing, building the classification model and testing the built models are effectively undertaken for the considered tourist statistical data to classify the historical monuments places based on their number of visitors. The rest of the paper is organized as follows. The section 2 provides some related works regarding Tourism Research, the section 3 provides proposed model which contains different data mining strategies to classify 55 historical monuments places, and the section 4 represents classification results and analysis. Finally, the section 5 represents conclusion and future enhancements.
-
II. Related Works
This section represents some related prior works on Tourism research based on Data Mining techniques. The authors [2] Jianhong et al. described how to design and implement the methods to identify the spatiotemporal movement patterns and across patterns between various categories of tourist and their spatio-temporal movement patterns. The frequent spatio-temporal movement sequence in the case study was extracted from the database. The major finding of [2] was to identify and study of spatio temporal pattern of visit of tourists in different day times for different places.
The authors Rob Law, et.al, [3] have reviewed various tourist forecasting research papers and found that, the application of Data Mining techniques are well suited for the tourism field. The authors [3] also discussed research gap and suggested for future research work in tourism forecasting. The work of [3] made contribution for academic researchers, industrial practitioners, and official policy makers by drawing attention to the importance and necessity of integrating Data Mining and Tourism forecasting fields.
The authors S. Cankurt and A. Subasi [4] proposed a machine learning model which is deterministic generation of auxiliary variables, and contains the seasonal, cyclic and trend components of the time series associated with tourism demand. To test the contribution of the deterministically generated auxiliary variables, the authors [4] have employed multilayer preceptor (MLP) regression, and support vector regression (SVR) models. These models are used to make multivariate tourism forecasting for Turkey respected to two data sets: raw data set and data set with deterministically generated auxiliary variables. The forecasting performances were compared with respect to these two data two sets. The entropy evaluation measures – relative absolute error (RAE) and root relative squared error (RRSE) of the proposed machine learning models have achieved significantly better forecasting accuracy.
The authors Chang-Jui Lin, et.al,[5] have studied three types of forecast models and ARIMA, ANN, and MARS, were used for the analysis. The aim of [5] was to find out the most accurate model for forecasting tourism demand. The results of this study exposed that the MAPE of the ARIMA forecast model is less than the other two models. ARIMA model showed the better forecasting ability. The MAPE of MARS found the highest values indicating that its forecasting ability is the worst. The MAPE of ANN was between the other two models, indicating that its forecasting ability is normal.
The authors Haiyan Song and Gang Li [6] have reviewed and studied on tourism demand modeling and forecasting since 2000. The key finding of their review was, the methods used in analyzing and forecasting the demand for tourism. In addition to the most popular time series and econometric models, a number of new techniques have emerged in the literature. However, as far as the forecasting accuracy is concerned, the study showed that, there is no single model that consistently outperforms other models in all situations. Also, this study identified some new research directions, which include improving the forecasting accuracy through forecast combination; integrating both qualitative and quantitative forecasting approaches, tourism cycles and seasonality analysis, events’ impact assessment and risk forecasting.
The authors Chang-Jui Lin and Tian-Shyug Lee [7] have developed tourism demand econometric models based on the monthly data of visiting of tourists to Taiwan and had adopt Multivariate Adaptive Regression Splines (MARS), Artificial Neural Network (ANN) and Support Vector Regression (SVR), MARS, ANN and SVR to develop forecast models. The forecast results of built models were compared. The results showed that SVR model is the optimal model, with a mean error rate of 3.61%, ANN model is the sub-optimal model, with a mean error rate of 7.08%, and MARS is the worst model, with a mean error rate of 11.26%.
In concerned with the research in tourism, the author Erika kulcsár [8] analyzed the measure between GDP dependent variable in the sector of hotels and restaurants and the some other independent variables such as-overnight stays in the establishments of touristic reception, arrivals in the establishments of touristic reception and investments in hotels and restaurants sector in the period of 1995-2007. By using the multiple regression analysis technique, the paper [8] found that investments and tourist arrivals are significant predictors for the GDP dependent variable. Based on these results, the author [8] found those components of the marketing mix, which would contribute to the positive development of tourist arrivals in the establishments of touristic reception.
The authors Panayiotis G.Curtis and Dimitris X. Kokotos [9] surveyed the managements of the various hotels and analyzed the survey data with the use of the Decision Tree tool. The issue of competitiveness of the tourism product was assessed. The development of alternative forms of tourism was proposed as a means of improving competitiveness and restoring sustainability in the tourism sector.
-
III. Proposed Method
-
3.1 Data Collection Process
The dataset of Historical Monuments are collected from the year 2002 to 2013 from Indian Historical Tourism Statistics. The dataset contains the information of 55 historical monument places such as Taj Mahal, Agra, Ajanta, Ellora, Elephanta etc., and the number of visitors of the years from 2002 to 2013. The schematic structure of the dataset is represented in Fig.2.
This section describes the detailed method of the proposed work. The various steps in the proposed methodology are shown in Fig.1. The proposed system model consists of the following components: Data Collection Process, Data Refinement process, Prediction and Classification Process, and finally, Result Analysis and KDD process. The function of each component is described in the following subsections.

Fig.1. Proposed System Model
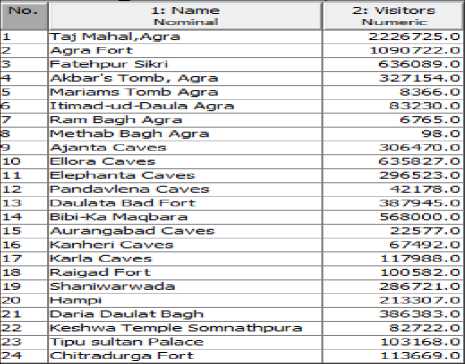
Fig.2. Schematic Structure of the Dataset
In Data Mining strategies the data preprocessing step decides the quality of the result. Hence effective preprocessing is needed to make the dataset consistent for the experiment. The Historical Monument dataset contains missing values in the numeric attribute ‘Visitors’. The details of the missing values in the dataset are represented in the Table 1.
Table 1. Missing values details in the dataset
Selected attribute
Name: Visitors Missing: 66 (9%)
Statistic
Minimum Maximum Mean
StdDev
Type: Numeric
Distinct: 640 Unique: 633(89%)
Value
278999.035
497052.498
To handle the missing values present in the dataset, we plot the normal distribution of the numeric attribute ‘Visitors’ and is shown in Fig. 3.
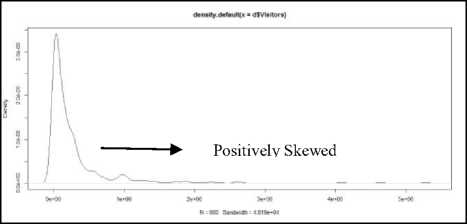
Fig.3. Normal distribution of ‘Visitors’.
From the Fig.3, it is observed that, the normal distribution is positively skewed. Since, the normal distribution is positively skewed, we should employ median of the numeric attribute to fill the missing values. The numeric attribute is sorted and found the value 119145 as median. The median value 119145 is replaced with the missing values. The data are then stored in CSV or ARFF file format for effective experimental process. The each Historical Monument place is assigned with one of the class label {Low, Medium, High} based on their respective visitors statistics from the year 2002 to 2013.
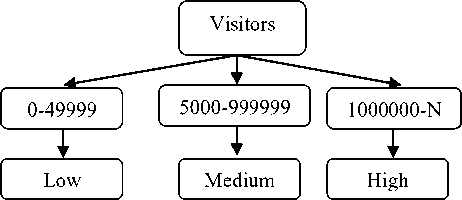
Fig.4. Concept Hierarchy for attribute ‘Visitors’
The discretization method is used to assign conceptual class labels for Indian Historical Monument Places based on the number of visitors. Firstly, the raw values of numeric attribute ‘Visitors’ is replaced by the interval labels 0-50000, 50000-1000000, and 1000000-N, where N>1000000 respectively. Then the conceptual labels ‘Low’, ‘Medium’ and ‘High’ are corresponds to the above intervals respectively. The labels are recursively organized into higher-level concepts which results in a concept hierarchy for the numeric attribute ‘Visitors’. The Fig.4 represents concept hierarchy for the numeric attribute ‘Visitors’.
The Fig.5 represents a part (structure) of refined dataset after preprocessing and class label assignment.
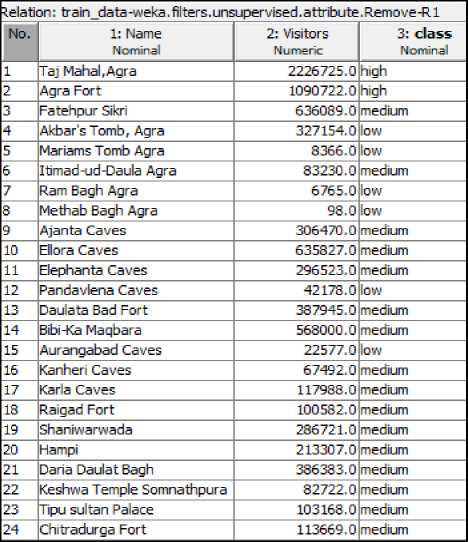
Fig.5. Schematic structure part of the Historical Monument dataset after preprocessing
-
3.2 Classification Process
The following four classification models are used in the proposed experiment.
-
i) Random Tree (RT) Classification Model
-
ii) REPTree Classification Model
-
iii) Random Forest Classification Model
-
iv) J48 Classification Model
-
3.2.1 Random Tree Classification Model
The functionality of each cluster model is discussed as follows.
The Random Decision Tree algorithm builds several decision trees randomly. The Random Tree Classification Model is built using WEKA and a part of the built tree is extracted and represented in the form of classification rules as shown in Table 2. When constructing each tree, the algorithm picks a "remaining" feature randomly at each node expansion without any purity function check such as- gini index, information gain etc. A categorical feature such as ‘High’ is considered "remaining" if the same categorical feature of ‘High’ has not been chosen before in a specific decision path starting from the root of tree to the present node. . Once a categorical feature such as ‘High’ is taken, it is useless to choose it once more on the same decision path because every pattern in the same path will have the same value (either High, Medium or Low). On the other hand, a continuous feature such as ‘Visitors’ can be selected more than once in the same decision path. Each moment the continuous feature is selected, a random threshold is chosen.
A tree stops growing any deeper if one of the following conditions is met:
-
a) There are no more examples to split in the current node or a node becomes empty
-
b) The depth of tree goes beyond some limitations.
-
3.2.2 . REPTree Classification Model
-
3.2.3 Random Forest Classification Model
-
3.2.4 J48 Classification Model
-
3.3 Result Analysis and KDD process
The WEKA supports REPTree Classification Models which is well known as fast decision tree learner. The REPTree classifier is constructed using WEKA and a part of the built tree is extracted and represented in the form of classification rules as shown in Table 3.
The REPTree Classification Model builds a decision/regression tree using information gain/variance and prunes it using reduced-error pruning (with back fitting). The procedure to obtain information gain of each attribute is discussed in our previous work [10]. The REPTree Classification Model sorts values for numeric attributes only one time.
Random Forest classification model constructs many classification trees. For the classification of a new instance from an input vector space (dataset), put the input vector down each of the trees in the forest. Each tree will gives a classification (votes). The forest chooses the classification having the majority votes among over all the trees generated the forest. The WEKA supports Random Forest classification technique and constructs a forest of random trees.
J48 is bespoke version of C4.5 classification algorithm. The J48 algorithm generates a classification-decision tree for the Historical Monument data-set by recursive partitioning the tuples. The J48 Tree classifier is built using WEKA and a part of the built tree is extracted and represented in the form of classification rules as shown in Table 4. The decision tree is grown using depth-first strategy. The algorithm considers all the possible tests that can split the Historical Monument data set and selects a test that gives the best information gain. For each Historical Monument numeric attribute values, binary tests involving every distinct values of the attribute are considered. In order to gather the information gain of all these binary tests efficiently, the information gain of the binary partition point based on each distinct values are calculated and sub trees are formed accordingly. This process is repeated for each attributes considered for classification.
The classification results of all the four built models will be analyzed effectively using different performance evaluation metrics such as- Correctly Classified instances, incorrectly classified instances, TP rate, FP rate, Precision, Recall and F-Score etc. The results will be compared as a step in the process of knowledge discovery.
-
Tab le 2. Random Tree Classification Rules
Table 2: Random Tree Classification Rules
Name = Taj Mahal,Agra
| Visitors < 1804647 : medium (1/0)
| Visitors >= 1804647 : high (11/0)
Name = Agra Fort
| Visitors < 996229 : medium (3/0)
| Visitors >= 996229 : high (9/0)
Name = Fatehpur Sikri : medium (12/0)
Name = Akbar's Tomb, Agra
| Visitors < 316046 : medium (8/0)
| Visitors >= 316046
| | Visitors < 368261 : low (1/0)
| | Visitors >= 368261 : medium (3/0)
Name = Mariams Tomb Agra : low (12/0)
Name = Itimad-ud-Daula Agra : medium (12/0)
Name = Ram Bagh Agra
| Visitors < 33482.5 : low (8/0)
| Visitors >= 33482.5
| | Visitors < 50022
| | | Visitors < 38288 : medium (1/0)
| | | Visitors >= 38288 : low (1/0)
| | Visitors >= 50022 : medium (2/0)
Name = Methab Bagh Agra
| Visitors < 42988.5
| | Visitors < 13864 : low (6/0)
| | Visitors >= 13864
| | | Visitors < 19172 : medium (1/0)
| | | Visitors >= 19172 : low (2/0)
| Visitors >= 42988.5 : medium (3/0)
Name = Ajanta Caves : medium (12/0)
Name = Ellora Caves
| Visitors < 963136.5 : medium (9/0)
| Visitors >= 963136.5 : high (3/0)
Name = Elephanta Caves : medium (12/0)
Name = Pandavlena Caves
| Visitors < 52869.5 : low (4/0)
| Visitors >= 52869.5 : medium (8/0)
Name = Daulata Bad Fort
| Visitors < 126218 : low (1/0)
| Visitors >= 126218 : medium (11/0)
Name = Bibi-Ka Maqbara
| Visitors < 994804 : medium (8/0)
| Visitors >= 994804 : high (4/0)
Name = Aurangabad Caves : low (12/0)
Name = Kanheri Caves
-
Tab le 3. REPTree Classification Rules
Table 3: REPTree Classification Rules
Name = Taj Mahal,Agra : high (6/1) [6/0]
Name = Agra Fort
| Visitors < 996229 : medium (2/0) [1/0]
| Visitors >= 996229 : high (8/0) [1/0]
Name = Fatehpur Sikri : medium (7/0) [5/0]
Name = Akbar's Tomb, Agra : medium (9/1) [3/0]
Name = Mariams Tomb Agra : low (8/0) [4/0]
Name = Itimad-ud-Daula Agra : medium (11/0) [1/0]
Name = Ram Bagh Agra : low (4/1) [8/2]
Name = Methab Bagh Agra : low (10/4) [2/0]
Name = Ajanta Caves : medium (7/0) [5/0]
Name = Ellora Caves
| Visitors < 963136.5 : medium (4/0) [5/0]
| Visitors >= 963136.5 : high (2/0) [1/0]
Name = Elephanta Caves : medium (10/0) [2/0]
Name = Pandavlena Caves : medium (9/4) [3/0]
Name = Daulata Bad Fort : medium (9/1) [3/0]
Name = Bibi-Ka Maqbara
| Visitors < 994804 : medium (8/0) [0/0]
| Visitors >= 994804 : high (3/0) [1/0]
Name = Aurangabad Caves : low (4/0) [8/0]
Name = Kanheri Caves
| Visitors < 61664 : low (3/0) [1/0]
| Visitors >= 61664 : medium (4/0) [4/1]
Name = Karla Caves : medium (8/0) [4/0]
Name = Raigad Fort : medium (7/0) [5/0]
Name = Shaniwarwada : medium (5/0) [7/0]
Name = Hampi : medium (9/0) [3/0]
Name = Daria Daulat Bagh : medium (9/0) [3/0]
Name = Keshwa Temple Somnathpura : medium (5/0) [7/0]
Name = Tipu sultan Palace : medium (4/0) [8/0]
Name = Chitradurga Fort : medium (6/0) [6/0]
Name = Bellary Fort : low (9/0) [3/0]
Name = Khajuraho Monuments : medium (8/0) [4/0]
Name = Shahi Quila Burhanpur
| Visitors < 44868.5 : low (4/0) [2/0]
| Visitors >= 44868.5 : medium (6/0) [0/0]
Name = Bagh Caves : low (7/0) [5/0]
Name = Royal Complex Mandu : medium (9/0) [3/0]
Name = Ranirupavathi Museum : medium (7/0) [4/0]
Name = Hoshang Shahs Tomb
| Visitors < 68404 : low (4/0) [1/0]
| Visitors >= 68404 : medium (5/0) [1/0]
Name = Stupa Sanchi Monument : medium (7/5) [5/1]
Name = Bhojshala Dharmoula Mosque : low (8/0) [3/0]
Name = Gwalior Musem : medium (8/1) [4/0]
Name = Buddist Monuments Sanchi : medium (9/0) [3/0]
-
Tab le 4. J48 pruned tree Classification Rules
Table 4: J48 pruned tree Classification Rules
Name = Taj Mahal,Agra: high (12.0/1.0)
Name = Agra Fort
| Visitors <= 989804: medium (3.0)
| Visitors > 989804: high (9.0)
Name = Fatehpur Sikri: medium (12.0)
Name = Akbar's Tomb, Agra: medium (12.0/1.0)
Name = Mariams Tomb Agra: low (12.0)
Name = Itimad-ud-Daula Agra: medium (12.0)
Name = Ram Bagh Agra
| Visitors <= 33281: low (8.0)
| Visitors > 33281: medium (4.0/1.0)
Name = Methab Bagh Agra
| Visitors <= 42925: low (9.0/1.0)
| Visitors > 42925: medium (3.0)
Name = Ajanta Caves: medium (12.0)
Name = Ellora Caves
| Visitors <= 955677: medium (9.0)
| Visitors > 955677: high (3.0)
Name = Elephanta Caves: medium (12.0)
Name = Pandavlena Caves
| Visitors <= 52621: low (4.0)
| Visitors > 52621: medium (8.0)
Name = Daulata Bad Fort: medium (12.0/1.0)
Name = Bibi-Ka Maqbara
| Visitors <= 989804: medium (8.0)
| Visitors > 989804: high (4.0)
Name = Aurangabad Caves: low (12.0) Name = Kanheri Caves
| Visitors <= 65358: low (5.0) | Visitors > 65358: medium (7.0) Name = Karla Caves: medium (12.0) Name = Raigad Fort: medium (12.0) Name = Shaniwarwada: medium (12.0) Name = Hampi: medium (12.0)
Name = Daria Daulat Bagh: medium (12.0)
Name = Keshwa Temple Somnathpura: medium (12.0) Name = Tipu sultan Palace: medium (12.0)
Name = Chitradurga Fort: medium (12.0)
Name = Bellary Fort: low (12.0)
Name = Khajuraho Monuments: medium (12.0) Name = Shahi Quila Burhanpur | Visitors <= 46240: low (6.0) | Visitors > 46240: medium (6.0)
Name = Bagh Caves: low (12.0)
Name = Royal Complex Mandu: medium (12.0) Name = Ranirupavathi Museum: medium (11.0) Name = Hoshang Shahs Tomb | Visitors <= 68337: low (5.0) | Visitors > 68337: medium (6.0)
Name = Stupa Sanchi Monument : medium (12.0/6.0) Name = Bhojshala Dharmoula Mosque: low (11.0)
-
IV. Results and Discussions
The Random Tree, REPTree, J48 and Random Forest Classification Models are built using 10 cross validation folds. To test the considered classification models for the experiment, 656 Historical Monument instances are taken and preprocessed using WEKA tool. The Table 5 represents result obtained by the Random Tree, REPTree, J48 and Random Forest classification models.
The results describes performance evaluation metrics such as- correctly classified instances, incorrectly classified instances, TP rate, FP rate, Precision, Recall, F-Score. Out of 656 test instances, 626 tuples are correctly classified and 30 instances are incorrectly classified by the Random Tree Classification Model with 10 cross validation fold. The performance of the Random Tree Classification Model is found good with 95% accuracy. Similarly, out of 656 test instances, 604 tuples are correctly classified and 52 instances are incorrectly classified by the REPTree Classification Model. The efficiency of the REPTree Classification Model is found 92% with 10 cross validation method.
The same test set is given to the Random Forest Classification Model as an input. The Random Forest Classification Model performed well on the test instances and exhibits 95% efficiency. 627 instances are correctly classified and 29 instances are incorrectly classified by the Random Forest Classification Model.
The performance of J48 Classification Model is studied and tested for the test dataset which was used to test the other classification models. The classification performance is found good with 95% accuracy. It is observed from the experimental result that, there are minor differences in the performance evaluation metrics of Random Tree, Random Forest and J48 Classification Models. But the the performance of REPTree
Classification Model reveals less efficiency as compared to remaining Classification Models.
To study TP rate and FP rate of all the four Classification Models in depth, the experimental result is represented in the form of confusion matrices. The Table 6 represents confusion matrices obtained by the results of Random Tree and REPTree Classification Models and the confusion matrices obtained by the results of Random Forest and J48 Classification Models. In the confusion matrices, the column ‘a’ and row ‘a’ corresponds to the class label ‘High’ and representing the Historical Monument places which are having more than 10,00,000 visitors per year. The column ‘b’ and row ‘b’ corresponds to the class label ‘Medium’ and representing the Historical Monument places which are having more than 50,000 and less than 10, 00,000 visitors per year and finally, column ‘c’ and row ‘c’ corresponds to the class label ‘Low’ and representing the Historical Monument places which are having less than 50,000 visitors per year.
There are 39 Historical Monument places which are recognized with the class label ‘High’, 389 places which are recognized with the class label ‘Medium’, and 228 places which are recognized with the class label ‘Low’. By looking at the confusion matrices as shown in Table 5 and 6, all the four classification models have more error rate (FP rate) while predicting the class label ‘Medium’. The reason could be- the class label ‘Medium’ has large number of tuples/instance as compared to the remaining class labels.
During the experiment, the Random Tree, Random Forest and J48 Classification Models reveal same characteristics to classify Historical Monument places. Three Historical Monument places which are belongs to the class label ‘High’ were wrongly classified and assigned to ‘Medium’ class label by the Random Tree, Random Forest and J48 Classification Models whereas 9 Historical Monument places were wrongly classified as ‘Medium’ by the REPTree Classification Model.
While classifying the Historical Monument places which are belongs to the class label ‘Medium’, 4 Historical Monument places were wrongly classified and assigned to the class label ‘High’, by the Random Tree, Random Forest, J48 Classification Models and 7 Historical Monument places were wrongly classified and assigned to the class label ‘High’, by the REPTree Classification Model. 11 Historical Monument places were misclassified as ‘Low’ which are originally belongs to the class label ‘Medium’ by the Random Tree, Random Forest, J48 Classification Models whereas 17 Historical Monument places were wrongly classified and assigned to the class label ‘Low’, by the REPTree Classification Model.
In the classification of Historical Monument places which are belongs to the class label ‘Low’, 216 places were correctly classified and 12 places were wrongly classified as ‘Medium’ by the Random Tree and J48 Classification Models. The Random Forest Classification Model reveal better performance than the Random Tree and J48 Classification Models; 217 Historical Monument places were correctly classified and 11 places were misclassified as ‘Medium’. The performance of REPTree Classification Model is less as compared to other classification models where 19 Historical Monument places which are originally belongs to the class ‘Low’ were incorrectly classified and assigned to the class label ‘Medium’. The classifier errors and correctly classified instances are shown in the Fig. 6 and Fig.7 respectively.
Table 5. Result obtained by the Random Tree, REPTree, J48 and Random Forest classification models
|
Sl.No |
Classification Models |
Actual Data |
Experimental Results |
TP |
FP |
Precision |
Recall |
F-Score |
|
|
Correctly Classified |
Incorrectly Classified |
||||||||
|
1 |
Random Tree |
656 |
626 |
30 |
0.95 |
0.04 |
0.95 |
0.95 |
0.95 |
|
2 |
REPTree |
656 |
604 |
52 |
0.92 |
0.07 |
0.92 |
0.92 |
0.92 |
|
3 |
Random Forest |
656 |
627 |
29 |
0.95 |
0.04 |
0.95 |
0.95 |
0.95 |
|
4 |
J48 Tree |
656 |
625 |
31 |
0.95 |
0.04 |
0.95 |
0.95 |
0.95 |
Table 6. Confusion Matrix of Random Tree and REPTree Classification Models
|
Confusion Matrix |
|
Random Tree ClassificationModel REfTree Classification Model |
|
---C onfusion Mat rix ---C onfusion Matrix--- |
|
f ц b c <-Classified as a b c <-Classified as |
|
36 3 0 I a=High 30 9 0 I a=High |
|
4 374 11 | b=Medium 7 365 17 | b=Medium |
|
0 12 216 1 c=Low 0 19 209 1 c=Low |
|
S----------------------------------------■---------------------------------------- |
|
Confusion Matrix |
|
J48 ClassificationModel RandomForest Classification Model |
|
---C onfusion Matiix =Confusion Matrix--- |
|
a b c <-Classifiedas a b c <-Clas$ifiedas |
|
36 3 0 1 a=High 36 3 0 1 a=High |
|
4 373 12 | b=Medium 4 374 11 | b=Medium |
|
0 12 216 1 c=Low __________ | 0 11 217 | c=Low __________ |
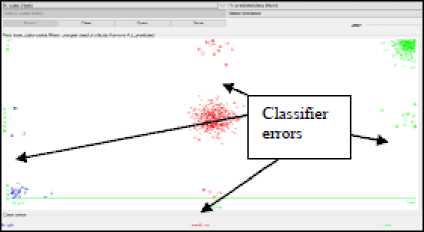
Fig.6. Classifier Errors
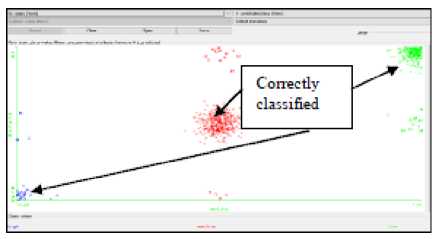
Fig.7. Correctly Classified Instances
V. Conclusion and Future Work
In this work, an attempt is made to classify 55 Historical Monument places based on their number of visitors from year 2002 to 2013. The Historical Monument places were preprocessed and assigned conceptual class labels (High, Medium, and Low) according to the number of visitors in each year. In the proposed classification experiment we used four standard classification methods such as Random Tree, REPTree, Random Forest and J47 algorithms under the Decision Tree approach. Effective classification models were built using Data Mining WEKA and R tools/Softwares. The built classification models were tested using 10 cross validation folds and the results were analyzed using performance evaluation metrics. Among the considered classification models, the Random Forest Model is found good for the classification of Historical Monument places. The proposed work is helpful to classify the Historical Monument places based on their number of visitors in each year. The future work includes the prediction of number of visitors in the upcoming years which may helpful to increase in the GDP of the country.
References Application of Data Mining in the Classification of Historical Monument Places
- Sultan Singh Jaswal, "Role of Tourism Industry in India's Development". Journal of Tourism & Hospitality”, 2014.
- Jianhong et al, “Data Mining of Tourists’ Spatio-temporal Movement Patterns - A Case Study on PhillipIsland”, Proceedings of the 8th International Conference on GeoComputation. Jul 31-Aug 3 2005. Ann Arbor, Michigan. University of Michigan.
- Rob Law, et. al., “Data Mining in Tourist Demand Analysis”, Springer, 2007.
- S. Cankurt and A. Subasi, “Developing Tourism Demand Forecasting Model Using machine Learning Techniques with Trend, Seasonal, and Cyclic Components.”, Balkan Journal of Electrical and Computer Engineering,Volome 3, No.1, 2015.
- Chang-Jui Lin, et.al, “Forecasting Tourism Demand Using Time Series, Artificial Neural, Networks and Multivariate Adaptive Regression Splines: Evidence from Taiwan”, International Journal of Business Administration Vol. 2, No. 2; May 2011.
- M.I. López, J.M Luna, C. Romero and S. Ventura, “Classification via clustering for predicting final marks based on student participation in forums” Regional Government of Andalusia and the Spanish Ministry of Science and Technology projects.
- Chang-Jui Lin and Tian-Shyug Lee “Tourist Demand Forecasting: Economic Model Based on Multivariate Adaptive Regression Splines, Artificial Neural Network and Support Vector Regression”, Advances in Management and Applied Economics, Vol.3, No.6, 2013.
- Erika kulcsár, “Multiple Regression Analysis of Main Economic Indicators in Tourism” Journal of tourism.
- G.Curtis and Dimitris X. Kokotos, “A Decision Tree Application in Tourism based Regional Economic Development”, Tourismos: An International Multidisciplinary Journal of Tourism”, Vol.4, No.2, 2009.
- Siddu P Algur, Prashant Bhat,”Metadata Based Classification and Analysis of Large Scale Web Videos”, International Journal of Emerging Trends and Technology in Computer Science,Volume 4, Issue 3, May – June 2015
