Application of Statistical Models for the Analysis of Data Obtained from Continuous Assessment of Students in Higher Education

Author: Sanja Stojanović, Radovan Dragić, Gabrijela Dimić, Čedomir Vasić, Zoran Gordić
Journal: International Journal of Cognitive Research in Science, Engineering and Education @ijcrsee
Section: Original research
Article in issue: 3 vol.13, 2025.
Free access
This paper presents the findings of a study aimed at exploring students activities during lectures and exercises. The research was conducted through basic population of students at the University “St. Kliment Ohridski” – Bitola, in academic years from 2015 to 2023. The data obtained from the continuous checking of the students’ knowledge, which refer to: attendance and activity in lectures and exercises, preparation of seminar papers, independent (home) work, completed or realized projects / programs, as well as from the colloquium grades, are the basis for the application of linear statistical models that will be realized through descriptive, correlation and regression analysis, factor analysis and statistical inference. In this way, information is obtained from a series of indicators that will serve the professors to take appropriate corrective actions, in order to improve and better create their teaching and educational process. As a result, it is expected to obtain better results that are of interest to students and higher education institutions, in terms of increasing the quality and efficiency of the teaching and learning process in higher education.
Statistical Models, Statistical Inference, Database of Statistical Data, Continuous Assessment (ECTS), Higher Education
Short address: https://sciup.org/170211412
IDR: 170211412 | DOI: 10.23947/2334-8496-2025-13-3-749-764
Text of the scientific article Application of Statistical Models for the Analysis of Data Obtained from Continuous Assessment of Students in Higher Education
The problem of research in this paper consists in finding a way to improve the results in the educational process in higher education institutions by applying statistical models, with appropriate software support. Namely, the problem of the research can be expressed by the question: “Does the application of statistical models in the analysis of the statistical data obtained from the continuous assessment of students enable the improvement of the teaching and learning process in higher education institutions?” Solving this problem will be possible only if a comprehensive statistical analysis (descriptive, correlational, regression, factorial) and statistical inference (statistical hypothesis testing) is made of the available data related to the continuous examination of students’ knowledge in higher education ( Williamson, Bayne and Shay, 2020 ).
The main goal of the research should enable the identification, discovery and statistical conclusion of the interaction that exists between the results of the different modalities of continuous assessment and the final results achieved in the continuous assessment of students in higher education ( Yang and Ge, 2022 ).
Specific research objectives should enable: obtaining insights from the review and identification of the state of the results of continuous assessment through the methods of descriptive statistics; gaining insights into the interaction between the different modalities and the final results of continuous assessment, through correlation and regression analysis; statistical inference for the results of the continuous assessment through the parametric testing of statistical hypotheses and determination of the components of the factors that are significant for the achieved results in the continuous assessment through factor analysis ( Wong and Li, 2020 ).

© 2025 by the authors. This article is an open access article distributed under the terms and conditions of the Creative Commons Attribution (CC BY) license .
Many authors emphasise the importance of continuous assessment (CA) of students. M. Com-brinck and M. Hatch ( Combrinck and Hatch, 2012 ) emphasises that students perceived that their learning is improved and that is evident that many students’ experiences of CA were positive.
-
D. Playfoot, L.L. Wilkinson, and J. Mead ( Playfoot, Wilkinson, and Mead, 2023 ) in their work reports a series of studies that assessed the performance of students on continuous assessment components from two courses in an undergraduate psychology programme. The studies described in this paper set out to examine whether students with additional learning needs might be disadvantaged when continuous assessment tests are incorporated into courses and as result of this research there appears to be no such disadvantage ( Teeroovengadum, Nunkoo, Gronroos, Kamalanabhan and Seebaluck, 2019 ).
-
Y. R. Rincón, A. Munárriz, A. M. Ruiz ( Rincón, Munárriz, and Ruiz, 2024 ) proposes a new approach of continuous assessment of a formative nature, aimed at achieving meaningful learning with lower stress levels.
One of the process of continuous assessment of students is also evaluating lecturers by students. In this regard, D. D. Trung, B. Dudić, D. V. Duc, N. H. Son and A. Mittelman ( Trung, Dudić, Duc, Son, and Mittelman, 2024 ) emphisises that the current landscape of higher education, the quality of teaching plays a crucial role in supporting the comprehensive development of students. Authors also focuses on constructing a lecturer ranking system, particularly in the context of a specific course through the evaluation process from students.
For this research very important is the use of linear models which M. Kutner, C Nachtsheim, J. Neter, and W. Li ( Kutner, Nachtsheim, Neter, and Li, 2004 ) present in detail (the most important linear statistical models and their application possibilities).
According to ( Bowman, 2012 ) quantitative meta-analysis is very useful, yet an underutilized technique for synthesizing research findings in higher education. He emphasizes that meta-analysis scientists have concluded that standardized regression coefficients applied to higher education represent an appropriate metric for effect size and that linear modeling provides an efficient method for conducting meta-analytic research ( Morales, Salmerón, Maldonado, Masegosa and Rumí, 2022 ).
Also, according to ( Tüzüntürk, 2015 ) the importance of using parametric and nonparametric statistical methods is inevitable for many scientific branches in the scientific world, especially for the quality of services in education. At the same time, it has great significance for personal development and performance, for the success of an institution, as well as for the development of the country.
Materials and Methods
Materials and methods are the second section of an IMRAD paper. Its purpose is to describe the experiment in such retail that a competent colleague could repeat the experiment and obtain the some or equivalent results. Provide sufficient detail to allow the work to be reproduced. Methods already published should be indicated by a reference: only relevant modifications should be described.
For solving the defined research problem, the research strategy case study (correlation study, survey research) is suitable. Namely, in the research from the basic population of students at the University “St. Kliment Ohridski” - Bitola, using a case study as a sample, students from the second year of the Faculty of Economics in Prilep, from all study programs, in the subject of statistics for economists in academic years 2014/2015, 2015/2016, 2016/2017, 2017/2018, 2018/2019, 2019/2020, 2020/2021, 2021/2022 and 2022/2023, that is, from 2015 to 2023 .
This should enable obtaining a series of answers to the following questions: Is there a difference in the results of continuous assessment in the first and second colloquium? Is there a difference in the results of continuous assessment in the first (second colloquium) achieved by students from different study programs? Does the presence of students at classes and exercises affect the results of colloquia? Does the activity of students in teaching and exercises affect the results of colloquiums? Does the activity (attendance) of students in teaching and exercises affect the results of seminars?
Of course, a series of indicators for the average grades from the colloquiums (for example, by study programs), the average final grade, the average variability of the grades, the laws of probability, the distribution functions and the symmetry or asymmetry of the distribution of the continuous assessment results are also obtained here ( Smeds, 2022 ). All this after academic years with appropriate comparative analysis and understanding of development tendencies. Also, with the survey research, answers should be obtained for questions related to the quality of teaching, the relationship with the students, as well as the evaluation of the students.
The application of survey statistics is observed using a representative sample (students of the second year of study in the subject of statistics for economists) for sufficiently significant time periods of recorded valid data ( Castillo-Manzano, Castro-Nuño, López-Valpuesta, Sanz-Díaz and Yñiguez, 2024 ).
Based on these data, statistical processing was performed using statistical methods: descriptive statistics (average values, standard deviations, coefficients of variation), correlation and regression analysis (linear, simple and multiplicative), factor analysis (based on a survey of students), statistical inference, that is, testing of statistical hypotheses using the parametric ANOVA test ( Luan and Tsai, 2021 ).
The data on the results of the continuous assessment of students in higher education are recorded in mandatory databases that should be operated by the subject teacher according to the rules for continuous checking and recording of the results achieved from the first cycle of studies at the University “St. Kliment - Ohridsk” - Bitola. That data is continuously recorded with all changes up to the final results of the continuous assessment, and then archived.
The research is carried out in the final part of the semester through a previously constructed survey questionnaire that is filled out by students who are regular at classes and exercises. Also, important data from the continuous assessment (attendance, activity, seminar/project assignments and colloquiums) are collected at the end of the semester for all registered students from the second year of study ( Clemons and Jance, 2024 ). The overall procedure of creating and applying a statistical model for the analysis of data obtained from the continuous assessment of students in higher education is presented in Figure 1.

Statistical analysis and statistical inference
Data Database Survey research
Continuous assessment

Descriptive statistics
Hypothesis testing
Linear multiple regression analysis
Factor analysis
Statistical software Data processing tools
Information, knowledge, corrective actions
Figure 1. Statistical models for the analysis of data obtained from continuous assessment.
Data on colloquiums, attendance, activity, the creation of seminar works or research tasks, as well as data from survey research, are created in a special database for continuous assessment and are subject to statistical processing and analysis through the use of: descriptive statistics, correlational and regression analysis, factor analysis and statistical inference. Data analysis tools in Microsoft Excel, SPSS or other statistical software and applications are used in the processing. The goal is to obtain information and knowledge about the success of the education process, as a basis for taking corrective actions to continuously improve that success.
The multiple regression model for this research can be represented by the following formulation:
xi = b0 + b1x1 + b2x2 +b3x3 +b4x4 , where:
General assessment;
-
x 1 - Average points from colloquiums;
-
x 2 - Attendance at classes and exercises;
-
x 3 - Teaching activity and exercises;
-
x 4 - Preparation of a seminar paper (projects, programs, etc.).
Based on the above-defined model, simple regression models can be defined and a regression analysis can be performed on them, whereby relevant indicators for the quantitative interaction of the variables of interest will be obtained.
Hypothetical research framework
Based on the subject and objectives of the research, the following basic hypothesis can be defined, as well as the auxiliary hypotheses derived from it:
Basic hypothesis: The results of the additional activities in the continuous knowledge test do not affect the final grade in the continuous assessment.
Auxiliary hypotheses:
-
• The results of the colloquia do not affect the final grade in the continuous assessment.
-
• Students’ attendance at classes and exercises does not affect the final grade in continuous assessment.
-
• Activity in teaching and exercises does not affect the final grade in continuous assessment.
-
• Completion of project assignments or term papers does not affect the final grade in continuous assessment.
The processing and analysis of the data, the subject of this research, is quite convenient to realize, considering that the entire record of the continuous evaluation is created in a database in Microsoft Excel. Namely, Data Analysis is used as a tool for statistical data processing and Microsoft Excel with all available statistical procedures, in order to solve the problem of decision-making: descriptive statistics, correlation and regression analysis, parametric ANOVA testing, etc. The convenience of importing data from Microsoft Excel into the data editor in the statistical package SPSS is also used, where there is an opportunity for additional processing and analysis with other statistical methods, non-parametric tests, factor analysis, etc.
Results
By applying descriptive statistics to the recorded data for continuous evaluation, a series of information is obtained regarding the average grades, the average variability of the grades (Table 1), the asymmetry of the distribution of the grades, as well as the possibility of generalization through interval evaluation with an appropriate confidence threshold. All this is made possible by using Data Analysis in Microsoft Edge, (See Table 2).
Table 1 . Statistics from processed data for continuous assessment of students in the subject statistics for economists according to school years
|
Academic year |
Average grade |
Standard deviation |
Coefficient of variation |
|
2014/2015 |
7,52 |
1,33 |
17,67 |
|
2015/2016 |
8,04 |
1,44 |
17,92 |
|
2016/2017 |
7,59 |
1,16 |
15,26 |
|
2017/2018 |
8,27 |
1,47 |
17,72 |
|
2018/2019 |
6,83 |
0,98 |
14,39 |
|
2019/2020 |
7,94 |
1,30 |
16,42 |
|
2020/2021 |
8,5 |
0,972 |
11,43 |
|
2021/2022 |
8 |
1,73 |
21,65 |
|
2022/2023 |
8 |
1,225 |
15,31 |
The average grade from the continuous assessment in 5 out of 9 school years is 8 or above 8. Only in the 2018/2019 academic year we have the lowest average grade, i.e. an average grade below 7. (Table 1 and Figure 2). The greatest variability in grades, expressed by the coefficient of variation, was observed in the school year 2021/2022, and the lowest in the academic year 2020/2021. (Table 1 and Figure 3).
Coefficient of variation

Average grade

Figure 2. Average final grades across academic years. Figure 3. Coefficient of variation.
02468 Illllllll

There is also the possibility to calculate and compare the average grades and their variability between the different study programs, the first and second colloquium and so on.
This provides information on success and corrective actions to be taken to improve that success.
Based on the processed data related to the subject of research in this paper, the following information presented in Table 1 is obtained.
Table 2 . Descriptive statistics on the additional activities of students in the subject statistics for economists in the respective academic years
|
Academic year |
Total students |
Insufficient attendance (%) |
Insufficient activity (%) |
Not interested in seminary (%) |
Passed through colloquiums (%) |
|
2014/2015 |
181 |
16,02 |
60,22 |
75,14 |
45,86 |
|
2015/2016 |
149 |
12,08 |
36,91 |
77,85 |
35,57 |
|
2016/2017 |
95 |
17,89 |
53,68 |
86,32 |
35,78 |
|
2017/2018 |
90 |
4,44 |
51,11 |
78,89 |
41,11 |
|
2018/2019 |
72 |
19,44 |
81,94 |
84,72 |
8,33 |
|
2019/2020 |
95 |
25,26 |
73,68 |
92,61 |
18,95 |
|
2020/2021 |
60 |
13,33 |
58,33 |
90,00 |
16,67 |
|
2021/2022 |
46 |
30,43 |
84,78 |
80,43 |
23,91 |
|
2022/2023 |
18 |
5,55 |
72,22 |
72,22 |
27,78 |
The following can be seen from table 2 and figure 4:
Passed through colloquiums (%)
Figure 9. Colloquiums pass rate

Based on the data from table 2 that refer to the additional activities: attendance at classes and exercises, activity at classes and exercises, and preparation of seminar papers, the following hypotheses can be defined:
-
H1: There is no difference in the percentage participation in the additional activities of the students according to the different academic years
-
H2: There is no difference in the percentage of students’ participation in extracurricular activities compared to the different modalities of extracurricular activities.
To test the above-defined hypotheses, we apply the parametric ANOVA test with two factors and multiple modalities. We get the following results (Table 3).
Since the calculated value of the F variable (2.493614) is lower than the theoretical value of the F variable which is 2.591096, we accept H1 and statistically conclude that there is no difference in the percentage participation in the additional activities of the students according to the different academic years.
We come to the same conclusion by comparing the measured value of p, which is 0.057022, which is greater than the theoretical value p=0.05.
Since the calculated value of the F variable (128.6174) is greater than the theoretical value of the F variable which is 3.633723, we reject H2 and statistically conclude that there is a significant difference in the percentage participation in the additional activities of the students according to the different modalities of extracurricular activities. We come to the same conclusion by comparing the measured value of p, which is approximately equal to 0, which is lower than the theoretical value p=0.05.
Table 3. Anova: Two-Factor without Replication
|
SUMMARY |
Count |
Sum |
Average |
Variance |
|
2014/2015 |
3 |
151.38 |
50.46 |
945.2368 |
|
2015/2016 |
3 |
126.84 |
42.28 |
1103.051 |
|
2016/2017 |
3 |
157.89 |
52.63 |
1171.493 |
|
2017/2018 |
3 |
134.44 |
44.81333 |
1415.437 |
|
2018/2019 |
3 |
186.1 |
62.03333 |
1362.576 |
|
2019/2020 |
3 |
191.55 |
63.85 |
1206.477 |
|
2020/2021 |
3 |
161.66 |
53.88667 |
1484.38 |
|
2021/2022 |
3 |
195.64 |
65.21333 |
912.1408 |
|
2022/2023 |
3 |
149.99 |
49.99667 |
1481.63 |
|
Insufficient attendance (%) |
9 |
144.44 |
16.04889 |
71.83606 |
|
Insufficient activity (%) |
9 |
572.87 |
63.65222 |
245.8493 |
|
Not interested in seminary (%) |
9 |
738.18 |
82.02 |
46.8371 |
|
ANOVA |
||||
|
Source of Variation |
SS |
df |
MS |
F P-value F crit |
|
Rows |
1618.258 |
8 |
202.2822 |
2.493614 0.057022 2.591096 |
|
Columns |
20866.92 |
2 |
10433.46 |
128.6174 1.38E-10 3.633723 |
|
Error |
1297.922 |
16 |
81.1201 |
|
|
Total |
23783.1 |
26 |
||
If the basic multiple regression model is implemented for all academic years, the following indicators are obtained for the quantitative interactions of the variables of interest (Table 4).
Table 4. shows a very strong relationship between the final grade and the points obtained from the colloquiums, the presence of classes and exercises, the activity of classes and exercises and preparation of seminar papers. This relationship is also confirmed by the high values of the coefficients of determination.
|
Table 4. Quantitative indicators of the interaction of variables in the general linear multivariate regression model. |
|||||
|
Academic year |
Multiple R |
Adjusted R Square |
Standard Error |
F-variable |
p- value |
|
2014/2015 |
0.9997 |
0.9995 |
0.3109 |
38906.95 |
0,0000 |
|
2015/2016 |
0.9999 |
0.9997 |
0.2008 |
63449.68 |
0,0000 |
|
2016/2017 |
0.9994 |
0.9986 |
0.4572 |
6163.435 |
0,0000 |
|
2017/2018 |
0.9999 |
0.9998 |
0.2352 |
37945.25 |
0,0000 |
|
2018/2019 |
0.9999 |
0.9999 |
0,0001 |
95829,15 |
0,0000 |
|
2019/2020 |
0.9834 |
0.9582 |
2.6511 |
109.82 |
0,0091 |
|
2020/2021 |
0.9684 |
0.9024 |
2.8074 |
26.43 |
0,0003 |
|
2021/2022 |
0,9999 |
0,9997 |
0.0001 |
97546.32 |
0,0000 |
|
2022/2023 |
0,9999 |
0,9998 |
0,0001 |
98238.49 |
0,0000 |
Also, for all academic years, it can be seen that the calculated values of the F-variable are greater than the corresponding theoretical values, that is, all the calculated p-values are lower than the theoretical value p=0.05. In all cases, that is, for all academic years, the hypothesis that there is no difference in the influence of grades from colloquiums, attendance, activity, the preparation of seminar papers, and the final grade is rejected. So there is a statistically significant difference in the influence of all modalities of additional activities and colloquium grades on the final grade. Or rather they have a different impact.
|
If we realize the simple regression models, that is, the separate impacts of the success of the col-loquia and each modality of additional activities separately on the final grade, we will get the following results: Table 5. Quantitative indicators of the interaction of colloquium grades and the final grade |
|||||
|
Academic year |
Multiple R |
Adjusted R Square |
Standard Error |
F-variable |
p- value |
|
2014/2015 |
0.9326 |
0.8681 |
4.9208 |
540.61 |
0,0000 |
|
2015/2016 |
0.9452 |
0.8913 |
4.6255 |
427.18 |
0,0000 |
|
2016/2017 |
0.9349 |
0.8701 |
4.5063 |
222.11 |
0,0000 |
|
2017/2018 |
0.9387 |
0.8779 |
5.2644 |
266.95 |
0,0000 |
|
2018/2019 |
0.9297 |
0.8609 |
5.5079 |
254.79 |
0,0000 |
|
2019/2020 |
0.9552 |
0.9075 |
3.9426 |
187.38 |
0,0000 |
|
2020/2021 |
0.8018 |
0.6071 |
5.6326 |
17.997 |
0,0017 |
|
2021/2022 |
0.9574 |
0.9090 |
5.5590 |
120.87 |
0,0000 |
|
2022/2023 |
0.9235 |
0.8160 |
5.3159 |
23.18 |
0,0086 |
|
In Table 5, through the values of the correlation coefficients, a very strong relationship between the colloquium grades and the final grade can be seen. That strong interaction is also represented by the high values of the coefficients of determination. Also, for all school years it can be seen that the calculated values of the F-variable are greater than the corresponding theoretical values, that is, all the calculated p-values are lower than the theoretical value p=0.05. This means that, for all cases, that is, for all academic years, the hypothesis that colloquium grades do not affect the final grade is rejected. So, the grades from the colloquiums have a significant impact on the final grade. |
|||||
|
Table 6. Quantitative indicators of the interaction of the attendance of classes and exercises and the final grade |
|||||
|
Academic year |
Multiple R |
Adjusted R Square |
Standard Error |
F-variable |
p- value |
|
2014/2015 |
0.3826 |
0.1358 |
12.5945 |
13.89 |
0,0004 |
|
2015/2016 |
0.5732 |
0.3154 |
11.6060 |
24.95 |
0,0000 |
|
2016/2017 |
0.1021 |
0.0104 |
12.6324 |
0.34 |
0,5657 |
|
2017/2018 |
0.5628 |
0.2978 |
12.6237 |
16.69 |
0,0002 |
|
2018/2019 |
0.4892 |
0.2203 |
13.0408 |
12.59 |
0,0010 |
|
2019/2020 |
0.1168 |
0.0136 |
13.2267 |
0.25 |
0,6239 |
|
2020/2021 |
0.2003 |
0.0401 |
9.2337 |
0.42 |
0,5325 |
|
2021/2022 |
0.5757 |
0.2706 |
15.7386 |
5.45 |
0,0395 |
|
2022/2023 |
0.1511 |
0.0228 |
13.6972 |
0.09 |
0,7750 |
In table 6, through the values of the correlation coefficients, it can be seen that in certain academic years (2014/2015, 2015/2016, 2017/2018, 2018/2019 and 2021/2022) there is a significant relationship between the attendance of classes and exercises and the final grade , and while in some academic years (2016/2017, 2019/2020, 2020/2021 and 2022/2023) the presence of classes and exercises has a weak influence on the final grade - this is also seen from the insignificant value of the coefficients of determination. Also, for the corresponding academic years, it can be seen that the calculated values of the F-variable are greater than the corresponding theoretical values, i.e. calculated p-values are lower than the theoretical value p=0.05, and for the others they are higher than the theoretical value of p=0.05. This means that in some academic years, the hypothesis that the attendance of classes and exercises does not affect the final grade is rejected (that is, attendance has a significant impact on the final grade), and in other academic years, the hypothesis that the attendance of classes and exercises does not affect the final grade is accepted. on the final grade (meaning attendance does not affect the final grade).
Table 7. Quantitative indicators of the interaction of class activity and exercises and the final grade
|
Academic year |
Multiple R |
Adjusted R Square |
Standard Error |
F-variable |
p- value |
|
2014/2015 |
0.5658 |
0.3117 |
11.2402 |
38.13 |
0,0000 |
|
2015/2016 |
0.6267 |
0.3809 |
11.0370 |
32.99 |
0,0000 |
|
2016/2017 |
0.2693 |
0.0435 |
12.2297 |
2.50 |
0,1236 |
|
2017/2018 |
0.6832 |
0.4520 |
11.1517 |
31.52 |
0,0000 |
|
2018/2019 |
0.6964 |
0.4721 |
10.7304 |
37.67 |
0,0000 |
|
2019/2020 |
0.3068 |
0.0438 |
12.6756 |
1.87 |
0,1883 |
|
2020/2021 |
0.6756 |
0.4020 |
6.9487 |
8.40 |
0,0159 |
|
2021/2022 |
0.8489 |
0.6950 |
10.1776 |
28.34 |
0,0002 |
|
2022/2023 |
0.7660 |
0.4835 |
8.9069 |
5.680672 |
0,0757 |
In table 7, through the values of the correlation coefficients, it can be seen that in certain academic years (2014/2015, 2015/2016, 2017/2018, 2018/2019, 2020/2021 and 2021/2022) there is a significant relationship between the activity of teaching and exercises and the final grade, and while in some academic years (2016/2017, 2019/2020 and 2022/2023) the activity of classes and exercises has a weak influence on the final grade - this can be seen by the insignificant value of the coefficients of determination. Also, for the corresponding academic years, it can be seen that the calculated values of the F-variable are greater than the corresponding theoretical values, that is, the calculated p-values are less than the theoretical value p=0.05, and for the rest they are greater than the theoretical value p =0.05. This means that in some academic years the hypothesis that the activity in classes and exercises does not affect the final grade is rejected (that is, the activity has a significant impact on the final grade), and in other academic years the hypothesis that the activity in classes and exercises does not affect the final grade is accepted. grade (meaning the activity does not affect the final grade grade).
Table 8. Quantitative indicators for the interaction of preparation of the seminar and the final grade
|
Academic year |
Multiple R |
Adjusted R Square |
Standard Error |
F-variable |
p- value |
|
2014/2015 |
0.7569 |
0.5676 |
8.9095 |
108.62 |
0,0000 |
|
2015/2016 |
0.7860 |
0.6103 |
8.7560 |
82.44 |
0,0000 |
|
2016/2017 |
0.6868 |
0.4552 |
9.2299 |
28.57 |
0,0000 |
|
2017/2018 |
0.7514 |
0.5525 |
10.0775 |
46.68 |
0,0000 |
|
2018/2019 |
0.6782 |
0.4464 |
10.9889 |
34.06 |
0,0000 |
|
2019/2020 |
0.5890 |
0.3118 |
10.7531 |
9.61 |
0,0062 |
|
2020/2021 |
0.6111 |
0.3108 |
7.4603 |
5.96 |
0,0348 |
|
2021/2022 |
0.8956 |
0.7842 |
8.5609 |
44.60 |
0,0000 |
|
2022/2023 |
0.9615 |
0.9056 |
3.8067 |
49.00 |
0,0022 |
In Table 8, through the values of the correlation coefficients, it can be seen that in all academic years there is a significant relationship between the preparation of a seminar paper and the final grade. It can also be seen from the values of the coefficients of determination. Also, for all academic years it can be seen that the calculated values of the F-variable are greater than the corresponding theoretical values, that is, the calculated p-values are less than the theoretical value p=0.05. This means that for all academic years, the hypothesis that the preparation of seminar papers does not affect the final grade is rejected, that is, it is statistically concluded that the preparation of the seminar paper has a significant impact on the final grade. If we include in the regression model the independent variables expressed through all modalities of additional activities, that is, attendance at classes and exercises, activity at classes and exercises and preparation of seminar papers, then we get the following results from the interaction with the final grade.
Table 9. Quantitative indicators of the interaction of additional activities and the final grade
|
Academic year |
Multiple R |
Adjusted R Square |
Standard Error |
F-variable |
p- value |
|
2014/2015 |
0.7906 |
0.6107 |
8.4529 |
43.88 |
0,0000 |
|
2015/2016 |
0.8263 |
0.6634 |
8.1385 |
35.15 |
0,0000 |
|
2016/2017 |
0.6988 |
0.4371 |
9.3819 |
9.54 |
0,0001 |
|
2017/2018 |
0.8208 |
0.6450 |
8.9756 |
23.41 |
0,0000 |
|
2018/2019 |
0.7856 |
0.5870 |
9.4915 |
20.42 |
0,0000 |
|
2019/2020 |
0.7102 |
0.4115 |
9.9443 |
5.43 |
0,0091 |
|
2020/2021 |
0.7799 |
0.4613 |
6.5952 |
4.14 |
0,0480 |
|
2021/2022 |
0.9021 |
0.7518 |
9.1813 |
13.11 |
0,0012 |
|
2022/2023 |
0.9720 |
0.8618 |
4.6077 |
11.39 |
0,0000 |
In Table 9, through the values of the correlation coefficients, it can be seen that in all academic years there is a significant or very strong relationship between the additional activities and the final grade. It can also be seen from the values of the coefficients of determination. Also, for all academic years it can be seen that the calculated values of the F-variable are greater than the corresponding theoretical values, that is, the calculated p-values are less than the theoretical value p=0.05. This means that for all academic years, the hypothesis that the additional activities do not affect the final grade is rejected, that is, it is statistically concluded that the additional activities have a significant impact on the final grade.
Significant information about the quality of the teaching process is also obtained from a continuous survey of students, which refers to the teaching staff, using appropriate response modalities of the type: 5- yes, completely agree, 4- mostly agree, 3- I hesitate, 2- I mostly disagree, 1- no, I don’t agree at all. Questions related to the teacher are defined as variables shown in Table 10.
Table 10. Questions related to the teacher defined as variables
|
Variable |
Meaning |
Variable |
Meaning |
|
SPRN |
readiness to implement teaching |
DAFZ |
expands knowledge of the subject |
|
PPI |
commitment and the ability to provoke interest among students |
RPFC |
realizes a planned fund of lessons |
|
KSMN |
using modern methods of teaching work |
OSODL |
provides appropriate basic and additional literature |
|
MS |
knows how to motivate and involve students in the teaching process |
PST |
applies modern technologies |
|
SDA |
stimulates additional activities |
ODK |
open and available for consultation |
|
LKO |
has a personal culture and relationship |
OO |
allows objective assessment |
|
IK |
exams / colloquiums are with questions |
OIZ |
the assessment is a reflection of the knowledge |
|
within the subject program |
and achievement of the students |
At the beginning, it is tested whether the data in the model are suitable for the application of factor analysis. We do that with Kaiser-Meyer-Olkin Measure of Sampling Adequacy.
Table 11. Kaiser-Meyer-Olkin Measure of Sampling Adequacy.
KMO and Bartlett's Test
|
Kaiser-Meyer-Olkin Measure of Sampling Adequacy. Bartlett's Test of Approx. Chi-Square Sphericity df Sig. |
,790 439,996 91 ,000 |
KMO (Kaiser-Meyer-Olkin Measure of Sampling Adequacy) for the analyzed model is 0.790, which shows that the data in the model are suitable for factor analysis. It is also confirmed by the significance of the Chi-Sguare test for 91 degrees of freedom. Factor analysis is used to process the survey data. At the same time, the basic information from the answers presented through descriptive statistics such as average values of the answers and average variabilities of the answers are presented in Table 12.
Table 12. Average values and average variabilities of students’ answers
Descriptive Statistics
|
Mean |
Std. Deviation |
Analysis N |
|
|
SPRN |
4,90 |
,325 |
114 |
|
PPI |
4,63 |
,584 |
114 |
|
KSMN |
4,37 |
,744 |
114 |
|
MS |
4,56 |
,625 |
114 |
|
SDA |
4,74 |
,625 |
114 |
|
DAFZ |
3,71 |
,948 |
114 |
|
RPFC |
3,80 |
,979 |
114 |
|
OSODL |
4,46 |
,766 |
114 |
|
PST |
4,08 |
,970 |
114 |
|
LKO |
4,77 |
,533 |
114 |
|
ODK |
4,80 |
,551 |
114 |
|
IK |
4,63 |
,834 |
114 |
|
OO |
4,59 |
,577 |
114 |
|
OIZ |
4,71 |
,528 |
114 |
Table 13 Communalities
Communalities
|
Initial |
Extraction |
|
|
SPRN |
1,000 |
,731 |
|
PPI |
1,000 |
,587 |
|
KSMN |
1,000 |
,430 |
|
MS |
1,000 |
,607 |
|
SDA |
1,000 |
,576 |
|
DAFZ |
1,000 |
,608 |
|
RPFC |
1,000 |
,656 |
|
OSODL |
1,000 |
,482 |
|
PST |
1,000 |
,662 |
|
LKO |
1,000 |
,449 |
|
ODK |
1,000 |
,556 |
|
IK |
1,000 |
,477 |
|
OO |
1,000 |
,701 |
|
OIZ |
1,000 |
,654 |
Extraction Method: Principal Component Analysis.
Table 14 Extraction of the factors affecting the level of the teaching process
Total Variance Explained
|
Component |
Initial Eigenvalues |
Extraction Sums of Squared Loadings |
||||
|
Total |
% of Variance |
Cumulative % |
Total |
% of Variance |
Cumulative % |
|
|
1 |
4,412 |
31,512 |
31,512 |
4,412 |
31,512 |
31,512 |
|
2 |
1,609 |
11,493 |
43,005 |
1,609 |
11,493 |
43,005 |
|
3 |
1,105 |
7,892 |
50,897 |
1,105 |
7,892 |
50,897 |
|
4 |
1,050 |
7,502 |
58,399 |
1,050 |
7,502 |
58,399 |
|
5 |
,977 |
6,975 |
65,374 |
|||
|
6 |
,852 |
6,088 |
71,462 |
|||
|
7 |
,732 |
5,227 |
76,690 |
|||
|
8 |
,701 |
5,007 |
81,697 |
|||
|
9 |
,627 |
4,480 |
86,177 |
|||
|
10 |
,511 |
3,650 |
89,828 |
|||
|
11 |
,471 |
3,367 |
93,195 |
|||
|
12 |
,362 |
2,588 |
95,783 |
|||
|
13 |
,317 |
2,264 |
98,048 |
|||
|
14 |
,273 |
1,952 |
100,000 |
|||
Extraction Method: Principal Component Analysis.
Four factors explain 58.399% of the variability in the level of the teaching process.
Scree Plot
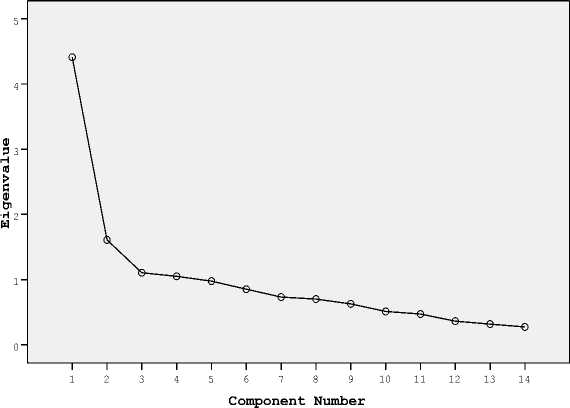
Figure 10. Cattelli diagram for 14 variables
Table 15. Matrix of factor structure after VARIMAX rotation of factors
Component Matrix a
|
Component |
||||
|
1 |
2 |
3 |
4 |
|
|
SPRN |
,341 |
,132 |
,476 |
,609 |
|
PPI |
,510 |
-,450 |
,275 |
-,222 |
|
KSMN |
,538 |
-,006 |
,345 |
-,145 |
|
MS |
,685 |
-,219 |
,292 |
-,071 |
|
SDA |
,377 |
-,411 |
-,110 |
,503 |
|
DAFZ |
,576 |
-,428 |
-,275 |
-,130 |
|
RPFC |
,785 |
-,099 |
,143 |
-,096 |
|
OSODL |
,443 |
-,478 |
-,221 |
,090 |
|
PST |
,721 |
,091 |
-,232 |
-,281 |
|
LKO |
,388 |
,487 |
-,078 |
-,235 |
|
ODK |
,492 |
,401 |
,326 |
-,217 |
|
IK |
,488 |
,410 |
,024 |
,265 |
|
OO |
,648 |
,350 |
-,330 |
,224 |
|
OIZ |
,649 |
,231 |
-,406 |
,124 |
Extraction Method: Principal Component Analysis. a. 4 components extracted.
The component: during the lesson, the teacher is dedicated and arouses interest among the students; uses modern teaching methods; motivates and involves students in the teaching process, stimulates additional activities in order to increase and expand knowledge of the subject; realizes the planned fund of classes; applies modern technology in the implementation of teaching (computers, software support, information bases, etc.); open and available for consultation and cooperation with students; the exam/ colloquium questions are within the scope of the subject program and the provided basic literature; the content and structure of the exams/colloquium questions enable objective assessment; the grade is a reflection of the students’ knowledge and achievement, they refer to the first factor of influence on the teaching process. This factor refers to the quality of teaching and assessment.
The teacher component provides adequate basic and additional literature, the personal culture and attitude of the teacher are at an appropriate level, refer to the second factor of influence on the teaching process. This factor refers to the attitude towards students.The component, the teacher is adequately prepared for teaching, refers to the third factor of influence on the teaching process. This factor refers to the quality of the teacher. The component, the teacher stimulates additional activity for the students (making homework, projects, term papers) refers to the fourth factor of influence on the teaching process. This factor refers to the improvement of the teaching process.
Discussions
The statistical model offered in this paper, which can be practiced very easily, enables continuous monitoring and a basis for corrective actions in order to provide an opportunity on the way to a higher quality teaching-educational process and thus a higher quality higher education. The meaning of the offered statistical model refers to the following:
-
• A clear picture of the course and realization of the continuous assessment in the academic years is obtained, thereby identifying the weaknesses and realizing the possibilities for their removal by taking corrective actions with the aim of increasing the quality of the teaching-educational process.
-
• Consultations and communication with students becomes easier based on accurate information at every moment.
-
• It represents the basis for planning the educational process, that is, the performance of lectures and exercises.
In future research, we will consider Hierarchical Linear Models (HLM) as an advanced statistical technique designed to analyze student achievement data that have internal nested structure, such as students nested within classrooms, institutions of higher education, or districts.
Unlike traditional regression models, which assume independence of observations, HLM explicitly takes this hierarchical arrangement of data into account, allowing for the simultaneous assessment of the effects of individual-level factors (e.g., prior achievement) and group-level variables (e.g., teacher quality or institutional resources) on student outcomes.
This methodological approach is essential to address violations of the independence assumption inherent in standard regression analysis because it models the non-independence of observations within groups, thereby providing more accurate and valid inferences regarding the determinants of student achievement.
Conclusions
The realization and improvement of the quality of higher education, and especially of the teaching-educational process, is a continuous need, obligation and task of every higher education institution and every teacher actively involved in that process. In that sense, the continuous record, the creation of databases that relate to the realization of that process, the processing and analysis of that data with the application of statistical methods and techniques and with appropriate software support is not only a necessity but an imperative.
The proposed statistical model is significant because it can serve as a basis for developing higher education enrollment policies and is designed to be flexible, applicable, and efficient for use at both individual and institutional levels. Its benefits extend to students, faculty, and the entire educational institution.
Acknowledgements
The authors thank the Linguistics Department of PM College Belgrade for their support in the process of translation and proofreading of the manuscript.
Funding
This research did not receive any specific grant from funding agencies in the public, commercial, or not-for-profit sectors.
Conflict of interests
The authors declare no conflict of interest.
Data availability statement
The original contributions presented in the study are included in the article/supplementary material, further inquiries can be directed to the corresponding author/s.
Institutional Review Board Statement
Not applicable.
Author Contributions
Conceptualization: S.S., R.D. and G.D.; methodology: S.S. and Č.V.; software: Č.V. and Z.G.; formal analysis: S.S. and R.D.; writing—original draft preparation: S.S, R.D. and G.D.; writing—review and editing: Č.V. and Z.G. All authors have read and agreed to the published version of the manuscript.
