Application of the blue-intensity method for dating wooden buildings in Siberia

Author: Myglan V.S., Zharnikov Z.Y., Sidorova M.O., Barinov V.V., Tainik A.V.
Journal: Archaeology, Ethnology & Anthropology of Eurasia @journal-aeae-en
Section: Ethnography
Article in issue: 4 т.46, 2018.
Free access
Short address: https://sciup.org/145145389
IDR: 145145389 | DOI: 10.17746/1563-0110.2018.46.4.109-113
Text of the article Application of the blue-intensity method for dating wooden buildings in Siberia
In recent years, dendrochronological studies aimed at determining the calendar time of construction of archaeological and architectural sites have been conducted in Russia (Matskovsky, Solomin, Bushueva, 2013; Voronin, 2010; Shiyatov, Khantemirov, 2000; Karpukhin, 2009; Goryachev, Myglan, Omurova, 2013). In Siberia, despite the success achieved (Myglan, Slyusarenko, Mainicheva, 2009; Zharnikov, Vizgalov, Knyazeva et al., 2014; Zharnikov et al., 2014; Barinov et al., 2016; Sidorova, Zharnikov,
Myglan, 2016), we encountered a lot of problems in dating cultural heritage sites in the temperate climatic zone (the Omsk, Novosibirsk, Irkutsk Regions, and others). One of these problems is related to the fact that the increment of annual rings of wood shows little variation, owing to the virtual absence of limiting factors. This severely complicates integration of individual increment series into generalized tree-ring chronologies based on buildings, and their subsequent cross-over dating. For this reason, it was impossible to determine the time of construction of historical sites in a number of cases. The way out could be found by using
other annual growth indicators that are more sensitive to environmental changes.
Judging by an assessment of efficiency and cost, the blue-intensity (BI) method, based on measuring the optical density of wood, is highly promising (Larsson, 2013; Rydval et al., 2014). The principle of this method consists in measuring the intensity of blue light reflected by annual rings. The denser the wood is, the darker is its tone, and the smaller is the reflected-light value. Researchers have established that the correlation between the maximum density and reflection is higher in the blue spectrum; therefore, the method was given the
Table 1. Statistical characteristics of the tree-ring chronologies for the Podg area
|
TRW |
sd |
m |
podg_lint |
podg_cr |
|
podg_lint |
0.21 |
0.13 |
– |
0.98 |
|
podg_cr |
0.22 |
0.14 |
0.98 |
– |
|
podg_bi |
0.27 |
0.11 |
–0.57 |
–0.58 |
Note. The calculations have been made for the total period of 1850–2016, p < 0.05; sd – standard deviation, m – sensitivity coefficient; significant correlation coefficients are given in bold.
Table 2. Statistical characteristics of the tree-ring chronologies for Gromov’s house and Gafarov’s store
|
TRW |
хз to |
£ |
05 CD |
e1 о CD |
5 05 CD |
b e' О CD |
|
gaf_lint |
0.15 |
0.11 |
– |
– |
– |
– |
|
grom_lint |
0.12 |
0.10 |
– |
– |
– |
– |
|
gaf_cr |
0.13 |
0.10 |
0.95 |
– |
– |
– |
|
grom_cr |
0.15 |
0.12 |
– |
0.96 |
– |
– |
|
gaf_bi |
0.23 |
0.21 |
– 0.39 |
– |
– 0.38 |
– |
|
grom_bi |
0.19 |
0.18 |
– |
– 0.49 |
– |
– 0.53 |
Note. The calculations have been made for the total period of 1791–1870, p < 0.05; legend same as in the note to Table 1.
Table 3. (Pearson) correlation coefficients between the BI and TRW chronologies
|
TRW |
3 05 CD |
^1 E о CD |
5 05 CD |
b E о CD |
05 CD |
1 E о CD |
|
podg_bi |
0.54 |
0.57 |
– |
– |
– |
– |
|
podg_cr |
– |
– |
0.23 |
0.31 |
0.13 |
0.27 |
|
podg_lint |
– |
– |
0.19 |
0.28 |
0.09 |
0.24 |
*See note to Table 2.
name “blue-intensity” (Dolgova, 2017: 209–210). This article describes the techniques of sample preparation, the measurement of the optical density of annual rings, and the construction of chronologies on the basis of this indicator, by the example of dating two architectural buildings in the city of Yeniseysk. The efficiency of the method for determining the calendar time of construction of wooden buildings is assessed.
Material and methods
Calendar dating of any historical site presumes the presence of two components, namely: calendar scale-related generalized indexed tree-ring width (TRW) chronology for the area under study; and “floating” TRW, built on the basis of samples from the site under study (Barinov et al., 2016). Cores of common pine ( Pinus sylvestris , L.) from the indigenous forest site Podg, located 70 km to the southwest of Yeniseysk (58°11′ N, 91°53′ E), served as material for building the indexed tree-ring chronology. Samples (19 spec.) were taken by an age borer, 1.3 m above ground level, following the standard procedure. We used two wooden structures in Yeniseysk—tinsmith Gromov’s house (Kirova 70) and Gafarov’s store (Bograda 70)—as sites for calendar dating (Dom s lavkoy…, 2011; Zhiloy dom…, 2011). Cores from the buildings (13 and 16 spec., respectively) were taken sparingly, using a dry wood borer 8 mm in diameter.
To obtain proper results when measuring the optical density of wood, all samples were subjected to the alcohol extraction of resins in the Soxhlet extractor (Jensen, 2007). The process duration with violent boiling varied from 10 to 24 hours, and continued up to complete cessation of alcohol coloration in the extraction chamber. After completion of the procedure, the cores were placed under a press at room temperature to avoid their deformation. Then, they were glued onto wooden substrates, so that tracheids of annual rings were arranged in the upright position relative to the substrate plane. Samples showing increment anomalies were removed from selection.
Next, the upper layer of each sample was cut down to obtain a smooth surface on the sledge microtome (Gärtner, Nievergelt, 2010) by cutters No. 35 (Thermo) and BA-170 P (NT Cutter). After that, it was digitized using the Epson Perfection V850 Pro scanner (pre-calibrated by means of the Monaco System (MONR2014:08-02) reflection target). In accordance with the recommendations of the method’s creators, scanning was carried out with a resolution of 1200 dots per inch (Rydval et al., 2014). If cores contained rings less than 300 μm wide, they proved to be barely discernible. In such cases, samples were scanned with resolutions of 3200 and 4800 dots per inch.
Subsequently, images from the scanner were processed in the CooRecorder 8.1 program (Larsson, 2013), by means of which two indicators were determined: optical density of late wood and width of annual ring. The graphic representation of the obtained data was performed in the CDendro 8.1 program (Ibid.). To verify the data on the width of annual rings, the cores were subjected to a repeated measuring procedure, using the LINTAB VI semiautomatic apparatus (with the accuracy of 0.01 mm).
All measured series were dated by a combination of graphical cross-over dating (Douglass, 1919) and crosscorrelation analysis in task-level programming packages DPL (Holmes, 1983) and TSAP V3.5 (Rinn, 1996). The age trend was removed through standardization by sliding a spline of 2/3 the length of each series in the ARSTAN program (Cook, Krusic, 2008). The quality of the obtained chronologies was assessed on the basis of conventional indicators: correlation and sensitivity coefficients, standard deviation, etc. (Wigley, Briffa, Jones, 1984).
Results and discussion
Constructing a regional chronology. Samples from the indigenous forest area (Podg) were measured using the CooRecorder and LINTAB VI. Individual increment series were dated crosswise and standardized.
This resulted in three 255-year chronologies: podg_ bi by the optical density of wood, podg_cr and podg_ lint by the width of annual rings measured by means of the CooRecorder and LINTAB VI, respectively (Table 1). Their comparison by such indicators as the standard deviation and the sensitivity coefficient has not demonstrated any substantial variation in values. The (Pearson) correlation coefficient between the TRWs by the width of annual rings, measured using two different methods, points to a nearly linear relationship (0.98). A significant negative correlation in the width and optical density of annual rings can be traced between the chronologies (Table 1).
Constructing chronologies from wooden architecture sites. Measuring samples from Gromov’s house and Gafarov’s store, as in the case with the Podg area, allowed data on two indicators to be obtained. This resulted in the development of four chronologies from the width of annular rings, using the CooRecorder and LINTAB VI (gaf_cr, grom_cr, and gaf_lint, grom_lint, respectively), and two chronologies from the optical density (gaf_bi and grom_bi) (Table 2). Their comparison by the standard deviation and the sensitivity coefficient has shown that the TRWs based on the optical density of wood have a greater variation in values about the mean,
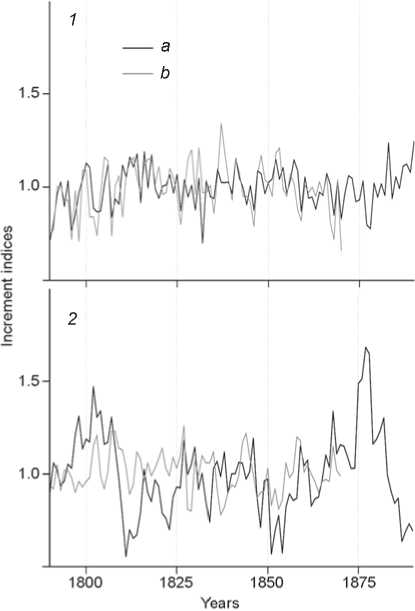
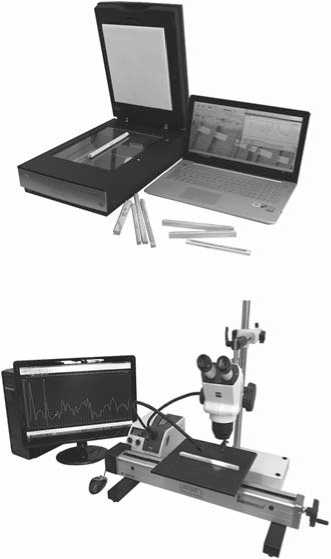
Graphical cross-over dating of indexed chronologies for the area under study ( a ) and the TRW for Gromov’s house ( b ). 1 – by the optical density of wood (measuring equipment is on the right); 2 – by the annual ring width (measuring equipment is on the right).
and are almost 2 times more sensitive (Table 2). Judging by the (Pearson) correlation coefficients, as in the case with the living trees, a high, nearly linear relationship can be traced between the data obtained when measuring the width of annular rings by various methods (CooRecorder and LINTAB VI), while a significant negative correlation is recorded between the chronologies in the width and optical density of annual rings (Table 2).
Calendar dating. During the final stage, cross-over dating of the chronologies based on the optical density and the annual ring width for wooden architecture was conducted in the COFECHA program, in order to assess the quality of TRWs and to determine the time of construction (Holmes, 1983). The results of crosscorrelation analysis have shown that the chronology based on the optical density of late wood for Gafarov’s store is reliably dated to 1909 (by five segments, with a window of 50 and a step of 25 years, the value of the multiple correlation coefficient is 0.44) and for Gromov’s house to 1870 (by three segments, with a window of 50 and a step of 25 years, the value of the multiple correlation coefficient is 0.43). Meanwhile, the chronologies based on the width of annular rings gave no way of confidently dating the buildings.
Calculation of the (Pearson) correlation coefficients has confirmed a substantial difference in the use of optical density and annual ring width indicators (Table 3). The differences between these indicators is clearly illustrated by the example of graphical dating of Gromov’s house (see Figure ).
Conclusions
During our study, using the example of calendar dating of wooden architecture in Yeniseysk, we assessed the efficiency of the blue-intensity method as compared to the conventional dendrochronological approach based on analysis of the width of annual rings. Comparison of the obtained data has demonstrated that the optical density of late wood is more sensitive to environmental changes. As exemplified by dating of Gafarov’s store (1909) and Gromov’s house (1870), an unquestionable advantage of this indicator for dating historical sites located in the temperate zone has been shown.
Comparison of data from the annual ring width obtained by various methods (CooRecoder and LINTAB VI) has shown that the accuracy of these measurements is similar. In such a case, application of the blue-intensity method has an unquestionable advantage, because despite an increase in span time for sample preparation, it becomes possible to determine two indicators simultaneously: the width and optical density of the annual rings. In addition, the cost of equipment for measuring the annual ring characteristics by the BI method proved to be next cheapest than when using the LINTAB VI measuring apparatus with a stereoscopic microscope.
Thus, the results of the study have shown that the use of the of blue-intensity method opens the best prospects for researchers in terms of determining the calendar age of archaeological and architectural sites in the temperate climatic zone.
Acknowledgements
The expedition studies were supported by the Russian Science Foundation (Project No. 15-14-30011), and the analysis of the obtained data by the Russian Foundation for Basic Research (Project No. 15-06-06986).
