Artificial Intelligence Attitude Scale for Primary School Students

Author: Taha Oruc, Ozgen Korkmaz, Murat Kurt
Journal: International Journal of Modern Education and Computer Science @ijmecs
Article in issue: 5 vol.17, 2025.
Free access
Based on this gap in the literature, the problem situation identified was deemed worth investigating in terms of contributing to the accumulation of knowledge on the subject area. In addition, it is thought that this study will contribute to future studies on artificial intelligence in primary school education. The aim of this study is to create a Likert-type attitude scale that can be used to determine primary school students’ attitudes towards artificial intelligence. In this study, exploratory sequential design, one of the mixed research method types, was used. A 32-item draft scale form was prepared in the light of the literature review, student opinions collected through a structured interview form and data obtained from field experts. In order to examine the validity of the scale, exploratory and confirmatory factor analyses, item-factor total correlations and item discriminations were evaluated. The goodness of fit values obtained in confirmatory factor analysis were [CMIN=245,020, df=159 (CMIN/df= 1.541), RMSEA= 0.45, RMR= 0.035, GFI= 0.916, AGFI= 0.889, CFI= 0.903, NFI= 0.773, IFI= 0.906]. To evaluate the reliability of the scale, internal consistency coefficient was calculated, and test-retest analysis was performed. Cronbach’s Alpha reliability coefficient for the overall scale was 0.807 and McDonald’s Omega coefficient was 0.816. As a result, it was determined that the Artificial Intelligence Attitude Scale, which consists of 4 factors and 20 items, is an appropriate, valid and reliable tool for evaluating primary school students’ attitudes towards artificial intelligence.
Primary School Students, Artificial Intelligence, Attitude, Scale Development, Exploratory Sequential Design
Short address: https://sciup.org/15019968
IDR: 15019968 | DOI: 10.5815/ijmecs.2025.05.02
Text of the scientific article Artificial Intelligence Attitude Scale for Primary School Students
Artificial intelligence stands out as a phenomenon that pushes the boundaries of humanity, that gives the impression of being inspired by works of science fiction, but which has become a concrete reality today. This intelligence, which has become a part of our computers, systems and even our daily lives, is evolving at an impressive pace, not only in its calculations but also in its learning capabilities. Artificial intelligence, which is often referred to as “AI” in the literature, can be defined as the ability to realize features such as making sense, decision-making, learning and benefiting from experiences in digital environments [1]. A more refined definition of artificial intelligence is “the imitation of human natural intelligence” [2]. Although there are many definitions of artificial intelligence in the literature, all of the definitions have to fit into one of the conceptual patterns related to artificial intelligence such as “systems that think like humans, systems that behave like humans, systems that think rationally, systems that behave rationally” [3].
The first studies on artificial intelligence date back to 1950 when Alan Turing developed the Turing Test, a test that can be used to evaluate the intelligent behavior of a computer, in his article “Computing Machinery and Intelligence” [4]. Artificial intelligence as a concept was born when mathematics professor John McCarthy developed a definition and plan for artificial intelligence at a conference in Dortmund in 1956 [5]. Each of these studies can be considered a milestone in the emergence and development of artificial intelligence. Today, artificial intelligence is used in a wide range of fields such as transportation, health, engineering, aviation, defense industry and industry. Artificial intelligence has undoubtedly found itself a significant area of interest and use in the field of education, as in other sectors. Artificial intelligence in education makes significant contributions in the areas of individualized learning, automatic assessment and feedback, student guidance, language learning and game-based learning. In this way, education processes can be managed in a more efficient, student-oriented and secure way, and learning experiences can be made more impressive and qualified. When the literature on artificial intelligence in education is examined, it can be said that research on artificial intelligence in education has increased in recent years, but contrary to expectations, this increasing trend is not in thesis studies [7, 8]. Potential problems such as lack of trust in artificial intelligence, ethical and legal concerns, time and cost problems in research on artificial intelligence cause researchers to see this issue as a challenging field of study [7]. When the studies in the literature are examined in terms of the method used, it is seen that qualitative and quantitative methods are mostly used in the studies [9]. In quantitative studies, mostly experimental studies measuring the effect of artificial intelligence applications were found [7, 10, 11, 12]. The studies conducted with qualitative method are mostly literature review, document review [7, 8, 9, 12, 13, 14, 15, 16, 17, 18, 19, 20, 21, 22] and metaphor studies [23, 24, 25]. In the studies, it is seen that the sample group is mainly composed of undergraduate students and prospective teachers [8]. The findings of these studies mostly provide a general perspective on the use of AI in education.
Considering that individuals born and growing up in the 21st century interact intensively with computers and the internet, it is unthinkable for them to stay away from artificial intelligence and its applications [8]. Today, children have access to learning opportunities by interacting with artificial intelligence in a digitalized world, and given these advantages, it is emphasized that learning processes will move beyond time and space, thus spreading education to wider masses and becoming more effective [26]. By encouraging children to use these technological applications in a healthy way, parents and educators can strengthen their digital skills and children can adapt to future technology in a more informed way. Considering the time children spend with technological devices and the factors they are exposed to, there is a need for studies examining the interaction between children and artificial intelligence [27]. Children’s attitudes towards artificial intelligence are shaped by both their curiosity about technology and their level of knowledge about this technology. Attitude generally reflects the behavior patterns that individuals exhibit towards events or objects in their environment [28]. This is the likely behavior that an individual is expected to exhibit when faced with a situation or problem. Examining attitudes towards a phenomenon offers opportunities such as understanding social interactions and monitoring social and cultural changes [29]. Attitudes stand out as one of the subjects that are studied in various fields such as psychology, economics, political science, history, anthropology and communication and are considered as an important constituent element of human behavior, so the study of attitudes is of special importance [27, 28].
In the literature review, scale development [30, 31, 32, 33, 34, 35] and scale adaptation [36, 37, 38, 39] studies on artificial intelligence were found. The sample groups of these studies were mostly adults, university students, school administrators and teachers. However, there is no scale development study on artificial intelligence for primary school students. As a scale development study addressing attitudes towards artificial intelligence, the main originality of this study is that it is aimed at primary school students. The main purpose of this study is to develop an original scale to measure primary school students’ attitudes towards artificial intelligence. As a matter of fact, this study, which examines the attitudes of primary school students towards artificial intelligence, is considered important in understanding the social dynamics towards artificial intelligence, raising awareness of artificial intelligence in primary school students and ensuring that educational policies respond more effectively to the needs in this field. Based on this gap in the literature, the problem situation identified was deemed worth investigating in terms of contributing to the accumulation of knowledge on the subject area. This study makes an important contribution in terms of determining the attitudes of elementary school students towards artificial intelligence, raising awareness about the role of artificial intelligence in education and providing data to guide educational policies. In addition, the study is expected to provide methodological and theoretical guidance for future research on artificial intelligence and education.
2. Method 2.1. Research Design
The aim of this study is to develop a scale that can be used to measure primary school students ’ attitude towards artificial intelligence. For this purpose, exploratory sequential design, one of the mixed method types, was used in the study. Exploratory sequential design is a design in which the researcher starts the study by examining qualitative data and uses the findings obtained in the quantitative research dimension [40]. This method was preferred because it provides in-depth information about the research topic and verification of qualitative findings at the quantitative stage, especially in the process of developing a new scale. Since there is no previously developed valid and reliable scale on artificial intelligence attitudes of primary school students, it was aimed to understand the attitudes of the students with qualitative data and to determine the scope of the scale. In addition, by first developing an in-depth understanding of the subject under investigation, the qualitative data obtained were used as a basis for the development of the scale items.
The themes and findings obtained in the qualitative phase provided guidance for determining the items and ensuring construct validity in the scale development process. With this method, it is aimed to obtain a comprehensive view of primary school students’ attitudes towards artificial intelligence. In the research, firstly, the qualitative process was carried out and, in this process, the phenomenology method, one of the qualitative research methods, was preferred. The phenomenological design is a research design that enables to reveal the essence of the findings on the subject from the perspectives of people who have gained experience in a particular subject [41]. In the qualitative phase, student opinions were analyzed in detail and the categories obtained from these analyses formed the basic structure of the scale. In the quantitative dimension of the study, descriptive survey method was preferred as a quantitative research method. This method allows for the quantitative description of the feelings, attitudes and tendencies of the sample group determined from the population [39]. The scale developed in line with the themes determined in the qualitative phase was applied to a large group of students and validity and reliability analyzes were performed, thus qualitative data were quantitatively verified.
-
2.2. Study Group
-
2.3. Creating the Item Pool
Qualitative data were collected from 21 students in the 3rd and 4th grades of a public primary school in Turhal district of Tokat. Criterion sampling method, which is one of the purposeful sampling methods, was preferred in the selection of the study group. The criterion sampling method is a method in which people, situations or phenomena that meet the criteria determined by the researchers are included [42]. In the qualitative data collection phase of the study, this sampling method was preferred since the criterion of including students who had previously received training on artificial intelligence was determined.
In the Exploratory Factor Analysis (EFA) phase of the quantitative data collection, 390 students studying in the third and fourth grades of public primary schools in Middle Anatolia in the 2023-2024 academic year were reached. In the Confirmatory Factor Analysis (CFA) phase of the study, 264 students studying in the 3rd and 4th grades of different primary schools in the same region were reached. It is stated that the sample size for EFA meets at least 5-10 times more participants per variable, which is the minimum recommended ratio for factor analysis [6]. In the CFA stage, the sample size is at a level that allows the model fit indices to be calculated reliably [51]. Accordingly the sample size criteria widely accepted in scale development studies were met. Thus, a total of 654 students were reached to collect the quantitative data of the study. Convenient sampling method was used to determine the sample. Convenience sampling is a method in which individuals who are easily accessible to the researcher and who voluntarily participate in the research are included in the sample [43]. The distribution of the demographic characteristics of the students in the sample group for quantitative data is shown in Table 1.
Table 1. Distribution of Demographic Characteristics of Students
|
Variable |
f |
% |
||
|
о ад Й Й < ш |
Girl |
193 |
49,5 |
|
|
Gender |
Boy |
197 |
50,5 |
|
|
Total |
390 |
100 |
||
|
3th Grade |
176 |
45,1 |
||
|
Grade Level |
4th Grade |
214 |
54,9 |
|
|
Total |
390 |
100 |
||
|
о ад й Й < о |
Girl |
120 |
45,5 |
|
|
Gender |
Boy |
144 |
54,5 |
|
|
Total |
264 |
100 |
||
|
3th Grade |
165 |
62,5 |
||
|
Grade Level |
4th Grade |
99 |
37,5 |
|
|
Total |
264 |
100 |
As can be seen in Table 1, 193 of the 390 students who participated in the EFA phase of the study were female (49.5%) and 197 were male (50.5%). When the grade level information of the students was analyzed, 176 students who participated in the EFA phase were studying at the 3rd grade level (45.1%) and 214 students were studying at the 4th grade level (54.9%). Of the 264 students who participated in the research at the CFA stage, 120 were female (45.5%) and 144 were male (54.5%).
To create the item pool in the study, a detailed literature review was conducted first. In the process of writing the scale items, some artificial intelligence scale studies found in the literature were utilized. In item writing, the statements “i am impressed by what artificial intelligence can do, artificial intelligence can have positive effects on people’s welfare, i would like to use artificial intelligence in my own work, most of the society will benefit from a future full of artificial intelligence” in the “General Attitudes Towards Artificial Intelligence Scale (GAAS)” developed by Schepman and Rodway [32] were used. In the “Artificial Intelligence Anxiety Scale” developed by Akkaya et al. [36], the statements “learning to use artificial intelligence techniques/products makes me anxious, I worry that an artificial intelligence technique/product may replace humans” were taken into consideration during the item writing phase. In addition, statements such as “I find generative artificial intelligence applications useful in my daily life, the use of generative artificial intelligence applications increases my productivity, it is easy to use generative artificial intelligence applications” in the “Generative Artificial Intelligence Acceptance Scale” developed by Yilmaz et al. [35]. A draft item pool of 25 items was created in line with the literature review. In addition, qualitative data were collected from primary school students to discover the meanings of the concept of “artificial intelligence” and to include these meanings in the item pool. A structured interview form created by the researchers was used to collect data. In line with student opinions, 7 more items deemed necessary for the scale were added to the item pool and the draft form was increased to 32 items in total. Qualitative data helped to understand students’ perceptions and attitudes towards artificial intelligence in more depth, which played an important role in the development of the scale items. In this process, the findings obtained from qualitative data shaped the content and scope of the items tested in the quantitative research phase. Examples of student opinions and the items added to the draft item pool accordingly are given in Table 2.
Table 2. Items Added Based on Student Opinions
|
Student |
Student Opinion |
Added Item |
|
S1 |
By using AI, we fall behind in our social life, we become sick and addicted to AI. |
(Using AI tools negatively affects my social side. |
|
S2 |
If we use AI too much, it gets lazy. |
AI makes me lazy. |
|
S3 |
When we are bored or in need, AI can teach us like a teacher. |
I would like to learn from an AI instead of a teacher. |
As seen in Table 2, 7 items were added to the item pool in line with the qualitative data obtained from the students such as “(S1) By using artificial intelligence, we will fall behind from our social life, we will become sick and addicted to artificial intelligence.”, “(S2) If we use artificial intelligence too much, it will make us lazy.” and “(S3) I would like to learn the subject from artificial intelligence instead of the teacher.”. The 32-item item pool was reevaluated in detail by the researchers and divided into 5 sub-factors as a draft. In order to ensure content and face validity, the draft form was presented to six experts in the field of educational technology, one of whom was a doctoral faculty member, three associate professors and one professor. Experts were selected from among professionals with academic qualifications in the fields of educational technology and artificial intelligence and published works on these topics. The experts’ feedback made significant contributions to the revision of the statements regarding the suitability for the level of the students in the study group, relevance to the subject area, and content and face validity, and to make the scale more valid and reliable. The experts used the measurement assessment statements developed by the researchers for each item to convey their opinions. In the evaluation criterion, statements such as “appropriate, should be changed, should be removed” were given for the evaluation of each item in the scale. For the content validity of the items in the Artificial Intelligence Attitude Scale, Lawshe’s content validity rate formula was used as a reference. The calculation of Lawshe’s content validity rate for the items that were recommended for correction or removal by at least one expert (all items except for the items deemed appropriate by all experts) is presented in Table 3.
Table 3. Content Validity Rates of the Items
As seen in Table 3, 7 items were rearranged and 2 items were removed from the scale as a result of expert evaluations. Items were removed to clarify ambiguous or ambiguous statements and to focus on more specific aspects of the attitude to be measured rather than general statements. The items deemed appropriate by all experts are not included in the table. Examples of items that were edited according to expert opinions are presented in Table 4.
Table 4. Examples of Items Edited According to Expert Opinions
|
First State of Item |
Revised Version of the Item |
|
Utilizing artificial intelligence in my lessons would lead to wasting time. |
(Implementing artificial intelligence in my lessons would result in wasting my time. |
|
I think my creativity does not develop in lessons that use artificial intelligence. |
I think I won’t be able to express my own ideas in lessons that use artificial intelligence. |
|
I learn less with AI than with other methods and techniques. |
Artificial intelligence contributes less to my learning. |
|
It excites me to imagine myself as a scientist working on artificial intelligence in the future. |
I would be excited to imagine myself working in a profession related to AI in the future. |
As seen in Table 4, the expert opinions on the items were examined and adjustments were made to the items to ensure clarity and comprehensibility, to change expressions that may not be understood or that may evoke different meanings, and to emphasize more specific aspects of the attitude statement to be measured instead of general expressions.
2.4. Data Collection Process
2.5. Data Analysis
The pilot study of the “Artificial Intelligence Attitude Scale” was conducted in the spring semester of the 20232024 academic year. The collected data were computerized and SPSS 25.0, JAMOVI and AMOS programs were used to analyze the data. First, missing and outlier values in the data set were identified and organized, and negative items were reverse coded. Kaiser-Meyer-Olkin (KMO) and Bartlett tests were applied to determine the suitability of the data for factor analysis. Exploratory factor analysis (EFA) and confirmatory factor analysis (CFA) were applied for the construct validity of the scale, and total item correlations and item discrimination indices (difference between the lower and upper 27% group means) were examined. In order to apply EFA, the sample size should be sufficient and there should be significant correlations between the variables [6]. In addition it should be kept in mind that EFA is sensitive to sample characteristics and depends on the researcher’s interpretations in determining the factor structure. CMIN, CMIN/df, RMSEA, RMR, GFI, AGFI, CFI, NFI and IFI indices were used to evaluate model fit in CFA. However CFA has assumptions such as requiring a verifiable factor structure, requiring a large sample size and the model being based on multivariate normality [51, 52]. For this reason, compliance with normality and linear relationship assumptions were tested and evaluated before the analyses. For reliability, Cronbach Alpha and McDonald’s Omega internal consistency coefficients were calculated and test-retest analysis was performed. While Cronbach’s Alpha usually measures the overall consistency of a scale, McDonald’s Omega offers a more flexible model, taking into account the independence of different sub-factors [53].
3. Findings
The qualitative data of the study were obtained through a structured interview form created by the researchers and the interviews were conducted face-to-face by the first researcher. In collecting the quantitative data of the study, a draft scale named “Artificial Intelligence Attitude Scale” prepared by the researchers was used and the data were collected face-to-face by the first researcher. This scale, which is a triple Likert-type data collection tool, is structured with the statements “3: Agree, 2: Undecided, 1: Disagree”.
To evaluate the validity of the scale, Exploratory Factor Analysis, Confirmatory Factor Analysis, item total correlations analysis and item discrimination analysis were performed on the data. Before these validity analyses, Kaiser-Meyer-Olkin (KMO) and Bartlett’s sphericity test were conducted to evaluate the sample size and the feasibility of factor analysis. The results of the analysis are given in Table 5.
Table 5. Kaiser-Meyer-Olkin (KMO) and Bartlett Sphericity Test Results
|
Kaiser-Meyer Olkin Sampling Adequacy |
,872 |
|
|
Chi-Square Value |
3870,436 |
|
|
Bartlett’s Test of Sphericity |
df |
,946 |
|
p |
,000 |
As seen in Table 5, the KMO coefficient was 0.872 and the result of Barlett’s test of sphericity was p<0.1. The KMO coefficient should generally have a value between 0 and 1, and a value close to 1 indicates that the sample size is more suitable for factor analysis [44]. In addition, the fact that Bartlett’s test of sphericity is significant indicates that the data can be factor analyzed [45]. Based on these results, it was decided that factor analysis could be performed on the data.
Within the scope of construct validity, Exploratory Factor Analysis (EFA) was first conducted to determine the factor structure of the scale. As a result of the EFA using principal component analysis and varimax rotation, the factors were evaluated with a scree plot graph to determine how many factors the 30-item scale consisted of. The results obtained are given in Figure 1.
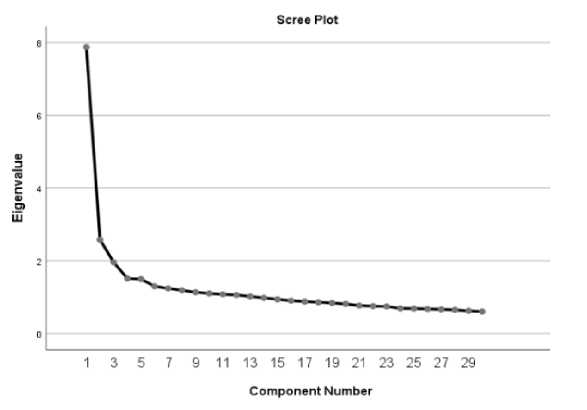
Fig. 1. Scree Plot of Exploratory Factor Analysis
From the graph line in Figure 1, it is observed that the first component contributes significantly to the total variance and starts to stabilize after the fourth component. Within the scope of exploratory factor analysis, the factor loadings of the items were first analyzed. As a result of the first EFA, items with factor loadings below 0.40 that did not measure the same construct and items that were in more than one factor but the difference between them was below 0.10 were gradually eliminated. In this context, a total of 10 items were removed from the scale and it was seen that the loading values of the remaining 20 items in the scale were greater than 0.40 and each item was found in only one factor. The total variance explained by the 20-item scale is given in Table 6.
Table 6. Total Variance Explained Table
|
Items |
Initial Eigenvalues |
Extraction Sums of Squared Loadings |
Rotation Sums of Squared Loadings |
||||||
|
Total |
Variance |
Cumulative |
Total |
Variance |
Cumulative |
Total |
Variance |
Cumulative |
|
|
1 |
4,803 |
24,014 |
24,014 |
4,803 |
24,014 |
24,014 |
2,919 |
14,595 |
14,595 |
|
2 |
1,771 |
8,857 |
32,871 |
1,771 |
8,857 |
32,871 |
2,336 |
11,678 |
26,273 |
|
3 |
1,451 |
7,256 |
40,127 |
1,451 |
7,256 |
40,127 |
2,328 |
11,638 |
37,910 |
|
4 |
1,310 |
6,552 |
46,678 |
1,310 |
6,552 |
46,678 |
1,754 |
8,768 |
46,678 |
|
5 |
,983 |
4,917 |
51,595 |
||||||
|
6 |
,919 |
4,595 |
56,190 |
||||||
|
7 |
,836 |
4,182 |
60,371 |
||||||
|
8 |
,802 |
4,009 |
64,380 |
||||||
|
9 |
,767 |
3,836 |
68,216 |
||||||
|
10 |
,759 |
3,793 |
72,009 |
||||||
|
11 |
,709 |
3,546 |
75,555 |
||||||
|
12 |
,671 |
3,357 |
78,911 |
||||||
|
13 |
,657 |
3,285 |
82,197 |
||||||
|
14 |
,616 |
3,081 |
85,278 |
||||||
|
15 |
,570 |
2,852 |
88,130 |
||||||
|
16 |
,558 |
2,791 |
90,921 |
||||||
|
17 |
,514 |
2,571 |
93,493 |
||||||
|
18 |
,466 |
2,331 |
95,823 |
||||||
|
19 |
,454 |
2,272 |
98,096 |
||||||
|
20 |
,381 |
1,904 |
100,000 |
||||||
As seen in Table 6, the total variance explained was 46.678%. As suggested by Peterson [46], it is stated that the variance explained between 40% and 60% is an acceptable level. In addition, according to the factor analysis results, four factors with eigenvalues greater than 1 were identified. The factors and factor loadings of the items in the scale are presented in Table 7.
Table 7. Factor Loadings Table
|
Items |
Factors |
|||
|
Factor 1 |
Factor 2 |
Factor 3 |
Factor 4 |
|
|
Item 3 |
,673 |
,039 |
,101 |
,046 |
|
Item 4 |
,669 |
-,019 |
,006 |
,066 |
|
Item 1 |
,618 |
,132 |
,055 |
,073 |
|
Item 14 |
,611 |
,372 |
,097 |
,125 |
|
Item 5 |
,592 |
,146 |
,426 |
,015 |
|
Item 6 |
,538 |
,334 |
,221 |
-,059 |
|
Item 13 |
,049 |
,684 |
-,035 |
,161 |
|
Item 9 |
,045 |
,665 |
,069 |
,010 |
|
Item 10 |
,059 |
,607 |
,266 |
-,126 |
|
Item 11 |
,306 |
,587 |
,029 |
-,108 |
|
Item 8 |
,306 |
,453 |
,196 |
,322 |
|
Item 18 |
,039 |
,109 |
,632 |
-,059 |
|
Item 20 |
-,177 |
-,037 |
,604 |
,114 |
|
Item 2 |
,347 |
,039 |
,604 |
-,014 |
|
Item 7 |
,256 |
,075 |
,595 |
,171 |
|
Item 12 |
,265 |
,329 |
,472 |
-,123 |
|
Item 15 |
,342 |
,289 |
,459 |
-,133 |
|
Item 17 |
,143 |
-,052 |
-,031 |
,712 |
|
Item 19 |
,010 |
,040 |
,173 |
,705 |
|
Item 16 |
,003 |
,023 |
-,098 |
,695 |
According to Table 7, factor loadings vary between 0.453 and 0.712. Factor 1 consists of 6 items (1, 3, 4, 5, 6, 14), factor 2 consists of 5 items (8, 9, 10, 11, 13), factor 3 consists of 6 items (2, 7, 12, 15, 18, 20) and factor 4 consists of 3 items (16, 17, 19). The items related to these factors were brought together and factor nomenclature was made by taking the opinions of field experts. Accordingly, factor 1 was named as “kişisel bilişsel tutum (personal cognitive attitude)”, factor 2 as “genel bilişsel tutum (general cognitive attitude)”, factor 3 as “duyuşsal tutum (affective attitude)” and factor 4 as “güvenlik ve sosyal tutum (security and social attitude)”.
Confirmatory factor analysis was conducted to test the 20-item and 4-factor structure formed as a result of EFA in the second sample group. The sample group in which the data used in confirmatory factor analysis was collected included 264 primary school students. As a result of CFA applied without any limitations, goodness of fit values were determined as [CMIN=245,020, df=159 (CMIN/df= 1.541), RMSEA= 0.45, RMR= 0.035, GFI= 0.916, AGFI= 0.889, CFI= 0.903, NFI= 0.773, IFI= 0.906]. According to these values, the NFI value is not in the fit range, while CMIN/df, RMSEA, RMR values are in the good fit range and GFI, AGFI, CFI values are in the acceptable fit range [47]. In this case, the scaled values of the model indicate an acceptable fit to the data. In other words, this model is confirmed by the data. As a result of CFA, the factorial model and item-factor structure of the Artificial Intelligence Attitude Scale are shown in Figure 2.
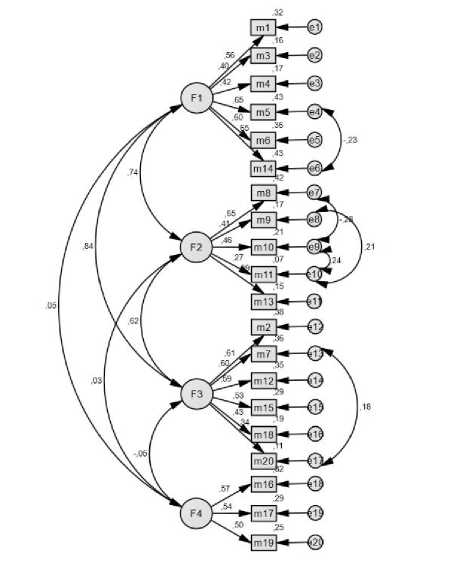
Fig. 2. Factorial Model of the Scale
At this stage, the correlations between the scores of each item in the factors and the total scores obtained from the factors were determined by the total correlation method. Thus, the relationships between the level of contribution of each item in the scale to the general purpose of the scale and the item scores and the overall scores obtained from the factors were tested. The item-factor correlation coefficients calculated for each item are presented in Table 8.
Table 8. Levels of Serving Purpose
|
Personal Cognitive Attitude |
General Cognitive Attitude |
Affective Attitude |
Security and Social Attitude |
||||
|
Item |
r |
Item |
r |
Item |
r |
Item |
r |
|
1 |
,640** |
8 |
,646** |
2 |
,689** |
16 |
,703** |
|
3 |
,671** |
9 |
,663** |
7 |
,644** |
17 |
,735** |
|
4 |
,624** |
10 |
,631** |
12 |
,632** |
19 |
,754** |
|
5 |
,720** |
11 |
,635** |
15 |
,635** |
||
|
6 |
,684** |
13 |
,650** |
18 |
,606** |
||
|
14 |
,698** |
20 |
,495** |
||||
**=p<,0
As can be seen from Table 8, item-factor correlation coefficients range from 0.640 to 0.720 for the personal cognitive attitude factor; 0.631 to 0.663 for the general cognitive attitude factor; 0.495 to 0.689 for the affective attitude factor; and 0.703 to 0.754 for the security and social attitude factor. Each item has a significant and positive relationship with the factor (p<0.01). Accordingly, it can be said that all items serve the purpose of the factors in which they are located.
Independent sample t-test method was used to determine the item discrimination indices of the items in the scale. For the independent sample t test, the upper and lower groups (27%) were determined and the difference between the groups was examined. The findings of the independent sample t-test for item discrimination analysis are shown in Table 9.
Table 9. Item Discrimination Analysis Results
|
Personal Cognitive Attitude |
General Cognitive Attitude |
Affective Attitude |
Security and Social Attitude |
||||
|
Item |
t |
Item |
t |
Item |
t |
Item |
t |
|
1 |
9,653** |
8 |
13,188** |
2 |
14,500** |
16 |
2,368* |
|
3 |
9,883** |
9 |
7,307** |
7 |
12,848** |
17 |
4,449** |
|
4 |
7,862** |
10 |
8,434** |
12 |
10,932** |
19 |
5,540** |
|
5 |
16,591** |
11 |
8,752** |
15 |
11,862** |
||
|
6 |
10,508** |
13 |
6,911** |
18 |
9,797** |
||
|
14 |
11,242** |
20 |
5,793** |
||||
|
Factors |
t |
||||||
|
Personal Cognitive Attitude |
18,175** |
||||||
|
General Cognitive Attitude |
15,365** |
||||||
|
Affective Attitude |
22,206** |
||||||
|
Security and Social Attitude |
5,918** |
||||||
|
Total |
30,829** |
||||||
**=p<,01; *=p<,05
When Table 9 is examined, it is seen that the independent sample t-test results of the 20 items, 4 factors and the total scale vary between 2.368 and 30.829. Since it was determined that the items, factors and scale total scores differed significantly between the upper group and the lower group, it can be said that the discrimination was high.
In this stage, reliability analysis was conducted for the factors of the Artificial Intelligence Attitude Scale, which consists of 20 items and 4 factors, and for the overall scale. Cronbach Alpha and Omega reliability coefficients, the correlation value between the two halves, Spearman-Brown formula and Guttmann Split-Half reliability formula were used in the analyses. The findings of the related analyses are given in Table 10.
Table 10. Internal Consistency Coefficients
|
Factors |
Two Equal Half Correlations |
Sperman Brown |
Guttmann Split-Half |
Cronbach Alpha (α) |
McDonald’s Omega (ω) |
|
Personal Cognitive Attitude |
,574 |
,729 |
,729 |
,757 |
,760 |
|
General Cognitive Attitude |
,491 |
,659 |
,630 |
,648 |
,650 |
|
Affective Attitude |
,489 |
,657 |
,654 |
,673 |
,680 |
|
Security and Social Attitude |
,360 |
,530 |
,508 |
,562 |
,567 |
|
Total |
,565 |
,722 |
,716 |
,807 |
,816 |
As can be seen from Table 10, the two-half correlation of the scale was calculated as 0.565. Spearman Brown reliability coefficient for the overall scale was 0.722, Guttmann Split-Half value was 0.716, Cronbach’s Alpha reliability coefficient was 0.807 and McDonald’s Omega coefficient was 0.816. In addition, factor-specific Cronbach’s Alpha coefficients range from 0.562 to 0.757 and McDonald’s Omega coefficients range from 0.567 to 0.760. Although the internal consistency coefficient for the security and social attitude factor is slightly low, the internal consistency coefficients for the whole scale are quite high, indicating that the scale performs reliable measurements.
The stability level of the scale was calculated by test-retest analysis. The final version of the 20-item scale was administered to 33 students in the initial sample once again after a three-week interval. The relationship between the scores obtained as a result of the two applications was analyzed both in terms of the overall scale and the factors. The findings related to the test-retest analysis of the factors and the whole scale is presented in Table 11.
Table 11. Stability Levels
|
Factors |
First Application X̄ |
Second Application X̄ |
First Application Ss |
Second Application Ss |
r |
|
Personal Cognitive Attitude |
15,54 |
15,42 |
2,166 |
2,839 |
,510** |
|
General Cognitive Attitude |
12,03 |
11,93 |
2,417 |
2,192 |
,366** |
|
Affective Attitude |
14,18 |
13,60 |
2,800 |
3,259 |
,535** |
|
Security and Social Attitude |
5,24 |
5,33 |
1,837 |
1,689 |
,487** |
|
Total |
47 |
46,30 |
5,135 |
7,277 |
,510** |
N=33, **=p< ,01
According to Table 11, the correlation coefficients obtained from the test-retest results for the factors of the scale applied three weeks apart vary between 0.366 and 0.510. The correlation coefficient for the overall scale was calculated as 0.510. These relationships are significant and positive (p< ,01). Based on these findings, it can be stated that the scale performs stable measurements.
4. Conclusion, Discussion and Recommendations
The aim of this study was to develop a valid and reliable Likert-type scale to measure the attitudes of primary school students towards artificial intelligence. The Artificial Intelligence Attitude Scale is a three-point Likert-type scale consisting of 20 items and 4 factors. These factors were named as “personal cognitive attitude”, “general cognitive attitude”, “affective attitude” and “security and social attitude” respectively. The items in the scale are graded as “Disagree (1), Neutral (2), Agree (3)”. The scale consists of 8 negative items and 12 positive items. When the literature is examined, it is seen that there are both scale development [30, 31, 32, 33, 34, 35] and scale adaptation [36, 37, 38, 39] studies on artificial intelligence. However, in these studies, a scale study on artificial intelligence developed for primary school students was not found. The originality of this study is that it was conducted with a study group including primary school students and a valid and reliable scale was developed to measure attitudes towards artificial intelligence.
The creation of the draft item pool of the scale started with a detailed literature review and the qualitative data obtained by collecting the opinions of primary school students about artificial intelligence were analyzed in accordance with the exploratory sequential design from mixed research methods. In addition, a draft item pool of 32 items was created in the light of the opinions of field experts and some artificial intelligence scale studies in the literature. As a result of the opinions of the field experts regarding the appropriateness of the scale items, 7 items in the item pool were edited and 2 items were removed, and the draft item pool was reduced to 30 items. As a result of the exploratory factor analysis conducted with 30 items, 10 items that did not measure the same construct, had factor loading values lower than 0.40, and showed a tendency to more than one factor but the difference between them was lower than 0.10 were removed. As a result of EFA, it was decided that the structure consisting of 20 items and 4 factors would be sufficient to explain the total variance (46,678). As a matter of fact, in cases where there is more than one factor in the scales, it is generally stated that it is appropriate to find the explained variance in the range of 40% - 60% [48]. The goodness of fit values revealed in the confirmatory factor analysis conducted to evaluate this structure in the second sample group were [CMIN=245.020, df=159 (CMIN/df= 1.541), RMSEA= 0.45, RMR= 0.035, GFI= 0.916, AGFI= 0.889. , CFI= 0.903, NFI= 0.773, IFI= 0.906] were determined to exhibit an acceptable level of fit [46]. In the reliability analysis for the Artificial Intelligence Attitude Scale, it was determined that the scale could perform reliable measurements since Cronbach Alpha (α= 0.807) and Omega reliability coefficients (ω= 0.816) were sufficiently high [45]. It is stated that if a scale has more than one factor structure, the Omega reliability coefficient will give more reliable results [49]. Therefore, both coefficients are included in the study. As a result, it was determined that the Artificial Intelligence Attitude Scale is a scale with validity and reliability that can be used to reveal primary school students’ attitudes towards artificial intelligence. Since the sample used in the study was limited to primary school students in a specific geographical region, the generalizability of these findings to primary school students across Turkey and to groups with different socio-economic or cultural backgrounds is limited. For example, different attitudes may be observed between students from rural and urban areas, children from low-income families or families with different levels of education, students from different ethnic backgrounds, or students from culturally diverse regions. Therefore, future research should test the generalizability of these findings by using larger and more diversified samples.
The naming of the scale factors was based on the relevant literature and the general characteristics of the items in the factors. It is accepted that attitude towards an object, phenomenon or situation has cognitive, affective and behavioral components [29]. The cognitive component includes knowledge, opinions and beliefs, the affective component includes positive or negative emotions, and the behavioral component includes behavioral orientation. These components were taken into consideration while determining the attitude statements of primary school students towards artificial intelligence, and the first factor consisting of 6 items was named “personal cognitive attitude”, the second factor consisting of 5 items was named “general cognitive attitude” and the third factor consisting of 6 items was named “affective attitude”. Behavioral tendencies towards artificial intelligence were included in the content of some statements in all factors. These nomenclatures were prepared in accordance with both the multifaceted structure of the concept of attitude and the characteristic structures of the statements in the factors. In addition, disadvantages such as mistrust of emerging technologies related to artificial intelligence, cyber-attacks, and negative effects on social interaction are also discussed in the literature [50]. For this reason, some items in the scale were organized to reveal students’ possible security concerns and social interaction-oriented attitudes towards artificial intelligence. In this context, the fourth factor consisting of 3 items was named “security and social attitude”. The “General Attitude Towards Artificial Intelligence Scale” developed by Schepman and Rodway [32] consists of a total of 20 questions and 2 sub-dimensions: negative attitude towards artificial intelligence and positive attitude towards artificial intelligence. Similarly, the fact that this scale includes both positive and negative statements presents two different perspectives on attitude in opposite directions. As a result, the naming of the scale factors was made by considering the multidimensional structure of the concept of attitude and the characteristic features of the statements in the factors, aiming to evaluate students’ attitudes towards artificial intelligence in a holistic way. In addition, specific issues such as security concerns were also included in the scale, providing a comprehensive measurement of attitudes towards AI. This approach allows us to gain an in-depth understanding of students’ thoughts and feelings about AI in different dimensions. However, cultural differences can significantly shape students’ attitudes towards technology and artificial intelligence. For example factors such as cultural values, educational systems, family structures and social interaction patterns may change students’ perceptions and attitudes towards AI. For this reason, it would be useful to examine in more detail how attitudes towards artificial intelligence are shaped through research conducted in different geographical and cultural contexts and cross-cultural comparisons. In future studies, the validity and reliability of the scale can be recalculated by testing this scale in different sample groups and its generalizability can be increased. In addition, primary school students’ attitudes towards artificial intelligence can be determined and the relationship between various variables and attitudes towards artificial intelligence can be examined.
Acknowledgment
All authors contributed to the study conception and design. Material preparation, data collection and analysis were performed by Taha Oruç, Özgen Korkmaz and Murat Kurt. The first draft of the manuscript was written by Taha Oruç and all authors commented on previous versions of the manuscript. All authors read and approved the final manuscript.
