Assessment Methodology of Intellectual Potential

Author: Makrufa Sh. Hajirahimova, Marziya I. Ismayilova
Journal: International Journal of Education and Management Engineering @ijeme
Article in issue: 1 vol.14, 2024.
Free access
In the modern era, when globalization is widespread, the intellectual potential of the population has become one of the factors of socio-economic and innovative progress. The integration of Azerbaijan into the civilized world and the provision of socio-economic development in the country depend more on the development of science and education, the level of development of new scientific knowledge, techniques and technologies, etc. Today, the importance of the formation and capitalization of intellectual potential is assessed as a factor influencing competitiveness at various levels of the economy. At the modern stage of the development of the information-knowledge economy society, the assessment of intellectual potential plays an important role in increasing the efficiency of the national economy. In the article, the existing methodical approaches to the evaluation of the intellectual potential of higher education and scientific-research institutions are comparatively analyzed and summarized. Indicators that allow the assessment of intellectual potential in the field of education and science are presented in the form of a table. Based on these indicators, the assessment of intellectual potential was carried out for the first time with one of the approaches considered, and the results were presented. This will support making optimal decisions for the development of intellectual potential.
Intellectual potential, assessment methodology of intellectual potential, indicator, system of indicators, science index, education index
Short address: https://sciup.org/15018830
IDR: 15018830 | DOI: 10.5815/ijeme.2024.01.02
Text of the scientific article Assessment Methodology of Intellectual Potential
1. Introductıon
In recent years, interest in studying the processes of intellectual development of society has increased sharply. This is primarily related to the formation of a new socio-economic formation - a society of knowledge, whose main driving force and product is the production, dissemination and efficient use of scientific knowledge and technology. Modern society is based on large-scale scientific research and development projects initiated, implemented and supported by state, intergovernmental and non-governmental associations and foundations. Innovative development, based on a scientifically thoughtful increase and use of the country's intellectual potential (IP), becomes a strategic goal of the country's state policy. The development index of the intellectual potential of society is conceptually the most important component of the more general human development index (Human Development Index - HDI). This index has been calculated for almost all countries of the world since 1990 at the initiative of the United Nations (UN). The evaluation results are systematically published in scientific publications. HDI scores are: low (<0.550), medium (0.550-0.699), high (0.700-0.799) and very high (≥0.800). In the 2021 evaluation of the countries, Switzerland ranked first with 0.962 points, Norway ranked second with 0.961 points, Iceland ranked third with 0.959 points, and Azerbaijan ranked 91st in this list with 0.745 points. Neighboring countries have overtaken Azerbaijan according to this indicator. Turkey shares 48th place with 0.838 points, Russia 52nd place with 0.822 points, Georgia 63rd place with 0.802 points, Iran shares 76th place with 0.774 points [1, 2]. According to the HDI index, Azerbaijan ranks near the middle of the Commonwealth of Independent States (CIS) countries, and near the bottom according to the education index (table 1, fig. 1).
Table 1.Human development index in CIS countries
|
Сountries |
Expected years of schooling |
Mean years of schooling |
Education index |
Human development index |
|
|
52 |
Russia |
15.8 |
12.8 |
0.87 |
0.822 |
|
56 |
Kazakhstan |
15.8 |
12.3 |
0.85 |
0.811 |
|
60 |
Belarus |
15.2 |
12.1 |
0.83 |
0.808 |
|
63 |
Georgiya |
15.6 |
12.3 |
0.84 |
0.802 |
|
77 |
Ukraine |
15.0 |
11.1 |
0.79 |
0.773 |
|
80 |
Moldova |
14.4 |
11.8 |
0.79 |
0.767 |
|
85 |
Armenia |
13.1 |
11.3 |
0.74 |
0.759 |
|
91 |
Azerbaijan |
13.5 |
10.5 |
0.73 |
0.745 |
|
91 |
Turkmenistan |
13.2 |
11.3 |
0.74 |
0.745 |
|
101 |
Uzbekistan |
12.5 |
11.9 |
0.74 |
0.727 |
|
118 |
Kyrgyzstan |
13.2 |
11.4 |
0.75 |
0.692 |
|
122 |
Tajikistan |
11.7 |
11.3 |
0.70 |
0.685 |
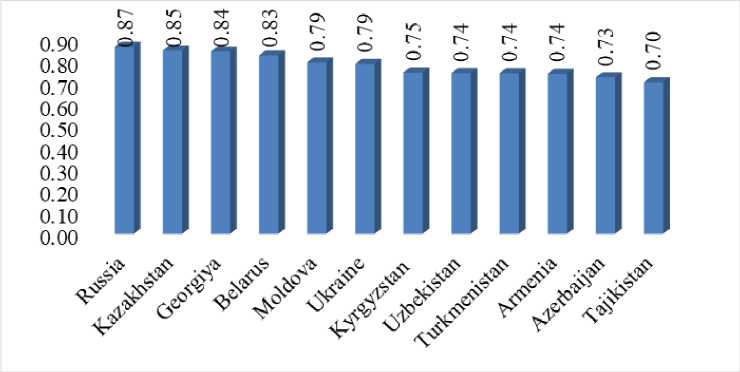
Fig. 1. Education index of the CIS countries in 2021
The main characteristic of highly developed countries is that at the end of the 20th century, science has already become the most important productive force. The economic, financial, military and political power of developed countries now directly depends on the state of fundamental and applied science, the development of scientific research and innovations, the specific weight of science-intensive products in the total volume of industrial production and gross national product. The development of intellectual potential is determined on the one hand by the ability to provide science with modern, high-capital and resource-intensive tools and devices, and on the other hand the ability to train a sufficient number of scientists, engineers, technicians and high-level qualified personnel. Based on the above, the intellectual potential of the society means the totality of human, material and financial resources involved in two closely related areas of the intellectual life of the society - science and education. IP is valued by researchers as one of the main criteria for the growth of the world economy, and the importance of its formation and capitalization is recognized today as a factor affecting competitiveness at various economic levels. In developed countries, great importance is attached to issues of intellectual potential. Therefore, the development of common criteria and methodological basis for IP assessment is one of the urgent issues. The main goal of the work is to analyze the existing methodological approaches used in the evaluation of IP and to carry out a quantitative assessment of intellectual potential in education and science in Azerbaijan. It was found out from the conducted studies that the indicators used in the evaluation of the IP of science and education correspond to the indicators used by the CIS countries. Therefore, the methodology proposed by Russian scientists was used in the evaluation of IP [2].
2. Literature Review
IP is the main driving force of a new type of economic development. Studies demonstrate that the investigation of the principal indicators system and existing methodological approaches for IP assessment is vital [1, 3]. We should note that there exist evaluation methodologies utilizing different indicators at the international level [4-7]:
-
■ The United Nations Educational, Scientific, and Cultural Organization (UNESCO) [4];
-
■ Organisation for Economic Co-operation and Development (OECD) [5, 6];
-
■ Methodology for calculating knowledge index (World Bank) [7];
-
■ etc.
Many approaches have been proposed by researchers to evaluate IP.
One of the first researchers in this field is the American scientist and economist P. Drucker. He proposed to evaluate the intellectual potential based on three indicators:
-
- assessment of the institutional regime that helps motivate the efficient mobilization and distribution of resources, stimulation of creativity, generation, dissemination and use of new knowledge;
-
- availability of educated and qualified personnel capable to constantly improve and adapt their skills for the generation and efficient use of new knowledge;
-
- efficiency of innovation system of companies, research centers and universities [8].
Edvinsson L. and Malone M. proposed to measure the intellectual potential of the region based on five components (human capital, market capital, organizational and technological capital, material capital and financial capital) [9].
In [10], the author considers indicators that characterize the state of two interrelated spheres of intellectual activity of society, that is, science and education, in order to assess the intellectual potential of society.
In [11], the author used indicators of educational (number of university students per 10,000 economically active population; number of students of secondary educational institutions per 10,000 economically active population; share of educational expenses in GDP, in %), scientific-innovation potential (share of R&D expenses in GDP, in %; number of scientists and engineers per 10,000 people; number of patent applicants per 1 million people; number of personal computers per 100 families) and cultural (library stock, copies per 1000 persons; museum attendance,persons per 1000 people; theater attendance, persons per 1000 people; volume of libraries electronic catalogues, % to the total volume of stocks) to evaluate intellectual potential of the population at the macro level. The values of educational (Pep), scientific and innovation (Psl ) and cultural potentials (Rcp ) are calculated as an arithmetic average of their coefficients and integral index of intellectual potential of the population (I [ pp) is calculated according to the formula :
. _ Pep + P sl + R cp
Rpp = g where: Iipp - an integral index of intellectual potential of the territory; Pep - an index of educational potential; Psl- an index of scientific and innovation potential; Rcp - an index of cultural potential of the territory. The methodology of evaluating the intellectual potential of the population at the macro level (including countries, federal districts, regions) allows to ensure the adoption of high-quality decisions for the formation of the intellectual characteristics of the population.
In [14], a new methodology for calculating the IP development index is presented. The methodology developed by the author is based on the methodology proposed in [2].
In another study, a methodology for the integral assessment of the scientific and technical potential of the country was proposed. Eight indicators were used in the proposed methodology (number of scientists and engineers working in the field of scientific and technological development; national expenses on science; number of patents registered in the country; number of patents registered abroad; volume of technology trade (in terms of value); volume of export of science-intensive products; added value in processing industry; volume of technology exports) [14, 15].
In [16], a complex index evaluation method was proposed that evaluates the intellectual potential of the country and its regions. The evaluation of IP in the methodology includes the following indices:
■ indicators of science and education (share of scientific workers per 1,000 people working in the regional economy; share of R&D expenditures in the total regional product; share of university students per 10,000 people; share of university doctoral students per 10,000 people; share of population in the total number of population, share of funds spent on scientific research, etc.);
■ innovation indices (the level of innovation activity in the region; the share of innovative enterprises operating in the region in the total number of enterprises; the share of innovative goods, works and services in the total volume of goods, works and services;);
■ social welfare indices (Gini coefficient; level of life expectancy in the region (health, income level, etc.); cultural indicator (museum, theater, concert, etc.).
3. Methodology
The World Bank presented the evaluation methodology of the Knowledge Index. From the three indices that make up the knowledge index in the methodology: education index (percentage of literacy of the mature population;
percentage of the population with secondary education; percentage of the population with higher education); innovation index (revenues from the sale of patents, licenses, etc.; number of applications for patents and trademarks; number of scientific and technical articles in specialized journals); information communication technologies index (number of phones and computers per 100 people; number of active Internet users (100 people)) is used. This index measures the country’s ability to produce and distribute knowledge on its territory [7, 17].
In [18], to measure the intellectual potential of the university, the author used three (number of doctors of sciences; total number of professors and teachers aged from 30 to 49; persons educated in leading research and university centers of the world) indicators of the intellectual potential of the teaching staff and eight indicators (number of articles in scientific journals indexed in Web of Science, Scopus databases; income from R&D works; number of master’s and doctoral students defending their dissertations; number of intellectual property objects registered in accounting; number of small innovation enterprises; share of R&D in total R&D, in %;
In [19], work was carried out on the evaluation of the activity of scientific organizations, science, and innovation activity. The author has carried out an expert assessment of innovation projects.
In the society and the knowledge economy, two areas of life, science and education, are important and become the leading productive force. Since Azerbaijan is included in the CIS area, the methodology proposed in [10] was used in the assessment of IP.
In the methodology proposed in [2], the indicator of two interrelated areas of the intellectual activity of the society, i.e.: science and education, was used to evaluate IP. The authors proposed measuring educational potential based on three indicators: 1) The general education level of the “mature” population (representing the principal part of the population who have completed their studies in educational institutions and are employed); 2) The specific weight of those studying in higher education institutions according to the population (per 10 thousand population); 3) Share of education expenditure in the gross domestic product (GDP). Therefore, EP index reflecting the potential of the educational sphere represents the numerical average value of these three indicators and is calculated using formula (1).
EP =
6 1 +6 2 +6 3
where e 1 - indicates general education level of the "mature" population, e2 - is specific weight of students in the total population (number of students per 10,000 population), e3 - is the index demonstrated the share of education costs in GDP.
In [2], the authors used two indicators in the creation of scientific potential: 1) the share of personnel working in the field of science and scientific services; 2) the share of expenditures on science in GDP. The scientific potential index (SP), which characterizes the general scientific potential of the country, expresses the numerical average value of these two indicators and is calculated using the following formula (2).
SP = £ 1 +£ 2
where s 1 - is the share of personnel in the field of science and scientific services, s2 - is the share of expenditures on science in GDP.
The integral index of intellectual potential (IP) is equal to the numerical average of the index of educational potential (EP') and the index of scientific potential (SP). The following formula (3) is used to calculate the integral index IP [2].
IP
EP+SP
4. Assessment
Today, Azerbaijan is prominent in the world not only as a country with rich natural resources but also as a country of innovations with high intellectual potential and the application of information and communication technologies. The state of Azerbaijan implementing the policy of European integration, is consistently interested in learning and applying the experience of leading countries of the world. We should note that the most significant factor influencing the formation of IP is the country's higher education, science, and scientific research system. To some extent, this is influenced by state funding (the state's budget for scientific research and education). In this section, a quantitative evaluation of IP was carried out based on the approach proposed in [10] on education and science in Azerbaijan. A number of indicators reflecting the state of education, science, and development level in the Republic of Azerbaijan according to the statistical collection of the State Statistics Committee of Azerbaijan (2017-2021) were used in the assessment of IP [20]. These indicators are listed in table 2.
Table 2. System of indicators for calculation of intellectual potential
|
Indicators |
2017 |
2018 |
2019 |
2020 |
2021 |
|
Gross domestic product (GDP) |
70337.8 |
80092.0 |
81896.2 |
72578.1 |
93203.2 |
|
Total number of employed population |
4822.1 |
4879.3 |
4938.5 |
4876.6 |
4988.2 |
|
Indicators on education |
|||||
|
Expenditures on education from the state budget (million manats) |
1742.8 |
1966.6 |
2285.9 |
2774.3 |
3092.2 |
|
Specific weight of students studying in higher education institutions by population (per 10 thousand population) |
171 |
179 |
189 |
199 |
211 |
|
The share of the expenditures allocated to education from the state budget in GDP (%) |
2.5 |
2.5 |
2.8 |
3.8 |
3.3 |
|
Indicators on science |
|||||
|
Expenditures for science from the state budget (million manats) |
109.8 |
117.8 |
122.3 |
143.6 |
151.8 |
|
The share of the expenditures allocated to science from the state budget in GDP (%) |
0.16 |
0.15 |
0.15 |
0.20 |
0.16 |
|
Number of personnel working in the field of science and scientific services (thousands) |
73.5 |
74.3 |
74.5 |
72.9 |
73.5 |
|
From them: |
|||||
|
Doctor of sciences (thousands) |
1.414 |
1.415 |
1.466 |
1.433 |
1.351 |
|
Ph.D. (thousands) |
6.243 |
6.137 |
6.218 |
5.819 |
6.302 |
Note: The table was compiled based on the materials of the State Statistics Committee of Azerbaijan,
The dynamics of expenditures on science and education from the state budget and their share in GDP for 20172021 are illustrated in the following graphs (Figure 2 and Figure 3).
—*—Expenditures allocated to science from the state budget
—•— Expenditures allocated to education from the state budget
|
3500 3000 2500 2000 1500 1000 500 0 |
г- о °° 40 оо ' п л ■ ? 2 - ОО °О ^ КО оо Ок ^ г*0 < О ^ 2 ^ ^ ▲ ^ * 1 'I 2017 2018 2019 2020 2021 |
Fig. 2. Expenditures on education and science from the state budget (million manats)
—■— The share of the expenditures allocated to education from the state budget in GDP
—*— The share of the expenditures allocated to science from the state
2017 2018 2019 2020 2021
Fig.3. The share of expenditures allocated to education and science from the state budget in GDP (%)
As seen from Figure 2, the expenditures allocated to education and science from the state budget for 2017-2021 have been dynamically increased. In Figure 3, the share of education expenditures in GDP is the same for 2017-2018, an increase for 2019-2020, and a decrease for 2021. The share of expenditures allocated to science in GDP decreased in 2018-2019, increased in 2020 and decreased in 2021.
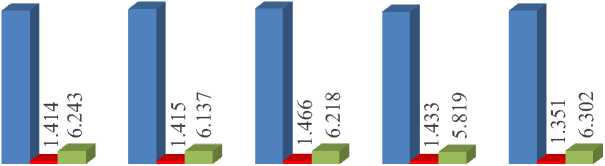
The dynamics of those working in the field of science and scientific services, including doctors of science and doctors of philosophy, for 2017-2021 are shown in the graph below.
80.0 73.5
60.0
40.0
20.0
0.0
74.5
74.3
73.5
72.9
number of personnel working in the field of science and scientific services (thousands)
Ph.D. (thousands)
Fig.4. Changes in the number of workers in the field of science and scientific services, including doctors of science and doctors of philosophy (20172021)
As can be seen from the graph, there are increases and decreases in the dynamics of workers in the field of science and scientific services. In 2021, the number of doctors of science decreased by 63 people compared to 2017, and the number of doctors of philosophy increased by 59 people.
The measurement of educational potential is calculated on the basis of indicators of average duration of education and expected duration of education, which are components of the HDI since 2010. The value of the e 1 indicator, which expresses the level of education, was calculated by the following formula using the database [4, 21] for the years 20172021:
e 1 = (((MYS/15) + (£-rS/18))/2 )
where, e 1 - is an education index, MYS - is a mean years of schooling, EYS - is the expected years of schooling [6, 21].
The value of the e2 indicator is calculated by the following formula (5):
actual value—minimum value
e2 = ~ „. „, ; _, ,. „, ;
maximum value—minimum value
Here, the actual price is given in table 1 on the specific weight of students in the total population (the number of students per 10,000 population). The minimum value is defined as the smallest possible values that can be obtained for these indicators (in this case, they are taken as 0), the maximum value is the highest value (230) for these indicators.
The s 1 indicator represents the specific weight of personnel working in the field of science and scientific services in the total number of the employed population. The indicator s2 is the share of expenditures allocated to science in GDP.
EP (education potential index), SP (scientific potential index) was calculated based on formula (1) and (2), IP integral index was calculated based on formula (3).
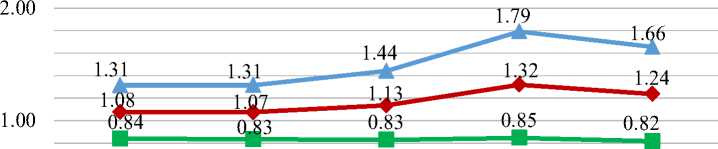
The results of our calculations are shown in Table 2. The chart of indices characterizing intellectual potential for 2017-2021 is presented in figure 4.
0.00
2017 2018 2019 2020 2021
EP -educational index of intellectual potential
SP - science index of intellectual potential IP -integral index of intellectual potential
Fig. 5. Dynamics of indices characterizing intellectual potential (2017-2021)
Table 3. Indicators used in science and education assessment.
|
2017 |
2018 |
2019 |
2020 |
2021 |
|
|
Indicators |
|||||
|
e 1 |
0.72 |
0.71 |
0.71 |
0.69 |
0.73 |
|
e 2 |
0.74 |
0.78 |
0.82 |
0.87 |
0.92 |
|
e 3 |
2.48 |
2.46 |
2.79 |
3.82 |
3.32 |
|
s 1 |
1.52 |
1.52 |
1.51 |
1.49 |
1.47 |
|
s 2 |
0.16 |
0.15 |
0.15 |
0.20 |
0.16 |
|
İndexes |
|||||
|
EP |
1.31 |
1.31 |
1.44 |
1.79 |
1.66 |
|
SP |
0.84 |
0.83 |
0.83 |
0.85 |
0.82 |
|
IP |
1.08 |
1.07 |
1.13 |
1.32 |
1.24 |
As seen from Figure 4, EP, SP and IP indices an increase for 2019-2020, and a decrease for 2021. There are objective and subjective reasons for this. The objective reason is the decrease in GDP due to the restrictions imposed due to the COVID-19 and the reduction of oil production within the framework of the OPEC+ agreement. The subjective reason is related to the problems in education and science.
Brain drain is one of the factors that negatively affects the quantity and quality of intellectual potential [22].
5. Conclusion
Research shows that multiple indicators are needed to quantify IP adequately. In developed countries, efforts are being made to establish and constantly update the system of indicators used to measure educational and scientific activity, which are considered the main elements of IP. As mentioned above, there are a large number of methodologies proposed by different countries and researchers in the field of measuring intellectual potential. We have conducted an evaluation of IP in the sphere of science and education using the methodology proposed in [2]. From the results of the research, it became clear that the development of the national IP of the country is the expenses allocated to science and education from the state budget, the share of expenses allocated to science and education from the state budget in the GDP, the specific weight of those working in the field of science and scientific services in the total number of the employed population, the number of students studying in higher education institutions it depends on indicators such as specific weight per population (per 10 thousand population). However, statistical methods applied to IP analysis and assessment are not sufficient. Although in recent years, scientists have mainly been focused on the effective usage of IP in the national economy, today there is no unified opinion on the methods of IP evaluation. Therefore, there is a need to develop IP utilization mechanisms in order to improve IP assessment and efficiency.
The main subject of our future research is the development of new assessment methodologies at the macro, meso, and micro levels, considering the country's national characteristics and benefiting from international experience. It will allow the adoption of optimal decisions for the development of the country's intellectual potential.
References Assessment Methodology of Intellectual Potential
- M. Sh Hajirahimova, M. I. Ismayilova, “Analysıs of ıntellectual potentıal measurement ındıcators,” Problems of Information Society, vol. 14, no. 1. pp. 53-65, 2023, doi:10.25045/jpis.v14.i1.06.
- V. K. Levashov, “The Intellectual Potential of Society: Sociological Measurement and Forecasting,” Psychological Science and Education,” vol. 14, no. 4, pp. 41-49, 2009.
- M. Sh .Hajirahimova, “Theoretical and methodological aspects of intellectual potential assessment. The ınformatıon systems and technologıes: achıevements and perspectıves,” III INTERNATIONAL SCIENTIFIC CONFERENCE, Sumgait. SDU, 2022, pp. 307-309.
- Human Development İndex (HDİ). 2021. Available at: https://www.unesco.org/en/world-media-trends/human-development-index-hdi
- Human development report 2021-2022. Available at: https://hdr.undp.org/data-center/human-development-index#/indicies/HDI
- Human Development Report 2021-2022 - Uncertain Times, Unsettled Lives - Shaping our Future in a Transforming World. Available at: https:// HumanDevelopment Report 2021-2022 Uncertain Times, Unsettled Lives Shaping Future Transforming World.pdf
- Indicators. 2023. Available at: https://data.worldbank.org/indicator
- P.Drucer, “The New Society of Organizations,” Harvard Business Review, 1992.
- L. Edvinsson, M. Malone, “New York: Intellectual Capital”, Harper Business, 1997, p.225.
- J, David Skyrme, “Measuring Knowledge: A Plethora of Methods,” David Skyrme Associates, 2007. Available at: http://www.skyrme.com/insights/24kmeas.htm 6. 3
- G. V. Leonidova, “Intellectual potential of population: theoretical and methodological framework for research,” The journal Economic and social changes: facts, trends, forecast, vol. 1, no. 31, pp. 43-58, 2014, doi:10.15838/esc/2014.1.31.6.
- B. Bec, “Moč intelektualnega kapitala,” 2014. Available at:http://www.poslovnisvet.si/vodenje/moc-intelektualnega-kapitala
- A. B. Doktorovich, “Sociological analysis and methodology for assessing the development of intellectual potential,” News of Moscow Univ, no. 1, pp. 143-154, 2012.
- M. Tanaka, “Japanese-style evaluation systems for R&D projects: The MITI experience,” Research Policy, vol. 18, no. 6, pp. 361–378, 1989.
- F. Kodama, F. Niwa, “Structure Analysis of the Japanese Science and Technology Indicator System and its Evaluation,” Journal of Science Policy & Research Management, vol. 2, no. 2, pp. 173-183, 1987.
- D. M. Kangalakova, D.A. Rakhmetova, “Assessment of the intellectual potential of regions: methodological foundations of the study,” The Journal of Economic Research & Business Administration, vol. 135, no. 1, 2021, doi:10.26577/be.2021.v135.i1.07.
- K.A. Zadumkin, I.A. Kondakov, “Methodology for comparative assessment of the scientific and technical potential of the region,” Innovative development, vol. 4, no. 12, pp. 86- 100, 2010.
- G.Garafiyeva, “Intellectual potential of higher education institution: measurement technique”, BUKEP Bulletin, no. 1, pp. 353-358, 2014.
- A. D. Hüseynova, “SCIENCE AND INNOVATION ACTIVITY: measurement and evaluation”, Baku: TUNA, 2020, 374 p.
- Education, science and culture in Azerbaijan. Available at: https://www.stat.gov.az
- Education Index. Available at: https://en.wikipedia.org/wiki/Education_Index#cite_note-4
- M. Sh. Hajirahimova, A. S. Aliyeva, “Migration problems of intellectual human resources: Impact of brain drain on national security.” Proc. of the International Scientific Conference of Educational and scientific activity in a new time: Realities and challenges, Mingachevir, vol. 2, 16-17 dec., 2022, pp. 70-73.
