Attainment Calculations of Course Outcomes, Program Outcomes and Program Specific Outcomes for Digital Circuits and Systems

Author: S. Senthilkumar, V. Mohan, T. Senthil Kumar, L. Ramachandran, M. Nuthal Srinivasan
Journal: International Journal of Education and Management Engineering @ijeme
Article in issue: 5 vol.14, 2024.
Free access
The modern world looks for employable graduates from the outcome based educational institutions. Outcome based education (OBE), creates competitive graduates who can reasonable in world wide. Due to this, now a day’s many educational institutions are starts to implement OBE instead of traditional educational system. OBE has gained much impetus in the education system. With no specific methods of teaching or performance assessment, the outcomes are built on scalability, accuracy, and real-time data. Studies say that OBE increases student centric learning instead of teacher centric. This helps the institutions in accreditations like national board of accreditation (NBA), national assessment and accreditation council (NAAC) etc. Recently some countries are accepted graduates for employment only from the NBA accredited programs. Course outcomes (CO’s), program outcomes (PO’s) and program specific outcomes (PSO’s) are the key terms in OBE. This article provides the course plan, attainment calculation of CO’s, Po’s and PSO’s. Here, author’s considered digital circuits and systems (DCS) as a sample course from undergraduate Electronics and Communication Engineering program. The DCS course considered here have 5 CO’s in apply level (K3). In order to calculate the attainment of CO’s, PO’s and PSO’s, first the mapping of CO’s with PO’s and PSO’s are presented. Then different direct assessment (Formative and Summative) tools like internal tests, assignment, quiz and end semester examinations and indirect assessment tools like course end survey are conducted to evaluate the attainment level of 5 course outcomes. Based on the performance of 128 students, attainment of CO’s are calculated first. PO’s and PSO’s attainment are calculated from the CO’s attainment. From the calculated attainment values suggestions/proposals are made for the upcoming semester.
Outcome based education, Accreditation, Course outcomes, Program outcomes, Program specific outcomes, Attainment calculations
Short address: https://sciup.org/15019484
IDR: 15019484 | DOI: 10.5815/ijeme.2024.05.04
Text of the scientific article Attainment Calculations of Course Outcomes, Program Outcomes and Program Specific Outcomes for Digital Circuits and Systems
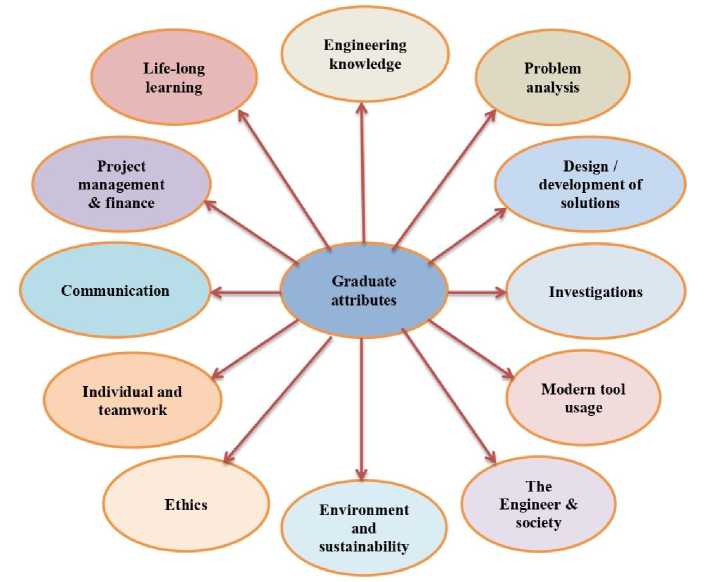
Recent year’s rapid revolution takes place in the field of education. Various educational institutions are starts to implement OBE for the betterment of graduates from their institutes for the successful transformation from student to employee instead of simple graduate. Due to the more number of graduates availability, the employment become a question mark in the competitive world. Worldwide opportunity is always there for well qualified graduates those who are fulfil the employer requirement. OBE plays a crucial role to create well-qualified, skilled graduates [1-8]. Also proper implementation of OBE shows a remarkable role in various accreditations process like NBA and NAAC. CO’s, PO’s, Program Educational Objectives (PEO’s) and PSO’s are the key components in OBE. CO’s represents the learning outcomes of the individual course. If a program has ‘n’ number of courses means, all the courses have their own course outcome written by the concern course handling faculty member. Normally a course may have 4 to 8 course outcomes. PO’s are the expected outcomes from the graduates at the end of the program. Washington Accord suggested 12 PO’s globally [9] as shown in figure 1. PSO’s indicates the specific outcomes of a particular program. A program may have 2 to 5 PEO’s.
Communication
Investigations
Ethics
Life-long learning
Engineering knowledge
Graduate attributes
Problem analysis
Individual and teamwork
Design / development of solutions
The
Environment and sus tain ability
Modern tool usage
Fig. 1. Graduates attributes of undergraduate Engineering program
During the conduction of a course, different tools are used for assessing the student’s performance in all course outcomes. Normally two types of assessments are made namely direct [10,11] and indirect assessment [12]. Assessment tools like tests comes under summative assessment, quiz, assignment, sketch representations group discussions are comes under formative assessment while course end survey is considered as an indirect assessment tool for course outcome attainment calculation. Attainment of PO’s and PSO’s are calculated from CO attainment as direct assessment tool and alumni survey, exit survey and employer feedbacks are considered as indirect assessment tool. This article is structured as chapter 2 deals with course outcomes, chapter 3 shows the CO-PO mapping and CO-PSO mapping. Chapter 4 shows the assessment methods used in this course. Finally conclusion is presented in chapter 5.
2. Course Outcomes
CO’s are the expected output from the students after end of the course. Different courses may have different number of CO’s with different knowledge levels. Based on Revised Bloom Taxonomy, 6 types of knowledge levels are presented as Remember (K1), understand (K2), apply (K3), analyse (K4), evaluate (K5), and create (K6) as shown in figure 2. In this article, authors considered DCS as a sample course from Electronics and Communication Engineering undergraduate program from an institution in Tamil Nadu, India. This course contains 5 CO’s in apply (K3) level as shows in table 1.
Table 1. CO’s of DCS.
|
CO |
Competency |
Cognitive level |
|
CO.1 |
Experiment Boolean functions using Boolean algebra, K-map and QM method. |
Apply (K3) |
|
CO.2 |
Design different combinational circuits using logic gates. |
Apply (K3) |
|
CO.3 |
Develop various synchronous and asynchronous sequential circuits using logic gates and flip flops. |
Apply (K3) |
|
CO.4 |
Design programmable logic devices using logic gates. |
Apply (K3) |
|
CO.5 |
Simulate HDL programs for combinational and sequential circuits. |
Apply (K3) |
Content of this course is prepared based on the above mentioned CO’s. Previous year course end report of the same course also considered while preparing course plan. Course end report reflects the performance of the students in all the CO’s. Course plan is a major component in OBE that shows the action plan for a course for successful implementation. Course plan are prepared in order to attain the course outcomes in a successful way. In course plan, a course instructor may include different teaching pedagogy like teacher-centric, student-centric, laboratory based learning, group instruction, project based learning, flipped classroom etc., for the betterment of learners. Table 2 gives the sample lesson plan of DCS for one module it consists of number of hours needed for the syllabus coverage and gives the information about teaching methodology.
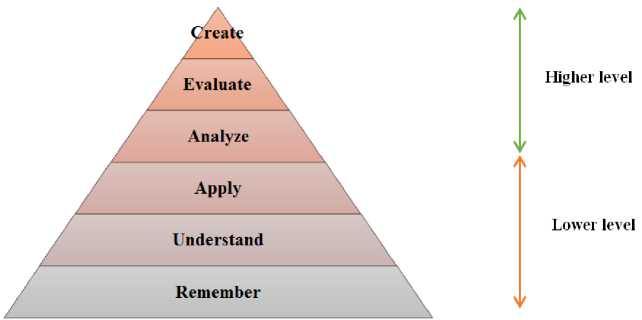
Fig. 2. Bloom’s Taxonomy knowledge levels
Table 2. Sample course plan
|
S. No. |
Topic(s) |
Hours |
Teaching Method |
|
Module – I BOOLEAN ALGEBRA AND LOGIC GATES: |
|||
|
CO1 -Minimize the given Boolean functions using Boolean algebra, K-map and QM method. |
|||
|
1 |
Review of Number system |
1 |
Lecture with discussion |
|
2 |
DE Morgan’s theorem - Principle of Duality-Boolean expression |
1+3 |
Lecture with discussion and Laboratory experiment |
|
3 |
Minimization of Boolean expressions |
1 |
Lecture with discussion |
|
4 |
Minterm–Maxterm-Sum of Products (SOP)–Product of Sums (POS) |
1 |
Lecture with discussion |
|
5 |
Karnaugh map |
1 |
Lecture with discussion |
|
6 |
Implementation of Boolean functions using Tabulation method |
1 |
Lecture with discussion and assignment |
|
7 |
Implementation of Boolean functions using logic gates: NAND – NOR |
1 |
Lecture with discussion |
|
8 |
Multi-level gate implementations - Multioutput gate implementations |
1 |
Lecture with discussion |
|
9 |
TTL and CMOS Logic and their characteristics –Tristate gates |
1 |
Lecture with discussion |
|
Total Number of hours for Unit I: |
12 (LH-09, TH-00, PH-03) |
||
3. CO-PO and CO-PSO Mapping
Twelve program outcomes are available in the literature according to Washington Accord namely PO1 to PO12. Department of Electronics and Communication Engineering of the considered institute have two PSO’s as mentioned below.
After the successful completion, the graduates will be able
PSO1: To design, develop and implement microelectronic devices, embedded systems and their potential applications.
PSO2: To design systems to solve contemporary issues of wireless communication systems, High Speed Networking and RF applications
The mapping between 5 CO’s of the DCS with 12 PO’s and 2 PSO’s are listed in the following table3. It gives the correlation between each CO’s and PO’s and PSO. Table 4 gives the justification for the correlation between each CO’s and PO’s and PSO.
Table 3. Mapping of CO’s with PO’s and PSO’s
|
Comp. |
PO1 |
PO2 |
PO3 |
PO4 |
PO5 |
PO6 |
PO7 |
PO8 |
PO9 |
P1O |
PO11 |
PO12 |
PSO1 |
PSO2 |
|
CO1 |
3 |
2 |
2 |
1 |
- |
- |
- |
- |
1 |
- |
1 |
3 |
3 |
- |
|
CO2 |
3 |
2 |
2 |
1 |
- |
- |
- |
- |
1 |
- |
1 |
2 |
3 |
- |
|
CO3 |
3 |
2 |
2 |
1 |
- |
- |
- |
- |
1 |
- |
1 |
3 |
3 |
- |
|
CO4 |
3 |
2 |
2 |
1 |
- |
- |
- |
- |
1 |
- |
1 |
2 |
3 |
- |
|
CO5 |
3 |
2 |
2 |
1 |
3 |
- |
- |
- |
1 |
- |
1 |
3 |
3 |
- |
|
Average |
3 |
2 |
2 |
1 |
3 |
- |
- |
- |
1 |
- |
1 |
2.6 |
3 |
- |
Table 4. CO-PO-PSO Justification
|
CO No. |
PO/ PSO |
CL |
Justification |
|
CO1 |
PO1 |
3 |
Strongly mapped as students will apply engineering fundamentals to identify technical domain. |
|
PO2 |
2 |
Moderately mapped as students identify mathematical algorithmic knowledge that applies to a given problem. |
|
|
CO2 |
PO1 |
3 |
Strongly mapped as students will apply engineering fundamentals to identify technical domain. |
|
PO2 |
2 |
Moderately mapped as students identify mathematical algorithmic knowledge that applies to a given problem. |
|
|
CO3 |
PO1 |
3 |
Strongly mapped as students will apply engineering fundamentals to identify technical domain. |
|
PO2 |
2 |
Moderately mapped as students identify mathematical algorithmic knowledge that applies to a given problem. |
|
|
CO4 |
PO1 |
3 |
Strongly mapped as students will apply engineering fundamentals to identify technical domain. |
|
PO2 |
2 |
Moderately mapped as students identify mathematical algorithmic knowledge that applies to a given problem. |
|
|
CO5 |
PO5 |
3 |
Moderately mapped as students identify modern engineering tools, techniques and resources for engineering activities, identify the strengths and limitations of tools for (i) acquiring information, (ii) modelling and simulating, (iii) monitoring system performance, and (iv) creating engineering designs. |
4. Assessment Methods
Different assessment methods are available in the literature to assess the knowledge of the students. Assessment can be done in two methods namely direct assessment and indirect assessment. Continuous Assessment Test (CAT), assignment, quiz, seminar, debates, and end semester examination are the some of the examples for direct assessment whereas different surveys like course end survey, alumni exit survey, employer survey are some examples of indirect assessment. In DCS course, for direct assessment CAT, assignment, quiz, and end semester examination are conducted as direct assessment and course end survey is conducted as indirect assessment tool. Three CAT (CAT1, CAT2, and CAT 3), two assignments, one quiz, and end semester exams are conducted to assess the performance of students in DCS directly. One course end survey is conducted at the end of the course as indirect assessment. Table 5 summarize the mark distribution based on different Bloom’s level. Since all the 5 CO’s in apply level, more weightage given to apply level questions in internal and end semester examination. Table 6 show the internal mark calculation for the DCS course. The marks scored in the CAT1, CAT2, CAT3 are considered and it will be converted to 30 marks added with activity 10 marks finally got the internal of 40 marks.
Table 5. Mark distribution in CAT 1, CAT 2 and CAT 3
|
BLOOM’S LEVEL |
CAT 1 |
CAT 2 |
CAT 3 |
|
Remember |
6 |
16 |
16 |
|
Understand |
26 |
36 |
28 |
|
Apply |
68 |
48 |
56 |
|
Analyze |
- |
- |
- |
|
Evaluate |
- |
- |
- |
|
Create |
- |
- |
- |
Table 6. Internal mark calculation
|
CAT - 1 |
100 |
|
CAT - 2 |
100 |
|
CAT - 3 |
100 |
|
ACTIVITY (Assignment 1 & 2) |
10 |
|
TOTAL |
Sb10-40 |
Attainment Calculation:
To calculate the attainment of DCS, performance of the students in three CAT exams, 2 assignments, one quiz, and end semester marks are considered as direct assessment and course end survey is considered as indirect assessment. All the marks are collected in a excel sheet in CO-wise. Expected percentage of marks and percentage of students are fixed as two benchmark values based on the previous year course end report. Here, 70% of total marks are considered as bench mark for attainment and 60% of students are expected to get the 70% of marks in all the five CO’s. Figure 3 shows the flow chart for CO attainment calculations. Performance of student’s in CAT 1, CAT 2, CAT 3, end semester exam, assignments, and course end survey and cumulative CO-wise marks are tabulated in tables 7 to 13 respectively. Table 7 gives the question wise and CO-wise marks secured by the students in CAT1 examination.
Table 7. Performance of the student’s in CAT 1 exam
|
Question number |
1 |
2 |
3 |
4 |
5 |
6 |
7 |
8 |
9 |
10 |
11 |
12 |
13 |
14 |
15 |
16 |
|
CO number |
1 |
1 |
1 |
1 |
1 |
1 |
1 |
1 |
1 |
1 |
1 |
1 |
1 |
1 |
1 |
1 |
|
Max marks |
2 |
2 |
2 |
2 |
2 |
2 |
2 |
2 |
2 |
2 |
12 |
12 |
12 |
12 |
12 |
20 |
|
E17ECR001 |
1 |
2 |
1 |
1 |
1 |
1 |
2 |
1 |
2 |
2 |
8 |
6 |
7 |
8 |
8 |
12 |
|
E17ECR002 |
2 |
2 |
2 |
2 |
2 |
2 |
2 |
2 |
2 |
2 |
12 |
12 |
12 |
12 |
12 |
19 |
|
E17ECR003 |
2 |
2 |
2 |
2 |
2 |
2 |
2 |
2 |
2 |
2 |
12 |
12 |
11 |
11 |
12 |
17 |
|
E17ECR004 |
2 |
2 |
1 |
0 |
0 |
2 |
2 |
0 |
1 |
2 |
12 |
12 |
12 |
11 |
10 |
17 |
|
E17ECR005 |
2 |
2 |
0 |
1 |
2 |
0 |
2 |
0 |
1 |
1 |
12 |
11 |
11 |
8 |
8 |
17 |
|
E17ECR006 |
1 |
1 |
1 |
2 |
1 |
2 |
2 |
2 |
2 |
1 |
12 |
12 |
12 |
5 |
12 |
15 |
|
E17ECR007 |
2 |
2 |
2 |
2 |
2 |
2 |
2 |
2 |
2 |
2 |
10 |
10 |
2 |
11 |
10 |
17 |
|
E17ECR008 |
2 |
1 |
1 |
0 |
2 |
1 |
2 |
0 |
0 |
0 |
7 |
5 |
10 |
12 |
12 |
19 |
|
E17ECR009 |
1 |
2 |
1 |
2 |
2 |
1 |
2 |
1 |
2 |
2 |
7 |
8 |
8 |
10 |
2 |
12 |
|
E17ECR010 |
2 |
2 |
1 |
2 |
0 |
2 |
1 |
0 |
2 |
1 |
12 |
12 |
12 |
5 |
10 |
13 |
Table 8. Performance of the student’s in CAT 2 exam
|
Question number |
1 |
2 |
3 |
4 |
5 |
6 |
7 |
8 |
9 |
10 |
11 |
12 |
13 |
14 |
15 |
16 |
|
CO number |
2 |
2 |
2 |
2 |
2 |
3 |
3 |
3 |
3 |
3 |
2 |
2 |
2 |
3 |
3 |
3 |
|
Max marks |
2 |
2 |
2 |
2 |
2 |
2 |
2 |
2 |
2 |
2 |
12 |
12 |
12 |
12 |
12 |
20 |
|
E17ECR001 |
1 |
2 |
2 |
1 |
2 |
2 |
1 |
0 |
2 |
1 |
12 |
11 |
11 |
12 |
8 |
12 |
|
E17ECR002 |
1 |
2 |
0 |
2 |
1 |
2 |
2 |
1 |
2 |
1 |
12 |
12 |
11 |
10 |
12 |
19 |
|
E17ECR003 |
1 |
2 |
1 |
2 |
2 |
2 |
1 |
2 |
2 |
1 |
11 |
11 |
8 |
8 |
12 |
17 |
|
E17ECR004 |
2 |
2 |
1 |
2 |
1 |
2 |
1 |
1 |
2 |
0 |
7 |
7 |
5 |
12 |
10 |
17 |
|
E17ECR005 |
2 |
2 |
0 |
2 |
1 |
2 |
1 |
1 |
1 |
0 |
12 |
12 |
11 |
10 |
8 |
17 |
|
E17ECR006 |
1 |
2 |
0 |
2 |
1 |
2 |
2 |
0 |
2 |
0 |
12 |
12 |
12 |
12 |
12 |
15 |
|
E17ECR007 |
2 |
2 |
0 |
2 |
2 |
2 |
1 |
2 |
0 |
1 |
12 |
12 |
11 |
10 |
10 |
17 |
|
E17ECR008 |
1 |
1 |
0 |
2 |
1 |
2 |
1 |
0 |
2 |
0 |
12 |
12 |
12 |
12 |
12 |
19 |
|
E17ECR009 |
0 |
1 |
0 |
2 |
1 |
2 |
2 |
2 |
2 |
1 |
0 |
10 |
10 |
2 |
2 |
12 |
|
E17ECR010 |
2 |
0 |
0 |
0 |
1 |
1 |
2 |
2 |
1 |
2 |
10 |
7 |
5 |
10 |
10 |
13 |
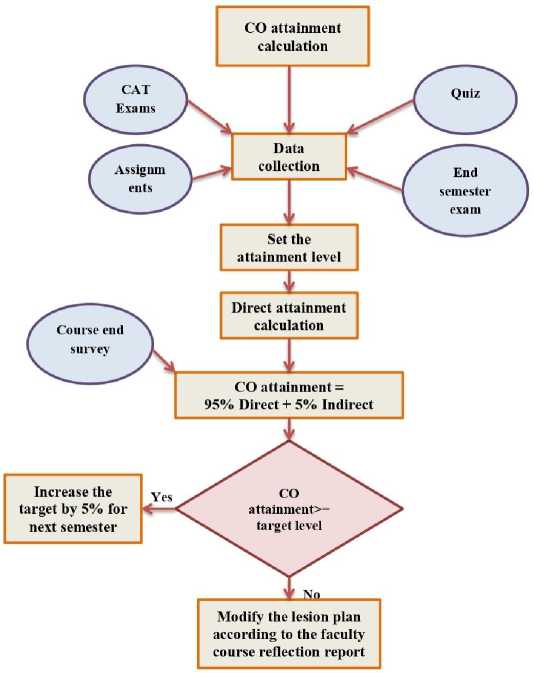
Fig. 3. CO attainment calculation flow chart
Table 9. Performance of the student’s in CAT 3 exam
|
Question number |
1 |
2 |
3 |
4 |
5 |
6 |
7 |
8 |
9 |
10 |
11 |
12 |
13 |
14 |
15 |
16 |
|
CO number |
4 |
4 |
4 |
4 |
4 |
4 |
5 |
5 |
5 |
5 |
3 |
3 |
4 |
5 |
5 |
4 |
|
Max marks |
2 |
2 |
2 |
2 |
2 |
2 |
2 |
2 |
2 |
2 |
12 |
12 |
12 |
12 |
12 |
20 |
|
E17ECR001 |
2 |
2 |
2 |
2 |
2 |
2 |
2 |
2 |
2 |
1 |
8 |
6 |
7 |
8 |
8 |
12 |
|
E17ECR002 |
2 |
2 |
2 |
2 |
0 |
2 |
1 |
2 |
2 |
1 |
12 |
12 |
12 |
12 |
12 |
20 |
|
E17ECR003 |
2 |
2 |
2 |
2 |
0 |
2 |
2 |
2 |
2 |
1 |
12 |
12 |
11 |
11 |
12 |
17 |
|
E17ECR004 |
2 |
2 |
2 |
2 |
2 |
2 |
2 |
2 |
2 |
0 |
12 |
12 |
12 |
11 |
10 |
8 |
|
E17ECR005 |
2 |
1 |
2 |
2 |
2 |
2 |
1 |
2 |
2 |
0 |
12 |
11 |
11 |
8 |
8 |
8 |
|
E17ECR006 |
2 |
2 |
2 |
2 |
0 |
2 |
2 |
1 |
0 |
0 |
12 |
12 |
12 |
5 |
12 |
7 |
|
E17ECR007 |
1 |
2 |
1 |
2 |
1 |
2 |
0 |
2 |
2 |
1 |
10 |
10 |
2 |
11 |
10 |
17 |
|
E17ECR008 |
1 |
0 |
0 |
2 |
0 |
2 |
0 |
2 |
2 |
0 |
7 |
5 |
10 |
12 |
12 |
19 |
|
E17ECR009 |
2 |
2 |
2 |
1 |
1 |
2 |
2 |
2 |
2 |
1 |
7 |
8 |
8 |
10 |
2 |
12 |
|
E17ECR010 |
2 |
1 |
2 |
2 |
2 |
2 |
2 |
2 |
0 |
1 |
12 |
12 |
12 |
5 |
10 |
13 |
Table 10. Performance of the student’s in end semester exam
|
Question number |
1 |
2 |
3 |
4 |
5 |
6 |
7 |
8 |
9 |
10 |
11 |
12 |
13 |
14 |
15 |
16 |
|
CO number |
1 |
1 |
2 |
2 |
3 |
3 |
4 |
4 |
5 |
5 |
1 |
2 |
3 |
4 |
5 |
5 |
|
Max marks |
2 |
2 |
2 |
2 |
2 |
2 |
2 |
2 |
2 |
2 |
12 |
12 |
12 |
12 |
12 |
20 |
|
E17ECR001 |
2 |
2 |
2 |
2 |
0 |
2 |
1 |
2 |
2 |
1 |
12 |
12 |
12 |
12 |
12 |
20 |
|
E17ECR002 |
2 |
2 |
2 |
2 |
0 |
2 |
2 |
2 |
1 |
1 |
8 |
8 |
8 |
6 |
6 |
17 |
|
E17ECR003 |
2 |
2 |
2 |
2 |
2 |
2 |
2 |
2 |
2 |
0 |
12 |
12 |
12 |
11 |
10 |
8 |
|
E17ECR004 |
0 |
1 |
2 |
2 |
2 |
2 |
1 |
2 |
2 |
0 |
6 |
6 |
5 |
6 |
8 |
8 |
|
E17ECR005 |
2 |
2 |
2 |
2 |
0 |
2 |
2 |
2 |
1 |
1 |
8 |
8 |
8 |
6 |
6 |
17 |
|
E17ECR006 |
2 |
2 |
2 |
2 |
2 |
2 |
2 |
2 |
2 |
0 |
12 |
12 |
12 |
8 |
10 |
12 |
|
E17ECR007 |
2 |
2 |
2 |
2 |
2 |
2 |
2 |
2 |
2 |
2 |
12 |
12 |
11 |
8 |
8 |
16 |
|
E17ECR008 |
2 |
2 |
2 |
2 |
0 |
2 |
2 |
2 |
1 |
1 |
10 |
0 |
11 |
9 |
6 |
17 |
|
E17ECR009 |
2 |
2 |
2 |
2 |
0 |
2 |
2 |
2 |
2 |
1 |
8 |
8 |
8 |
7 |
6 |
12 |
|
E17ECR010 |
2 |
2 |
2 |
2 |
2 |
2 |
2 |
2 |
2 |
1 |
8 |
6 |
7 |
4 |
4 |
12 |
Table 11. Performance of the student’s in Assignments
|
Assignment number |
1 |
2 |
|
CO number |
4 |
5 |
|
Max marks |
25 |
25 |
|
E17ECR001 |
24 |
21 |
|
E17ECR002 |
25 |
20 |
|
E17ECR003 |
25 |
22 |
|
E17ECR004 |
20 |
20 |
|
E17ECR005 |
25 |
20 |
|
E17ECR006 |
20 |
20 |
|
E17ECR007 |
25 |
20 |
|
E17ECR008 |
25 |
24 |
|
E17ECR009 |
22 |
20 |
|
E17ECR010 |
25 |
20 |
Table 12. Student’s feedback in course end survey (Indirect assessment)
|
Question number |
1 |
2 |
3 |
4 |
5 |
|
CO number |
1 |
1 |
2 |
2 |
3 |
|
Max marks |
5 |
5 |
5 |
5 |
5 |
|
E17ECR001 |
3 |
5 |
4 |
4 |
5 |
|
E17ECR002 |
3 |
5 |
4 |
4 |
4 |
|
E17ECR003 |
4 |
5 |
5 |
5 |
5 |
|
E17ECR004 |
4 |
5 |
3 |
3 |
2 |
|
E17ECR005 |
5 |
5 |
3 |
3 |
5 |
|
E17ECR006 |
3 |
4 |
4 |
4 |
4 |
|
E17ECR007 |
3 |
4 |
4 |
4 |
5 |
|
E17ECR008 |
2 |
5 |
5 |
5 |
5 |
|
E17ECR009 |
5 |
3 |
3 |
3 |
5 |
|
E17ECR010 |
5 |
3 |
3 |
5 |
4 |
Table 13. Gives cumulative CO-wise marks calculated by consider CAT1, CAT2, CAT3 and Assignment marks.
Table 13. Consolidative CO-wise marks
|
CO number |
CO 1 |
CO 2 |
CO 3 |
CO 4 |
CO 5 |
|
Total (Max. Marks) |
116 |
87 |
92 |
85 |
93 |
|
70% of Total Marks |
81 |
61 |
64 |
60 |
65 |
|
E17ECR001 |
3 |
5 |
4 |
4 |
5 |
|
E17ECR002 |
3 |
5 |
4 |
4 |
4 |
|
E17ECR003 |
4 |
5 |
5 |
5 |
5 |
|
E17ECR004 |
4 |
5 |
3 |
3 |
2 |
|
E17ECR005 |
5 |
5 |
3 |
3 |
5 |
|
E17ECR006 |
3 |
4 |
4 |
4 |
4 |
|
E17ECR007 |
3 |
4 |
4 |
4 |
5 |
|
E17ECR008 |
2 |
5 |
5 |
5 |
5 |
|
E17ECR009 |
5 |
3 |
3 |
3 |
5 |
|
E17ECR010 |
5 |
3 |
3 |
5 |
4 |
The attainment calculation is made with direct and indirect assessment methods. In DCS, for calculating the attainment, 95% of weightage is given to direct assessment and 5% of weightage is given to indirect assessment. Table 14 summarizes the CO attainment calculation and attainment levels are illustrated in table 15. Figure 4 shows the attainment of direct assessment, indirect assessment and overall attainment.
Table 14. CO attainment calculation
|
CO1 |
CO2 |
CO3 |
CO4 |
CO5 |
|
|
Benchmark (Marks) % |
70 |
70 |
70 |
70 |
70 |
|
Total no. of students |
128 |
128 |
128 |
128 |
128 |
|
No. of students who got the above benchmark |
96 |
106 |
106 |
105 |
80 |
|
Direct attainment % |
75 |
83 |
83 |
82 |
63 |
|
Indirect Assessment % (Course End Survey) |
57.03 |
95.31 |
66.41 |
62.50 |
71.09 |
|
Course Attainment (95% direct + 5% indirect) |
74.10 |
83.44 |
81.99 |
81.05 |
62.93 |
|
Attainment level |
2.4 |
3 |
3 |
3 |
1.2 |
Table 15. Attainment level
|
>=60%-69% |
1-1.9 |
|
>=70%-79% |
2-2.9 |
|
>=80% |
3 |
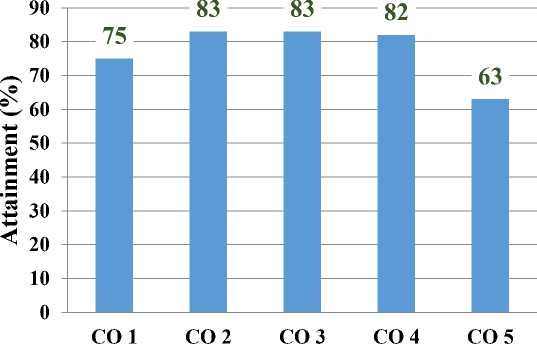
(a) Attainment from direct assessment
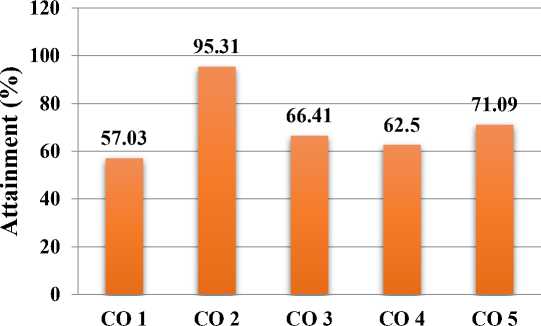
(b) Attainment from indirect assessment
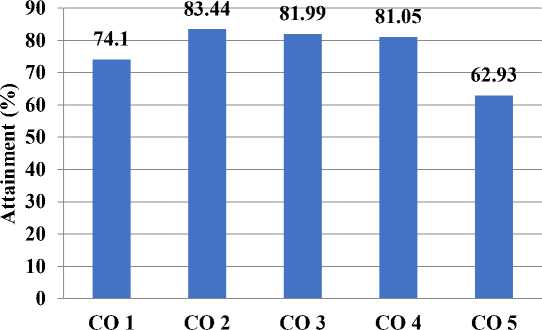
(c) Overall attainment
Fig. 4. Attainment of DCS
Table 16 shows the observation on course outcome attainment. Here 60% of students are expected to score more than 70% marks in all the 5 CO’s. Attainment levels are calculated based on the following assumptions.
60-69% = 1-1.9
70-79% = 2-2.9
>=80% = 3
Table 16. Observation on course outcome attainment
|
CO |
Benchmark (Marks)% |
Expected attainment of students |
Actual attainment of students (%) |
Attainment level |
Observation |
|
1 |
70 |
>=60 |
74.10 |
2.4 |
Moderate |
|
2 |
70 |
>=60 |
83.44 |
3 |
Substantial |
|
3 |
70 |
>=60 |
81.99 |
3 |
Substantial |
|
4 |
70 |
>=60 |
81.05 |
3 |
Substantial |
|
5 |
70 |
>=60 |
62.93 |
1.3 |
Low |
Faculty Reflective Report: Observations
^ Attainment of CO2, CO3, and CO4 are at a substantial level. The reasons are the performance of students in internal tests, assignments, quiz, and university exams are very good.
^ CO1 has an attainment level of 2.4. Student’s performance in CAT 1 especially in the tabulation method is not up to the level.
^ CO 5 has the lowest attainment of 62.93%. The reason for this is the performances of students in question number 14 and 15 of CAT 3 are poor. These questions are asked from HDL programming.
Faculty Reflective Report : Recommendations
^ Attainment of CO2, CO3 and CO4 are in substantial level. So, the existing teaching methods and assessment methods can be continued. Further the benchmark percentage may be increased from 60% to 65%.
^ Attainment level of CO1 is 2.4. Student’s performance in tabulation method is poor. So additional hours may be added for this topic. Assignment may be given on this topic to improve the student’s performance.
^ Attainment level of CO5 is 1.3. Student’s performance in HDL programming is poor. Extra hours may be given for practical sessions. Assignment may be given on this topic to improve the student’s performance.
PO attainment:
Figure 5 shows the PO attainment calculation procedure. Table 17 summarizes the attainment of PO’s and CO’s of DCS course. Like this, CO’s, PO’s, and PSO’s attainment calculation for all courses of a program needs to be calculated. From the attainment of all the courses of the program, overall PO’s attainment has to be calculated. For overall attainment calculation, different surveys like exit survey, alumni survey, employer survey, feedback on curriculum have to be considered. Based on the attainment level, the course handling faculty member may follow the same strategy in the next time of course handling or modify the strategies to improve the attainment level.
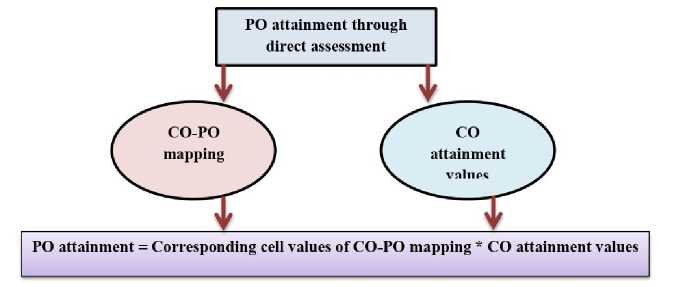
Fig. 5. Attainment calculation procedure
Table 17. Attainment of PO’s and PSO’s
|
Course Outcome |
PO1 |
PO2 |
PO3 |
PO4 |
PO5 |
PO6 |
PO7 |
PO8 |
PO9 |
PO10 |
PO11 |
PO12 |
PSO1 |
PSO2 |
|
CO1 |
2.4 |
1.6 |
1.6 |
1.0 |
- |
- |
- |
- |
- |
- |
- |
2.4 |
2.4 |
- |
|
CO2 |
3.0 |
2.0 |
2.0 |
1.0 |
- |
- |
- |
- |
- |
- |
- |
2.0 |
3 |
- |
|
CO3 |
3.0 |
2.0 |
2.0 |
1.0 |
- |
- |
- |
- |
- |
- |
- |
3.0 |
3 |
- |
|
CO4 |
3.0 |
2.0 |
2.0 |
1.0 |
- |
- |
- |
- |
- |
- |
- |
2.0 |
3 |
- |
|
CO5 |
1.2 |
2.0 |
0.8 |
0.4 |
1.2 |
- |
- |
- |
- |
- |
- |
1.2 |
1.2 |
- |
|
Average Attainment |
2.5 |
1.9 |
1.7 |
0.9 |
1.2 |
- |
- |
- |
- |
- |
- |
2.1 |
2.52 |
- |
5. Conclusion
In this article, attainment calculation of DCS is considered. DCS have five course outcomes. CO-PO and CO-PSO mapping of DCS is presented. Two types of assessment namely direct and indirect are considered for assessing the performance of the students. Three CAT (CAT1, CAT2, and CAT 3), two assignments, one quiz, and end semester exams are conducted to assess the performance of students in DCS directly. One course end survey is conducted at the end of the course as indirect assessment. Detailed attainment calculations are made. Finally, faculty reflection report is presented based on the attainment level. Outcome of this work indicates that all the educational institutions are expected to implement the OBE to make their students well fit to the requirement of the society.
References Attainment Calculations of Course Outcomes, Program Outcomes and Program Specific Outcomes for Digital Circuits and Systems
- Mayurappriyan, P. S., Loganathan, N., Shanmugapriya, M., Anbarasu, P., &Sakthi, P. K. A. (2021). Evolution of Outcome Based Engineering Education in India – A Case Study. 2021 7th International Conference on Advanced Computing and Communication Systems (ICACCS). doi:10.1109/icaccs51430.2021.9441676
- Hussain, W., Spady, W. G., Khan, S. Z., Khawaja, B. A., Naqash, T., & Conner, L. (2021). Impact Evaluations of Engineering Programs Using ABET Student Outcomes. IEEE Access, 9, 46166–46190. doi:10.1109/access.2021.3066921
- Rashima Mahajan, Dipali Bansa, Designing Performance Metrics and Rubrics to Assess Student Outcome Attainment in Engineering Project Design Course , 2021, https://doi.org/10.1177/00220574211032
- Arun Kumar, B. R. (2021). Value-Added Courses with industry endorsement for Bridging Curriculum Gap in the Outcome-Based Learning: An Effective Strategy to Post-graduate Studies. Journal of Education, 002205742097205. doi:10.1177/0022057420972056
- Lenin, N., Siva Kumar, M., &Selvakumar, G. (2021). Application of Conceive, Design, Implement and Operate (CDIO) Strategy for the Development of Engineering Education in Indian Perspective. Journal of Education, 002205742110164. doi:10.1177/00220574211016446
- Islam, A. (2019). Improving Educational Quality through Curriculum Development: An Empirical Investigation Using Stakeholder Feedback Data. Journal of Education, 002205741984837. doi:10.1177/0022057419848370.
- Zhu, J., Chen, J., McNeill, N., Zheng, T., Liu, Q., Chen, B., &Cai, J. (2018). Mapping Engineering Students’ Learning Outcomes from International Experiences: Designing an Instrument to Measure Attainment of Knowledge, Skills, and Attitudes. IEEE Transactions on Education, 1–11. doi:10.1109/te.2018.2868721
- Mitchell, J. E., Canavan, B., & Smith, J. (2010). Problem-Based Learning in Communication Systems: Student Perceptions and Achievement. IEEE Transactions on Education, 53(4), 587–594. doi:10.1109/te.2009.2036158
- Premalatha, K. (2019). Course and Program Outcomes Assessment Methods in Outcome-Based Education: A Review. Journal of Education, 002205741985435, pp. 1-17. doi:10.1177/0022057419854351.
- Jayarekha, P., &Dakshayini, M. (2014). Programme outcomes assessment by direct method. 2014 IEEE International Conference on MOOC, Innovation and Technology in Education (MITE). doi:10.1109/mite.2014.7020285
- Dargham, J. A., Chekima, A., Yin, R. C. K., & Wong, F. (2013). A direct assessment method of the achievement of the program outcomes from the courses outcomes. 2013 IEEE 5th Conference on Engineering Education (ICEED). doi:10.1109/iceed.2013.6908317
- Poornima, G., Bailey, K., Sujatha, K., &Meera, A. (2017). Assessment of Program Outcomes Using Direct and Indirect Methods. 2017 5th IEEE International Conference on MOOCs, Innovation and Technology in Education (MITE). doi:10.1109/mite.2017.00012
