Auto-oscillations of wires of high-voltage power lines (anchor span)
")
Author: Djamanbayev M. A., Karataeva J. E., Dzhumabekova Z. A.
Journal: Вестник Алматинского технологического университета @vestnik-atu
Section: Техника и технологии
Article in issue: 2 (127), 2020.
Free access
Dangerous rapprochement or whipping of wires in flight can be caused by dancing the wires. There fore, the distance between the wires and cables should be selected taking into account the expected intensities of the dancing wires. The purpose of this article is to determine the possible intense dancing of the split phase wires based on the self-oscillatory regime of the icy wires of the split phase at the anchor span. Investigations of the self-oscillating process were carried out by the Van Der Pol method. The research results can be used in the design of high-voltage power lines, studies of the phenomena of dancing and in the development of measures to protect lines from dancing wires.
Power line, wire dance, self-oscillations, equation of motion, degree of freedom, wind speed, dance intensity, stability
Short address: https://sciup.org/140250883
IDR: 140250883
Text of the scientific article Auto-oscillations of wires of high-voltage power lines (anchor span)
Dance is one of the most dangerous varieties caused by the wind of vibrations of icy wires of overhead lines (VL) [1]. When operating overhead lines for areas with frequent dancing of wires, it is necessary to provide measures to prevent overlapping of wires by increasing the distance between the wires (wires and cables), taking into account possible trajectories of movement of wires during dancing.
A number of works [1–11] have been devoted to assessing the possible intensities of dancing (the range of oscillations) depending on the parameters of the lines and weather conditions. These works are based on the analysis of long-term observational data on wire dancing on active lines and differ in the nature of the formulation of research problems and methods for solving them.
According to [2], the maximum range of
diameter and arrow of the wire sag was obtained with some restrictions on the span (30 < £ < 500) and wind speed (for single wires V ≤ 15 and for split phases V ≤ 10 ):
For single wires
A pk - pk = 80ln 8 f
d
50 d
For split phases
dance is estimated by the formula max
Y max
0,26 ⋅ V w f
where is the wind speed, is transverse frequency of the wire (Hz).
According to [7.8], the parameters make it most likely to determine
the that the
predisposition of the air line to the dance, as well as the possible amplitudes of the dance, are the parameter M'
M ′= 10,67 f ^ £
where f is the arrow of the wire sag, λ Γ is the length of the supporting string of insulators, £ - is the span.
According to the methodology, the amplitude of the dance is determined on the basis of a specially constructed nomogram. This technique applies to intermediate spans of overhead lines 110 and 220 kV with single wires.
The work [9] is devoted to assessing the maximum range of dancing of single wires and the split phase. On the basis of processing 166 observation data and additional experiments, the dependence of the maximum dance swing on the
Apk-pk =170ln 8f d 500d where Аpk-pkis the swing of the dance, d- is the diameter of the wire, f - is the arrow of the sag of the wire at 00С.
Similar works [10, 11] are devoted to estimating the maximum intensities of singlewave dancing based on the processing of longterm observational data. In these studies, when determining the maximum intensity of dancing, the main factor is not taken into account - the dependence of the intensities on the wind speed.
Objects and methods of research
The object of the study is high-voltage power lines (power lines). The subject of the study is the dance of wires of power lines on the anchor span.
The purpose of this article is based on the study of the self-oscillatory regime of the icy wires of the split phase (RF) on the anchor span, to determine the possible intensities of dancing of the wires of the split phase.
Research of the self-oscillating process is carried out by the van der Pol method.
Results and their discussion
With moderate winds, as a rule, the dance of the RF wires is characterized by insignificant (sometimes complete absence) torsional movements. For such cases, the mutual influence of torsional and linear (transverse) movements of the RF during dancing can be neglected and the oscillatory process without torsional movements can be considered.
In [12], a mathematical model of the wire dance of the RF power lines was obtained. The model takes into account two degrees of freedom - linear and torsional motion and is designed for the case when the points of attachment of the
wires to the supports are fixed (anchor span). If we exclude in this model the generalized coordinate of torsional motions, the initial
nonlinear system can be approximately reduced to a single equation with respect to linear displacement
a ( t ) + kxa ( t ) + k2a 3( t ) + о 2 a ( t ) + k3a 2 ( t ) + k4a 3 ( t ) + kX3 = 0 (1)
where the coefficients of equation (1) are determined by the following expressions:
p =HP • F - Cd n c d о . £=£V2b = gEF • b = gEF • b = g Pd n • b
P eep = 1,1 P 0 ; 9 o = ; 9 9 o V ; b l ^2 ; b 2 „ „4 ; b 3 = ; b 4
вер вер вер
4 b
;
П
A _ b 4 d n , ^ 2 _ n 2 gT b;. ; CO
5 R2 2 P eep ^"
С
1 +
k 3 = 3 n b 1 ; k 4 =
V n4 b
EFP -ep '^ 2 ) 2 n2 T3
. 7 _ ^to a b 4 ( C D 0 + C L 0 )
; k 1 =
П
—
b 4
r ; 2i Li; 1 ;
- • b
b С V
4 •
P eep I
Here a ( t ) — the generalized coordinate of linear displacement, p — air density, d n — characteristic profile size, g — gravity
aerodynamic
( 8 EFP eep 2^2 )
1+^A^t^
V 7
characteristics coefficients.
acceleration, V — wind speed, /
—
span, Е –
elastic modulus, F – wire cross-sectional area, T -wire tension, P 0 - weight of a unit length of wire, P ver - weight units of wire length taking into
account ice, 5 — splitting radius,
damping decrement, R
—
According to [13]: C D 0 = 1 ; C L 0 = 4 ; CLY = 12;
To study the dance of wires of the RFwith one degree of freedom, we write the nonlinear equation (1) in the normal Cauchy form. Introducing the notation a ( t ) = у 0 ; ) = уү , we obtain
У 0 = У 1
Where
To solve the
С L0 and С D0 are stationary
f ( У 0 , У 1 ) =
—
У1 +
V
k г k 1
У 3
nonlinear equation, we use
the approximate Van der Pol method [14]. According to the van der Pol method, we will seek solutions (3) in the form
-
У 0 ( t ) = А( t ) cos \ ° t + ^ ( t ) ] (3)
-
У 1 ( t ) = O Аt ) 8ІП [ ^ a t + ^ ( t ) ] (4)
Where А ( t ) is the average amplitude of the dance (unknown function of time), ^ ( t ) is the variable initial phase.
The average amplitude of the dance characterizes the arithmetic mean of the values of greater and lesser amplitude
F 1 ( A ) = — T1-
2no
F 2 ( A ) = —
У 1
k
+ / У 0 k 1
— O 2 у 0 + k 1 f ( у 0 , y 1 , t )
k4 з k 3)
"f y 0+ 73
k 1 k 1 /
Ar + Ан У А
A ( t ) = Н- = — 2 2
where А В is the large amplitude of the dance (moving the wire from static equilibrium to the highest position), А Н is the smaller amplitude of the dance (moving the wire from static equilibrium to the lower position), ΣА is the intensity of the dance of the wires
The intensity in the stationary mode of
dancing is determined by twice the amplitude.
У А = 2 A ( t ) = 2 А
2 n
J f ( y 0 , y 1 )sin p a p =
—
average
1 А 1 +
V
3 k2 o 2 ,2
—2—^ A 2
2 n^ A
2 n
J f ( У 0 , У 1 )СО8 pdp =
4 k 1 )
3 k 4 ^2
8 kY о
where в = to at + у
When calculating integrals (7) and (8), unknown functions of time and are considered constant А ( t ) = А и ^ ( t ) = у . We add the calculated values of the integrals to the shortened van der Pol equations
Make z = ^ 2A— =
A 2 dt
—
a
1 dz z 2 dt
replacement
dA = kF( A) = — k- A 1 + dt 2
3 k2 m2 ,2
—2- a- A
V
4 k
d ^ = kF ( A ) = ^ k^ A2 dt 12 8 ^
For the solution of (9), we explicitly multiply both sides of the equality by 2 А
and transform the equation taking into account the replacement
, 3 k2 to
d lz +
—------= k,dt
3 k2 toa 2 1
z + —2-^
4 k
The solution to the last equation has the form (in the final result, the substitution z=1/A 2 is taken into account)
f
dA
2 A — = — k A 1 + dt 1
3 k 2 Ю 2 л2
—2 a A1
V
4 k
һЛ +
A 2
3 k2 to2a
The constant integration of С initial conditions t= 0, A(0)=A0 ( A0 is deviation) has the value
1 3 k 2 ^ 2
А 02 4 k 1
= Ft + С ^ — = Ce k 1 t — 3 k2 to a
1 A 2 4 k
under the the initial
Taking into account constant integration, solution (9) has the form
A =± ._______ 3 k 1 A L
V (4 к 1 + 3 к 2 to a A o 2 ) ekt
— 3 k2 to 2 A 2
As t → ∞, the average amplitude of the wire dance tends to a constant value. Below, the transformations take into account the condition
k i < 0 at V > V H , where V H
—
the lower
critical speed at which the wire dance is excited
lim 4 k 1 A 02
t ^”V ( 4 к + 3 k2 roa 2 A )2 V 1 t — 3 k2 mQ 2 Ao 2
As follows from the last expression, no matter how small (much) the initial deviation А 0 , is, the amplitude of the dance over time will still monotonously approach a stationary value
Х А = 2
2 V 2 (
V ^ 2
V
Where V H kp
—
the lower critical speed at
which the wire dance is excited is determined by the formula
H
V kp
5toa Pep a вер
2VQ)І toa V
C +C
D 0 + LoL о
C L 1
(independent of the initial deviation). Thus, the intensity of dancing in a stationary mode according to (6) is determined by the expression
C D 0 + C L 0
CL 1
7V
—
H
V
We study the oscillatory process for stability at the equilibrium point [14]. The state of equilibrium is determined based on the condition F ( A ) = 0 . According to formula (7), we have two equilibrium states:
Ах = 0 and
4 k 3 V [ 2 5® a - П 4 ( C d 0 + C l о ) V ] '
3 k2 to ] 2 П4СЫ
Define the derived function F ( A )
By supplying А and А the values and dFM = -1 fi + 9‘-- A 2) dA 2 ( 4 k J
alternately in the expression (15), we have the stability condition
dF ( A ) dA
A = A 1
- 1 < 0 (equilibrium steady)
dF ( A )
dA
a = a 2
16 nb4C 4
< 8 nb4C 4
+ 27 k 2 to ^ V [ 25^, - n b 4 V ( C d 0 + C l 0 )] - k 1
From the last expression it follows that the equilibrium state А 2 is stable only under the condition
2 6Ю а, -n b 4 V ( C d 0 + C l 0 ) > 0
whence follows the value of the minimum wind speed at which the oscillatory process does not develop (formula 13)
V <_____ 5® aPeep _____
" 2 g p d n ( C D 0 + C l 0 )
Below are the comparisons of the calculation results performed according to formula (12) with the results of theoretical calculations at various wind speeds (Figure 1). Theoretical data are obtained on the basis of modeling a mathematical model in a Mathcad environment using the Runge-Kutta method.
The calculations were performed for wire grade ASO - 330/39 with the following characteristics: Young's modulus E = 7700 Dan / mm2; wire diameter dP = 24 mm; the crosssectional area of the wire F = 339.6 mm2; weight unit length of wire Rver = 1,132 daN / m. Characteristics of the lines: The split phase consists of 3 wires (n = 3), the splitting radius is R = 0.23 m. In the calculation, the air density is taken to be ρ = 0.11 daN * s2 / m4 and the attenuation decrement is δ = 0, 12.
As the comparison results show, the calculation formula (12) is applicable in a limited range of speeds, the values of which depend on the span. So, for ℓ = 200 m, the calculation formula is valid at a wind speed not exceeding 12 m / s, beyond which the character of the dependence does not coincide with the simulation results. Similarly, for ℓ = 300 m - 8 m / s and for ℓ = 400 m - 7 m / s. Such limitations are due to the fact that when deriving the calculation formula, the influence of torsional movements on the nature of the dance was not taken into account. At moderate wind speeds, the influence of torsional movements on the nature of the dance is negligible and can be neglected to some extent. However, this assumption is unacceptable at high wind speeds. As the simulation results show, at high wind speeds there is an abrupt decrease in the intensity of dancing (Figure 1) and, on the contrary, an abrupt increase in the intensity of torsional vibrations, that is, an energy exchange occurs between linear and torsional vibrations.
In general, in the allowed range of wind speeds, the discrepancy between the data calculated according to formula (12) and the theoretical data is insignificant. The maximum discrepancy is observed at ℓ = 300 m and V = 8 m / s, which does not exceed 15%. Thus, the calculation formula (12) can be used to assess the intensity of wire dancing in a certain range of wind speeds. The allowed range of wind speeds can be set based on an analysis of the original mathematical model of wire dancing (with two degrees of freedom).
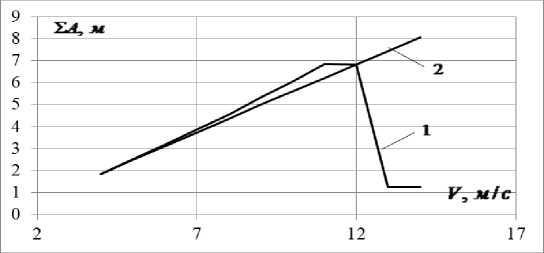
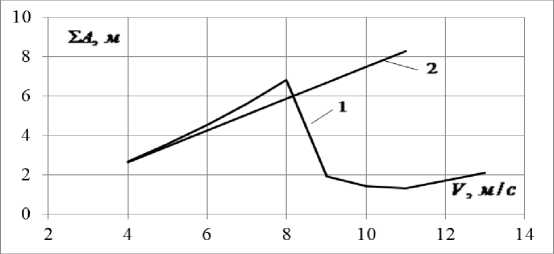
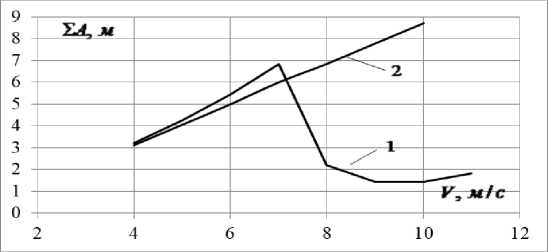
Figure 1. The dependence of the intensity of the dancing wires of the RF on wind speed. о = 10 даН / мм 2 . A) - I = 200 м B) - I = 300 м C)) - I = 400 м .
1 - according to the mathematical model of the wire dance of the R
Conclusion
-
1. A calculation formula has been obtained for determining the intensities of one-half-wave dancing of RF wires at given wind speeds, known power line parameters and aerodynamic characteristics of icy wiresF, 2 - according to the calculation formula (12).
-
2. The calculation formula is applicable in a limited range of wind speeds. The permissible speed range can be determined (in the future) based on the analysis of the initial mathematical model of dancing, taking into account the mutual effects of linear and torsional vibrations in the process of dancing
-
3. The developed technique allows you to determine the sum of the amplitudes ( А в +А н ), but does not provide information on the ratio of amplitudes ( А в /А н ), which is its disadvantage.
-
4. The results of the study can be used in the design of high-voltage power lines, the study of the phenomena of dance and in the development of measures to protect overhead lines from dancing wires
References Auto-oscillations of wires of high-voltage power lines (anchor span)
- Glebov E.S. Wires galloping on overhead power lines 500 kV - М.: БТИ ОРГРЭС, 1965.- 72 p.
- Hunt J. C.R. and Richards D.J. W. "Overhead-line Oscillations and the Effect of Aerodynamic Dampers", Proceedings, November 1969. vol. 1 16 (11).- Рр. 1869-1874.
- Blevins R.D. and Iwan W.D. The Galloping Response of a Two-degree-of-freedom System.Journal of Applied Mechanics. ASME December 1974. vol 41.- Рр. 1113-1118.
- Electric Power Rescarch Institute, Transmission Line Reference Book, Paio Alto, Calif.: EPRI, 1979. 1074 p.
- Richardson A.S. The time line method for assessing galloping exposure.-IEEE Transactions on Power Apparatus and Systems, 1982, PAS-101, № 8.Рр. 2885-2891.
- Egbert R.T. Estimation of Maximum Amplitudes of Conductor Galloping by Describing Function Analysis.- IEEE Transactions on Power Delivery, vol. January 1986. -. Рр. 251-257.
- RAWLINS С.В. Analysis of conductor galloping field observations-single conductors. IEEE Transactions on Power Apparatus and Systems, Vol. PAS-100, № 8, August, 1981. - Pp.100-108
- RAWLINS С.B. Conductor galloping field observation analysis update. ALCOA Conductor Products Company. Technical note № 26, January, 1986. - 39 p.
- Lilien, J.L. and Havard D.G. "Galloping Data Base on Single and Bundle Conductors. Prediction of Maximum Amplitudes". IEEE Trans on Power Delivery. April 2000, Vol. 15, No. 2. -Pp. 670-674.
- Djamanbayev M.А., Vinogradov А.A. Observationsof galloping in the northern part of Kazakhstan. - Seventh International Symposium CABLE DYNAMICS Vienna (Austria), December 10-13, 2007.- Pp. 423-425.
- Bekbaev A. B., Dzhamanbaev M.A., Abitaeva R., Karbozova A., Nabyeva G. Estimate of Maximum Expected Intensity of One-half-wave Lines Dancing.- International Science Index, International Scholary and Scentific Research & Innovation waset.or. 24-11-2015. DUBAI UAE- № 17(11). - Рp. 1745-1747
- Djamanbayev M.А., Tokenov N. Mathematical model of the split phase galloping of overhead power lines (anchor span)/Proceedings of II International Scientific Conference "High technologies - the keys to sustainable development", May 23-24, 2013. -Almaty, KazNatTechn.Univ named after K.I. Satpayev. - P.5
- Djamanbayev M.А., Abitayeva R.Sh., Kassimov А. Aerodynamic characteristics of the profile cross-section of the wire with icy sediment. / Works of international Satpayev readings "Scientific heritage of Shakhmardan Yessenov".- KazNatTechn.Univ named after K.I. Satpayev. Аlmaty, 2017. - Pp. 817-820.
- Prigorovskiy А.L., Sandalov V.М., Moskova Ye.S. Problems in the theory of oscillations, stability of motion and the qualitative theory of differential equations. Part 4. Van der Pol method. Poincaré's method: Educational and methodical manual. - Nizhny Novgorod: Nizhny Novgorod State University, 2017. - 24 p.
