Automated Visual Inspection: Position Identification of Object for Industrial Robot Application based on Color and Shape

Автор: Muralindran Mariappan, Tony Chua Tung Ming, Manimehala Nadarajan
Журнал: International Journal of Intelligent Systems and Applications(IJISA) @ijisa
Статья в выпуске: 1 vol.8, 2016 года.
Бесплатный доступ
Inspection task is traditionally carried out by human. However, Automated Visual Inspection (AVI) has gradually become more popular than human inspection due to the advantageous in the aspect of high precision and short processing time. Therefore, this paper proposed a system which identifies the object's position for industrial robot based on colors and shapes where, red, green, blue and circle, square, triangle are recognizable. The proposed system is capable to identify the object's position in three modes, either based on color, shape or both color and shape of the desired objects. During the image processing, RGB color space is utilized by the proposed system while winner take all approach is used to classify the color of the object through the evaluation of the pixel's intensity value of the R, G and B channel. Meanwhile, the shapes and position of the objects are determined based on the compactness and the centroid of the region respectively. Camera settings, such as brightness, contrast and exposure is another important factor which can affect the performance of the proposed system. Lastly, a Graphical User Interface was developed. The experimental result shows that the developed system is highly efficient when implemented in the selected database.
Color, shape, position, RGB color space, winner take all approach, compactness, centroid
Короткий адрес: https://sciup.org/15010782
IDR: 15010782
Текст научной статьи Automated Visual Inspection: Position Identification of Object for Industrial Robot Application based on Color and Shape
Published Online January 2016 in MECS
Image Processing is a form of signal processing which converts an image into digital form in order to process the image. Today, it has a very important role in many different industries such as automation intelligent transportation system, remote sensing, moving object tracking, defense surveillance, biomedical imaging technique and visual inspection. In this paper, image processing is utilized for the visual inspection task in the manufacturing industry.
Visual inspection is one of the crucial tasks in manufacturing industry. It is mostly applied for quality control to ensure the manufactured products meet the fixed standard. Traditionally, these tasks are carried out by human operators. However, research conducted by [1]
stated that human accuracy in visual inspection declines with the dull, endless routine jobs. This contradicts with the driving forces in today’s manufacturing environment which emphasize quality improvement, increased volume and shorter time.
Therefore, Automated Visual Inspection (AVI) which is aimed to achieve untiring inspection and control of quality is more widely used for many different manufacturing industries nowadays. This is due to the advantageous of AVI which can carry out the inspection job in the environment which is harmful to human [2]. Most importantly, it fulfills the requirement of high speed production with high speed inspection because time is equivalent to money in manufacturing industry.
Many features from the product can be extracted as an indicator of the quality such as color, shape, textile, glossiness and marking [3]. However, different manufacturing industry has different inspection criteria. The inspection criteria of the proposed system are shape and color.
In the quality control section, removal of the defect products from the production line is required after defect product is detected. Pick and place robot is one of the approach utilized by industry to pick out the defective products. However, position of the defect product has to be known so that the robots to carry out their work. [4]. Therefore, the position of the object is identified after color and shape identification. Target detection based on color and connected components were done using HSL color space. The purpose of the research was intended for embedded robotic applications. The design was tested real-time [5]
The system proposed in this paper is aimed to identify the object’s position based on color and shape in manufacturing industry. Due to the requirement of low computational time in manufacturing environment, the variety of the inspection criteria was limited. Therefore, the proposed system is designed to detect three basic additive color such as red, green, blue, and geometric shapes such as circle, square and triangle. RGB color space is used during image processing while color identification method is winner take all approach which evaluates the pixel’s intensity of the R, G and B channel. Meanwhile, the shape and position identification is based on the compactness and the centroids of the region.
Finally, the evaluation criteria are the efficiency of the developed system during the identification of the object’s color, shape and position. The developed system has been tested few times to obtain the reliability of the designed algorithm.
The paper organized into different sections where Section I discusses the background; Section II presents the related work; Section III discuss the developed structure; Section IV describes the developed system; Section V presents the Graphical User Interface (GUI) of the proposed system; Section VI presents the result and discussion and Section VII concludes the whole paper.
-
II. Related Work
Related work done by other researchers was reviewed and summarized in this section. The related work done in this paper is the application of AVI in different fields of manufacturing industry and different methods used by researchers for color and shape identifications.
-
A. Application of AVI
AVI has been applied by many researchers in different industry such as medical capsules inspection [6], seed defect classification [7], printed circuit board [8] and high speed automatic fruit sorting and grading [9].
Research done by [6] shows an AVI system developed to inspect medical capsules with one-dose package (ODP). Both-side of capsules was captured at once and apply hierarchical recognition. The recognition of the capsule by the system is based on two features, ID marks and color. Through the experiment done in the paper, the recognition rate of the capsule by the ID mark alone was 97.8% whereas the recognition rate increases to 99.1% when color recognition added in.
AVI system developed in [7] classifies more than ten categories of seed defects. The feature extracted for classification purposes is color and textile. The image capturing scene was designed to control the lighting level to reduce the effect of reflection and shadow appeared on seed samples. The recognition accuracies of the system are 95.6% for normal seed types and 80.6% for group of defect seeds.
Studies conducted by [8] shows an AVI system which function is to inspect the component mounted on the surface of Printed Circuit Board (PCB). Color was the key feature used for the analysis. The inspection process was divided into two stages. Projection and location of the components was obtained in the first stages. The projection of component was determined through the segmentation of the red sub image while the location was determined by sliding location. The feature extracted for high speed automatic fruit sorting and grading in [9] by the system are color, size and shapes.
From the review, it can be found that the inspection criteria are different respect to their applications. From the review, it can be found that colors and shapes are the most common inspection criteria from the review. Therefore, the proposed system detects the objects based on colors and shapes.
-
B. Color Detection Methods
Color detection is the primary stage in the application based on color information. The accuracy of color detection in image processing differ respect to the methods used. Thus, various color detection method used by other researchers had been reviewed in this section. The reviewed methods include direct color mapping [10], relative value of RGB [11], improved seed fill algorithm [12] and hierarchical neural network structure [13]
Direct color mapping [10] was used for the automated color grading system. Though RGB, HIS and CIELab are the most commonly used color spaces color grading, they are not an attractive alternative due to the multidimensional characteristics which make the color preference setting difficult to be adjusted. Therfore, the range of the reference color and the color information extracted from the fruit is mapped into one dimension color space that uses a single value or index to represent each color in specified range. During the color grading, the converted color information from the inspected fruit is then mapped to the reference color to find out the grading of the fruit. The accuracy of the system during the testing is 100% for yellow, 94.7% for red, 86.8% for orange while 89.6% for Medjool dates.
Color segmentation algorithm based on relative value of RGB [11] operated directly on RGB color spaces. This method was used to segment human face based on color. Some experiments have to be conducts to obtain the rgb relative value of the human faces. The range of the relative value was then determined through careful observation on the inherent properties of RGB color space on the target object.
Studies by [12] shows a method for real time color image segmentation. YUV color space was adopted in the system as it is more superior to adapt to changes of light intensity compared to RGB color space. After the color space conversion, the upper and lower threshold of every dimension in YUV color space. However, only U and V dimensions are processed as Y represents brightness. During the segmentation process, improved seed fill algorithms spread around from the centre of the color to be identified and judge the color of the pixel until the whole color pieces if filled.
RGB color space was used by hierarchical neural network structure [13] for color detection. The proposed approach is different with the conventional approach. Conventional approach used only single neural network structure and “Winner-take-all” approach was the principle utilized by conventional approach to determine the color class. For example, the color will be categorized as blue if the blue dimension has the highest value among three dimensions in RGB color space. In the other hand, the proposed approach utilized more than one neural network. The master network is the final decision maker. By comparing the image produced, the image produced by the hierarchical neural network shows higher fidelity.
Most of the reviewed methods above are used to identify complex combination of colors. Since the variety of colors to be inspected in manufacturing industry is not much, a simple and fast identification method should be designed for industrial purposes. Therefore, “Winnertake-all” approach which is utilized for conventional hierarchical neural network approach [13] is most suitable for the proposed system in this paper.
-
C. Shape Detection Method
The shape detection methods reviewed are Least Squares Criteria (LMC) [3], extent value [14], compactness [15] and moment invariants [15], geometric matching [17] and Wavelet-Transform Maxima (WTMM) [18].
A shape identification method using Least Squares (LMC) criteria [3]. LMC identify the shape by measure the curvature of the arcs. The radii values obtained LMS are added to a curvature histogram and several features are extracted from the histogram to characterize shape. Before the arcs in the image ready for measurement, the RGB image was converted to grayscale image. The radii values obtained LMS are added to a curvature histogram and several features are extracted from the histogram to characterize shape. The grayscale image was then preprocessed with a histogram stretch, median filter and histogram equalization for noise removal and contrast enhancement for edge detection. Directional edge image was then produced by Sobel gradient and thresholded from zero using the histogram produced from the Sobel magnitude image. Modified region growing algorithm (MRG) was then used to segment arcs and line segments and to remove Sobel directional boundary effects. Object would be categorized into arcs or straight line segments. Finally, they are thinned.
A shape identification methods based on extent value to identify squares, circles, rectangles and triangles. Firstly, the color image is converted to black and white image followed by boundary recognition [14]. The noise existed in the image was then filtered through area based filtering. The area of the bounding box and objects was determined to figure out the extent of the object which is the ratio of the object’s area to the bounding box’s area. The extent value for circle is 0.7853 while the triangle is ranged from 0.25 to 0.50. Though both square and rectangle has the same extent value, they are distinguishable by the width and length. Square has the same measurement for both width and length while rectangle does not. The orientation of the object is an important concern. The extent value obtained will be inaccurate respect to the actual shape if there is inclination angle between the horizontal axis and the object.
Research by [15] identified the object shape based on the compactness of the region. It is a shape identification method which independent of scale and orientation. The compactness for circle, square and triangle has the compactness ranged from 1 to 14, 15 to 19 and 20 to 40 respectively. The proposed system achieved 85% accuracy.
Moment invariant is a shape detection method used in [16]. A robust shape descriptor was created through the combination of the well-known Hu moments and another measure based on invariant moments whereas the automatic feature classification method was done by region-growing clustering algorithms. A combined cluster validation measure was created to determine the optimum number of classes.
Experiments and studies conducted by [17] utilized geometric matching for traffic sign shape recognition. An optimal enclosure is generated, if the shape is unclosed, to reduce the geometric differences between the unclosed shape and templates. This method requires a standard library picture of the interested object. The classification of the shape is made based on the minimum distance between the tangent function of the object’s shape and template. A candidate will be filtered if the minimum distance exceeds the threshold.
Researchers in [18] proposed a shape recognition method based on Wavelet-Transform Modulus Maxima (WTMM). WTMM can provide useful information for curvature analysis. The vertices with WTMM greater than the threshold value were considered as high curvature point (HCP). The feature vector of each object will be created based on the location and magnitude of wavelet transform (WT) for each HCP. Similarity score between the template and the candidate image at each level is then computed. Maximum similarity score at each level were the final similarity. In order to classify partially occluded objects which is exposed to poor illumination, noise and objects in cluttered background, research conducted by [19] optimized information from shape to classify the objects. Wavelet based histogram of oriented gradients (WHOG) was used to represent shape information while Backpropagation Neural Network was used to training for image classification.
There are many different methods used by researchers for shape detection in the reviewed previous work done. The shape required to be detected by the developed system are the simple geometric shapes such as triangle, square and circle. Among the reviewed methods, shape detection based on extent value [14] and compactness [15] is the most flexible methods. However, shape identification based on compactness [15] is more advantageous than extent value [14] as it is independent of shape orientation.
-
III. Developed Structure
Fig. 1 below shows the structure developed for objects inspection purpose consisting of a webcam, LED and inspection plate. Webcam is used to acquire the image of the inspected objects while the Light Emitting Diodes (LED) is fixed on top and the surrounding of the inspection area. The camera placed too high or far away from the inspection area will decrease the amount of the pixels which hold the details of the images. Moreover, this will reduce the shape identification accuracy by the developed system.
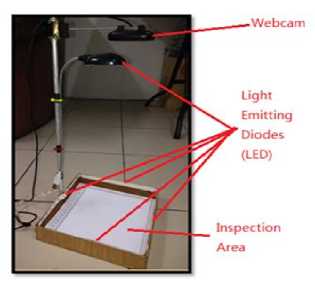
Fig.1. Developed Structure.
-
A. Webcam
Logitech webcam C170 as shown in Fig. 2 is the webcam which used to capture the image of the inspected objects. It was fixed directly on top of the inspection area. This webcam can capture images at different resolution and frame rate. The maximum resolution can be captured is 1024 x 768 pixel dimension with 30 frame per second.
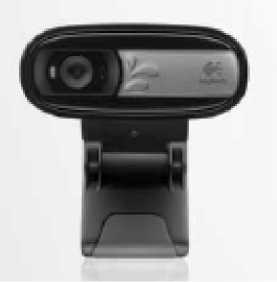
Fig.2. Logitech Webcam C170.
-
B. Light Emitting Diodes (LED)
LEDs are installed on the top and surrounding of the inspection area to provide a lighting environment which reduces the effect of shadow. The LEDs installed around the inspection area will reduce the effect of the shadow formed at the sides resulted by top luminance. LEDs installed on top of the inspection area will eliminate the shadow formed at the middle of the inspection area. The shadow at the middle will formed when the objects blocked the lighting from the surrounding LEDs.
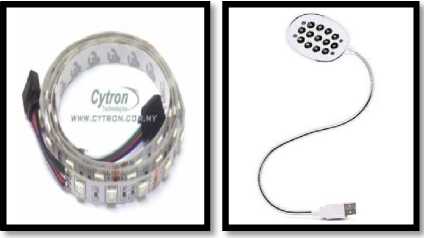
Fig.3. LED wrapping around inspection area (left) and top of the inspection area (right).
-
IV. Developed System
Fig. 4 shows the developed system flow. The system starts with live image acquisition of the objects in the inspection area. The quality of the acquired image is then enhanced by image preprocessing stages. The object region will be identified at this stage too. Then, the object’s position will be identified either based on the color, shapes or both colors and shapes.
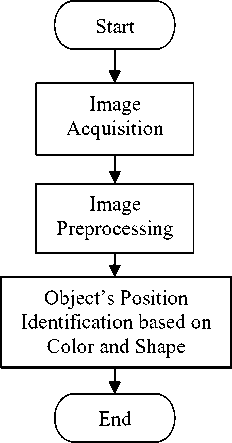
Fig.4. General System Flow.
-
A. Image Acquisition
Image acquisition is a process to acquire an image by using image sensor. To acquire a quality image that is used for image processing, camera resolution and settings are some of the important factors that need to be taken into account. The calibration of the camera resolution and settings and the image acquisition were done and controlled by the MATLAB Image Acquisition Toolbox. The acquired image is represented in RGB color space. This color space is chosen for this research as the color identification concentrates on three basic colors which are R, G and B.
-
1) Camera Resolution
Camera resolution indicates the amount of pixels available to hold the detail of an image. Therefore, higher camera resolution produces an image with finer edges as shown in Fig. 5. This is important as it can affect the accuracy of the shape identification. Therefore, highest resolution which is 1024 x 768 was chosen for this

Fig.5. Edges of the Triangle Acquired with Camera Resolution of 160x120 (left) and 1024 x 768 (right)
research. To be noted that the processing time increases with the camera resolution.
-
2) Camera Settings
Camera settings were calibrated in order to acquire a quality image. This stage is very crucial as it will affect the subsequent stages if the camera is not well calibrated. In this research, the camera setting is calibrated to -15, 20 and -7 for brightness, contrast and exposure respectively. This setting is obtained after several testing stages. Lower brightness and exposure reduces the distortion of the surrounding lighting while higher contrast magnifies the differences between background and objects. The comparison on the image acquired with different camera settings is shown in Fig. 6 which is compared with camera default and parameters required for this system.
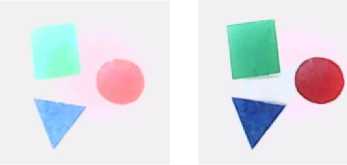
Fig.6. Image Acquired with Brightness, Contrast and Exposure of 0, 13, -5 (left) and -15, 20, -7(right) respectively
-
3) RGB Color Spaces
The acquired image is modelled in RGB color space. It is a color space which is widely used in most computer graphic field as it simplifies the design. This color space is defined by three chromaticities of the red, green and blue additive primary. Different colors can be perceived through the mixing of the additive color. This color space is the default space obtained in any image. The color space is chosen based on the design requirement. Any color space will be influenced slightly on the environmental lighting.
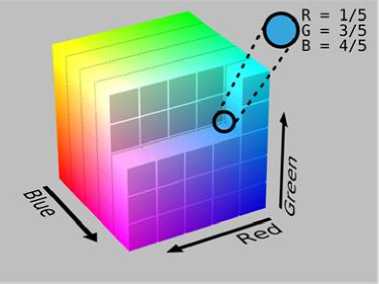
Fig.7. RGB Color Cube.
RGB model is as shown in Fig. 7 can be represented as 3D model of color space. The horizontal x-axis as the red values increases to the left; y-axis as blue is increases to the lower right and the vertical z-axis as green increases towards the top. The origin, black, is the vertex hidden from view. The weaknesses of RGB color spaces compared to other color spaces is it can be affected by change of light intensity. Therefore, constant lighting environment and an appropriate camera setting is very important for this color space during identification.
-
B. Image PreProcessing
Fig. 8 shows the flow of the image preprocessing. Its main function is to correct the distortion, degradation and noise introduced in the acquired image. Besides that, the final image resulted in this stage can be used as a mask to segment the object in the original image for color and shape identification purposes. The image preprocessing step will be described in the following sub-sections.
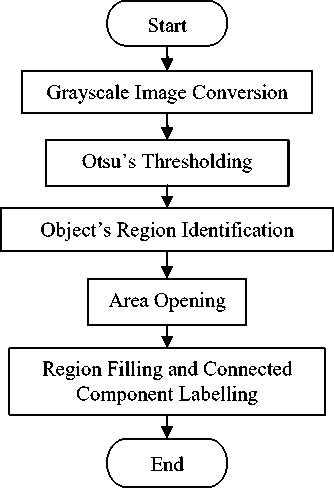
Fig.8. Image Preprocessing Flow
-
1) Grayscale Image Conversion
Since the structure of RGB color space in MATLAB is in three dimensional arrays, RGB color image is actually the combination of three grayscale images, an image which color is represented by the shade of grays. Therefore, the grayscale image conversion in this research is done through the separation of RGB channel. This produces three grayscale images with different intensity value as shown in Fig. 9 below.
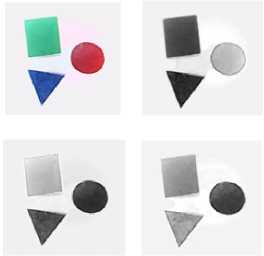
Fig.9. RGB Image (top left) and Grayscale Image from R channel (top right), G channel (bottom left) and B channel (bottom right)
-
2) Otsu’s Thresholding
Otsu’s thresholding is one of the most successful thresholding methods implemented in many applications [20]. It operates on grayscale image and set a threshold value. The pixels which intensity value which greater than the threshold value will be assigned with logical one while the one lower than threshold value will be assigned with logical zero. At this stage, three binary images are produced from the grayscale image of the respective channel illustrated in Fig. 10.
|
^^ |
Vе |
Fig.10. Binary Image of R channel (left), G channel (middle) and B channel (right)
-
3) Object’s Region Identification
The object’s regions in the image are identified by logically AND the three binary images resulted from Otsu’s Thresholding. Since the background color is white, the background and the object pixels are replaced with logical one and zero respectively during image binarization process. Therefore, objects’ region can be identified because AND operation will assign the background region with logical one and object region with logical zero. All the pixel’s value is then inverted for further processing purposes as shown in Fig. 11.
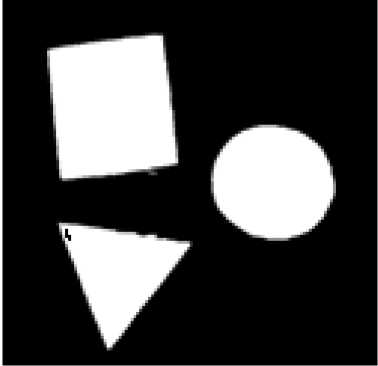
Fig.11. Object’s Region Identification
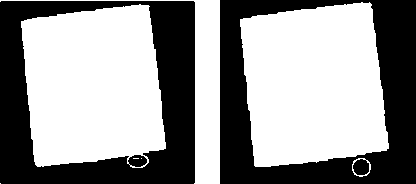
Fig.12. Before (left) and After (right) of the Noise Elimination by Area Opening
-
5) Region Filling and Connected Component Labelling
The function of region filling is to fill the ‘holes’ or black color pixels which present in the objects’ region. This is represented in Fig. 13.
The objects in the image are then labeled for region identification purposes. The pixels will be grouped and assigned with unique value started with 1 to differentiate the objects in the images.
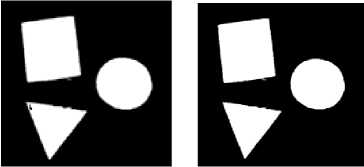
Fig.13. Before (left) and After (right) Region Filling
-
C. Color Identification
Color identification is a process which recognizes the color of the inspected object. From the literature review, there are many different methods used by other researchers to identify the color. Some of the methods are complicated as the range of the identified color is large. Since the color to be recognized by the system in this paper is limited to red, green and blue in order to preserve the low computational time, winner take all approach is the method utilized for color identification. Before the identification, segmentation and median filtering is done on the image.
-
1) Objects Segmentation and Median Filtering
The objects in the image are segmented with the segmentation mask resulted from Section V. The RGB contents are then averaged by median filtering. Fig. 14 shows the segmented object with averaged RGB contents by median filtering.
4) Area Opening
Some of the background’s pixels might be wrongly classified as the object’s pixels due to the noise appeared during image acquisition. Since there are multi shapes in an image, area opening instead of opening or closing is used in order to preserve the structure of the objects. Area opening eliminates the pixels which the area is smaller than the threshold. Fig. 12 shows the elimination of the noise present beside the square using area opening.
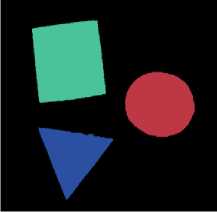
Fig.14. Averaged RGB contents through median filtering.
-
2) Winner-Take-All Approach
Winner-take-all approach identifies the color of the object through the evaluation of the pixel’s intensity value in the R, G and B channel. A pixel will be identified as red color if R channel has the highest intensity value among the three channels. The same goes to blue and green color identification. Fig. 15 shows the basic additive color identification and segmentation by the developed system.
ВИЯ
Fig.15. Red (Left), Green (Middle) and Blue (Right) Color Object Identification and Segmentation
-
D. Shape Identification
The shape of the object is identified through the compactness of the region. Compactness is proposed as the method for shape identification in this paper because it is scale and orientation independent. Equation 1 shows the computation of the object’s compactness value.
c=
P2
A
where c is the compactness, p is the perimeter and A is the area.
Circle, square and triangle have the compactness value ranged from 1 to 14, 15 to 19 and 20 to 40 respectively. Fig. 16 shows the identification and segmentation of the object respect to their shapes.
вин
Fig.16. Circle (Left), Square (Middle) and Triangle (Right) Shape Identification and Segmentation.
-
E. Position Identification
After the desired object is segmented based on color and shape, the position of the segmented object is identified for the pick and place purposes. In this paper, centroid of the objects is determined to tell the objects’ position. The centroid of the object is determined using MATLAB regionprops function. However, the centroid determined is in the unit of pixel. It is converted to coordinates form so that the position of the object in real world coordinates can be known. The ratio of the position in the image and inspection in the proposed system is 0.2579 (in mm). Equation 2 is derived for the unit conversion.
mm = 0.2579 ∗ P (2)
where mm is the objects’ position in millimeter, P is the objects’ position in pixel.
-
V. Graphical User Interface
Graphical User Interface (GUI) is a type of interface that allows users to directly interact with the system through graphical icons and visual indicator. A graphical user interface as shown in Fig. 17 had been designed for the system using Graphical User Interface Design Environment (GUIDE) function in MATLAB.
The developed GUI is divided into four panels namely “Camera”, “Image Processing”, “Control Panel” and “Position”. There are two windows in “Camera” panel which display the live view of the inspected object and the image acquired by the webcam respectively. In the other hand, the windows in the Image Processing panel display the resulting image in each processing stage.
The “Control Panel” enables the user to adjust the setting of the designed system. The mode of the system can be changed by either enable or disable the color detection or shape detection. Besides that, the desired identified color and shape can also be selected in this panel provided that either color or shape detection was enabled respectively. Finally, the image processing can be initiated by pressing the “Start Image Processing” button. The position of the object of interest will be shown in the “Position” panel.
-
VI. Results And Discussion
The proposed system is tested to determine the accuracy of identification. Table 1 shows the accuracy of the color, shape and position identification when tested with different number of position with different combination of color and shapes. From the experimental result, the accuracy of the color, shape and position identification by the proposed system is very high for the selected database. Both color and shape of the object can be successfully identified in every combination.
On the other hand, the accuracy of the position identification by the proposed system is 100% too. Since there are round off issues during the unit conversion from pixel to coordinates (mm), tolerance of 4 to 5 mm is allowed. Therefore, position identification is considered as success if the different of the position between the identified and real centroid is in the tolerance ranges.
Besides that, camera settings and resolution are also a very important factor in the proposed system. Inappropriate camera setting and resolution will influences the accuracy of shape identification. Lighting condition is another factor which can influence or alter the actual information in the acquired image. However, since most of the manufacturing industry has a constant lighting condition, the object information in the acquired image is nearly perfectly preserved in the acquired image for identification.
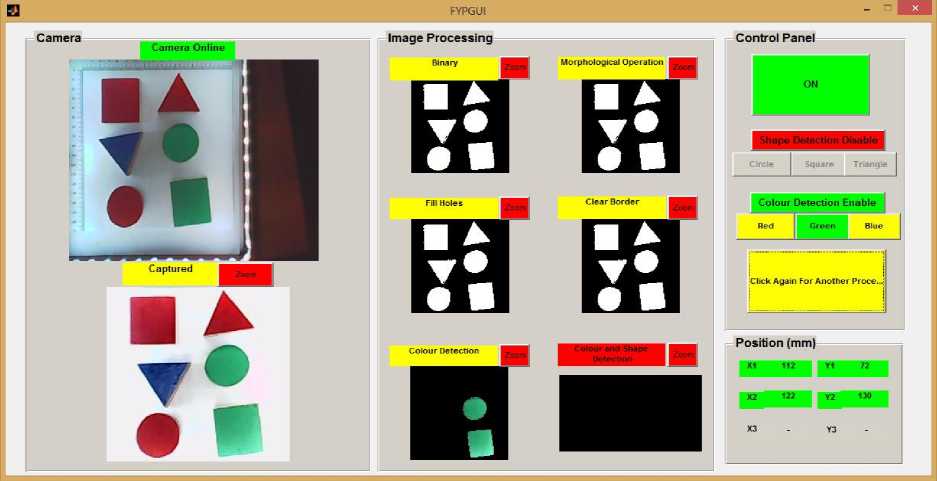
Fig.17. Graphical User Interface of the Developed System
Table 1. Test Result of the Color, Shape and Position Identification by the Proposed System
|
Number of Inspected Color |
Number of Inspected Shapes |
Identification Accuracy |
[1] [2] |
||
|
Color |
Shape |
Position |
|||
|
1 |
1 |
100% |
100% |
100% |
|
|
2 |
100% |
100% |
100% |
||
|
3 |
100% |
100% |
100% |
[3] |
|
|
2 |
1 |
100% |
100% |
100% |
|
|
2 |
100% |
100% |
100% |
||
|
3 |
100% |
100% |
100% |
||
|
3 |
1 |
100% |
100% |
100% |
[4] |
|
2 |
100% |
100% |
100% |
||
|
3 |
100% |
100% |
100% |
||
-
VII. Conclusion
This paper proposed an object’s position identification system based on color and shape. The variation of the color and shape identified by the proposed system is limited to three types respectively in order to fulfill the requirement of low computational time and high processing speed in the manufacturing industry. Therefore, a simple and yet effective algorithm had been developed for identification purposes where the color of the object is identified by winner-take-all approach; shape is identified by the compactness of regions and position is identified through the identification of the object’s centroid. In a conclusion, a highly effective position identification system for inspection purposes in manufacturing industry is successfully developed and presented in this paper. This can be seen from the experimental result where the accuracy of basic color, shape and position identification are 100%.
Список литературы Automated Visual Inspection: Position Identification of Object for Industrial Robot Application based on Color and Shape
- S. C. Wang, Human Reliability in Visual Inspection. Quality. 1975. 14(9):24-35.
- E. N. Malamas, E. G. M. Petrakis, M. Zervakis, L. Petit & J. Legat, “A survey on industrial vision systems, applications and tools,” Image and Vision Computing, vol.2, issue 2, pp. 171-188, December 2002.
- J. Moore, G. Hobson, G. Waldman & J. Wootton, “A Real-Time Visual Inspection System for Automated Prescription Dispensing Systems,” IEEE International Conference on Man and Cybernetics, vol.1, pp.577-582, October 08-11, 2000.
- C. Anthony, C. Benjamin, M. William, J. T. Camillo & L. Maxim, “Perception and Motion Planning for Pick-and-Place of Dynamic Objects,” International Conference on Intelligent Robots and Systems (IROS), pp. 816-823, November 2013.
- G. Fei, D. Ji-CAir & Z. Dong-bo, “A Connected Domain Analysis Based on Color Localization Method and Its Implementation in Embedded Robot System”, International Journal Image, Graphic and Image Processing, Volume 5, pp. 37-43, 2011.
- T. Murai, M. Morimoto & K. Fujii, “A Visual Inspection System for Medical Capsules,” IEEE International Conference on Systems, Man, and Cybernetics, pp.1433-1437, October 14-17, 2012.
- K. Kiratiratanapruk & W. Sinthupinyo, “Color and Texture for Com Seed Classification by Machine Vision,” International Symposium on Intelligent Signal Processing and Communication System (ISSPCS), December 07-09, 2011.
- H. H. Wu, X. M. Zhang & S. L. Hong, “A Visual Inspection System for Surface Mounted Components Based on Color Features,” Proceedings of the IEEE International Conference on Information and Automation, China, pp.571-576, June 22-24, 2009.
- S. Yogitha & P. Sakthivel, “A Distributed Computer Machine Vision System for Automated Inspection and Grading of Fruits,” International Conference on Green Computing Communication and Electrical Engineering (ICGCCEE), Coimbatore, pp.1-4, March 06-08, 2014.
- D. J. Lee, K. Archibald, & G. M. Xiong, “Rapid Color Grading for Fruit Quality Evaluation Using Direct Color Mapping,” IEEE Trans. Automation Science and Engineering, vol.8, issue 2, pp.292-302, April 2011.
- C. H. Ling & C. H. Su, “Color Image Segmentation Using the Relative Values of RGB,” Proceedings of the 9th WSEAS International Conference on Applications of Computer Engineering, pp.46-51, 2010.
- H. B. Liu, Y. M. Wang & Y. J. Dong, “Fast Recognition Based on Color Image Segmentation in Mobile Robot,” Proceedings of the Third International Symposium on Computer Science and Computational Technology, China, pp.1-4, August 14-15, 2010.
- H. Altun, R. Sinekli, U. Tekbas, F. Karakaya & M. Peker, “An Efficient Color Detection in RGB Space Using Hierarchical Neural Network Structure,” International Symposium on Innovations in Intelligent Systems and Applications (INISTA), pp.154-158, June 2011.
- S. Rege, R. Memane, M. Phatak & P. Agarwal, “2D geometric shape and color recognition using digital image processing,” International Journal of Advanced Research in Electrical, Electronics and Instrumentation Engineering, vol. 2, issue 6, pp.2479-2489, June 2013.
- M. F. Zakaria, H. S. Choon & S. A. Suandi, “Object Shape Recognition in Image for Machine Vision Application,” vol. 4, no. 1, pp.76-80, October 5, 2014.
- T. Barbu, “Automatic Unsupervised Shape Recognition Technique using Moment Invariants,” 15th International Conference on System Theory, Control, and Computing (ICSTCC), pp.1-4, October 14-16, 2011.
- S. Xu, “Robust traffic sign shape recognition using geometric matching,” IET Intelligent Transport Systems, vol. 3, issue 1, pp.10-18, March 2009.
- F. A. Cheikh, A. Quddus & M. Gabbouj, “Shape Recognition based on Wavelet-Transform Modulus Maxima,” 7th IEEE International Conference on Electronics, Circuits and Systems (ICECS), vol.1, pp.461-464, December 2000.
- S. Ajay Kumar, S. V. P, T. Shamik, B. Sangappa, “Wavelet Based Histogram of Oriented Gradients Feature Descriptors for Classification of Partially Occluded Objects”, International Journal of Intelligent Systems and Applications, Vol 3, pp. 54- 61, 2015.
- K. Saka, P. Santi & K. V. Vijaya, “A Color- Texture Based Segmentation Method to Extract Objects from Background”, International Journal Image, Graphic and Image Processing, Vol. 3, pp- 19- 25, 2013.
