Bony labyrinth in Upper Paleolithic individuals buried at Sungir

Author: Razhev D.I., Vasilyev S.V., Korost D.V., Borutskaya S.B.
Journal: Archaeology, Ethnology & Anthropology of Eurasia @journal-aeae-en
Section: Anthropology and paleogenetics
Article in issue: 3 т.52, 2024.
Free access
The bony labyrinth of the Sungir individuals was studied using the computed tomography scanning on an industrial Phoenix X-ray device. Three-dimensional modeling and visualization were carried out with special software. Crania of an adult (Sungir 1) and two children (Sungir 2 and 3) were analyzed. Findings reveal that bilateral asymmetry is insignificant. Individual variation range suggests that the group is morphologically homogeneous. Comparison of averages with those of Neanderthals and anatomically modern humans demonstrates overall similarity with the latter and significant difference from the former in key traits. Based on results of the discriminant analysis, children unambiguously fall in the H. sapiens group, while the adult is halfway between the latter and the Neanderthal sample. But such a finding is neither exceptional nor even rare. A Neanderthal-like morphology of the bony labyrinth (large lateral semicircular canal and high sagittal index) occurs in a small number of Upper Paleolithic humans of the modern morphological type. The Sungir adult belongs to this group.
Short address: https://sciup.org/145147208
IDR: 145147208 | DOI: 10.17746/1563-0110.2024.52.3.118-126
Text of the scientific article Bony labyrinth in Upper Paleolithic individuals buried at Sungir
The bony labyrinth is located in the stony part of the temporal bone. The pyramid is known as the best-preserved structure of the skull (Iscan, 2005: 108). It was retrieved intact even after cremation (Wahl, Graw, 2001). The labyrinth is a hollow bony shell protecting the organs of hearing and balance. It consists of three separate parts. The cochlea contains the organs of sound perception and auditory nerves (Spoor, Zonneveld, 1995; Miller, 2007). The nearby vestibule contains the otolith apparatus, which is one of the receptors for balance and spatial sense
(Highstein, 2004; Rabbitt, Damiano, Grant, 2004). The end of the labyrinth furthest from the cochlea consists of the anterior, posterior, and lateral semicircular canals (named after their orientation in the skull), which are part of the vestibular system. These canals contain receptors that respond to head rotation and contribute to the coordination of body movements during locomotion (Rabbitt, Damiano, Grant, 2004). Given the prenatal formation, stability of labyrinth development, and minimal sex differences, it can be assumed that the morphology of the inner ear will reflect only one aspect of variability in the studied groups—that is genetic (Wu et al., 2014).
Material
Three-dimensional models of the bony labyrinths from three individuals were investigated: Sungir 1—male, aged 40–45 years, Sungir 2—boy, aged 11–13 years, Sungir 3—boy, aged 9–11 years.
Kinship ties. In 2017, a team from the University of Copenhagen’s Laboratory for GeoGenetics determined that all three Sungirians belonged to the same species, Homo sapiens . The genetic analysis revealed that the individuals from the paired child burial were not close relatives. According to the results obtained by geneticists, the structure of the Sungir Upper Paleolithic group is characterized by a low level of intragroup kinship and inbreeding. The Sungirians exhibited a social organization similar to that of hunter-gatherers, characterized by a low level of inbreeding within groups that were embedded in a larger network of reproductive relations (Sikora et al., 2017).
Dating. A radiocarbon dating analysis was recently carried out at the Sungir funerary complex. The principal challenge was the contamination of the samples by fixatives employed in the extraction and restoration of human bones during the 1960s. As a consequence of incomplete cleaning, certain dates were found to be inaccurate. The AMS-dating of Sungir 1 by the amino acid fraction obtained on an XAD polymer column and by the individual acid hydroxyproline (HYP) showed statistically similar results, with a mean value of 29,780 ± 420 and 28,890 ± 430 BP, respectively. The four animal bones discovered in the cultural layer below exhibited dates within the range of 28,800–30,140 BP, thereby suggesting the possibility that both the layer and the burials can be assigned to approximately the same period. The further narrowing of the interval is hindered by the significant error of the radiocarbon method. The chronology and stratigraphy of Sungir do not contradict the correlation of lithic artifacts found there with the Streletskaya complex as an East European variant of the Final Streletskaya technocomplex (Early Upper Paleolithic) (Kuzmin et al., 2022).
Furthermore, recent computed tomography (CT) studies have demonstrated that the adult Sungirian possessed a cerebral volume of ca 1443 cm³, with notable advancement of the occipital lobes, which indicates the development of visual cortex of the large hemispheres (Vasiliev et al., 2021). The use of CT has also been instrumental in resolving the enigma surrounding the death of an adult Sungirian individual (Vasiliev et al., 2022).
Methods
The inner ear structures of the right and left sides of each individual skull were measured. Models of the bony labyrinth were made from computed tomography. Scans were performed on a Phoenix v|tome|xc450 industrial X-ray computed tomography scanner (Baker Hughes), with a resolution on the order of 110 μm, at a source voltage of 400 keV, and a current strength of 250 mA. 3D-models and their visualization were performed with the software products CTan, CTvol (Bruker), and Avizo (FEI). Measurements were carried out using these models in the Cloud Compare program . The primary data were eight linear dimensions (mutually perpendicular diameters of the semicircular canals and cochlea) and the sagittal labyrinthine index (SLI), used to express the percentage of the posterior canal that partly lies below the plane of the lateral canal (Table 1). These data formed the basis for the calculation of 11 indices. The method of F. Spoor and F. Zonneveld (1998) adapted to 3D-models was used (Fig. 1).
Table 1. Standard deviation ( s ) and technical error (TEM) of the bony labyrinth measured traits
|
Trait |
s , mm |
s , % |
TEM, mm |
TEM, % |
|
|
ASCh. |
Anterior semicircular canal (SC) height |
0.06 |
1.1 |
0.20 |
3.4 |
|
ASCw. |
Anterior SC width |
0.05 |
0.8 |
0.09 |
1.4 |
|
PSCh. |
Posterior SC height |
0.05 |
0.8 |
0.17 |
2.8 |
|
PSCw. |
Posterior SC width |
0.06 |
1.1 |
0.11 |
1.8 |
|
LSCh. |
Lateral SC height |
0.05 |
1.1 |
0.18 |
4.0 |
|
LSCw. |
Lateral SC width |
0.09 |
1.8 |
0.15 |
3.2 |
|
COh. |
Cochlear height |
0.05 |
1.0 |
0.39 |
5.8 |
|
COw. |
Cochlear width |
0.12 |
3.0 |
0.27 |
4.5 |
|
SLI. |
Sagittal labyrinth index |
0.06 |
0.1 |
– |
– |
Note. TEM (after (Knapp, 1992)) for repeated measurements according to (Osipov et al., 2013) (corresponds to s for double measurements).
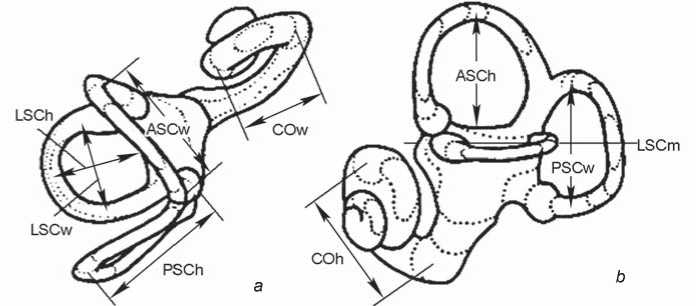
Fig. 1 . Linear measurements of the bony labyrinth used in the paper (after (Spoor, Zonneveld, 1998)). The LSCm line determines the sagittal labyrinthine index (SLI).
The measurements were taken three times for each specimen. For intra- and inter-group comparisons, the dimensions of the inner ear structures on the two sides of the skull were averaged. The dimensions are presented in millimeters and rounded to the nearest hundredth. The error of our measurements does not exceed 3% and is comparable to that observed in the test work that evaluated the stability of the employed system for bone labyrinth measurements (Osipov et al., 2013).
Results
Left and right sides comparison. To identify bilateral asymmetry of the inner ear apparatus, the size of each trait of the left side was subtracted from the corresponding size of the right side, and the resulting differences were compared with similar indicators of a large sample (without pathologies) (Osipov et al., 2013) (Table 2). Differences between the sides are present for the vast majority of traits of all individuals. At the same time,
Table 2. Differences between the left and right traits as compared to the bilateral symmetry data from (Osipov et al., 2013)
|
Trait |
S1 |
S2 |
S3 |
Mean differences |
SD |
|
ASCh |
–0.20 |
–0.12 |
–0.17 |
0.08 |
0.25 |
|
ASCw |
0.02 |
–0.03 |
0.01 |
0.06 |
0.22 |
|
ASCh/w |
–0.05 |
0.00 |
–0.02 |
0.00 |
0.05 |
|
ASCR |
0.00 |
0.00 |
0.00 |
0.03 |
0.08 |
|
PSCh |
0.04 |
–0.18 |
0.44 |
–0.08 |
0.27 |
|
PSCw |
–0.09 |
0.12 |
0.17 |
–0.01 |
0.25 |
|
PSCh/w |
0.02 |
–0.05 |
0.03 |
–0.01 |
0.06 |
|
PSCR |
0.00 |
–0.10 |
0.20 |
–0.01 |
0.10 |
|
LSCh |
–0.49 |
–0.13 |
0.04 |
0.06 |
0.28 |
|
LSCw |
–0.19 |
–0.01 |
0.10 |
0.01 |
0.24 |
|
LSCh/w |
–0.05 |
–0.02 |
–0.02 |
0.01 |
0.07 |
|
LSCR |
–0.20 |
0.00 |
0.10 |
0.02 |
0.11 |
|
COh |
–0.19 |
–0.05 |
–0.03 |
–0.05 |
0.38 |
|
COw |
–0.11 |
–0.49 |
0.01 |
0.07 |
0.28 |
|
COh/w |
–0.02 |
0.14 |
–0.02 |
–0.02 |
0.06 |
|
COR |
0.00 |
–0.10 |
0.00 |
0.07 |
0.27 |
|
SLI |
–0.32 |
0.65 |
0.02 |
0.62 |
4.05 |
Note . SD – standard deviation; h/w are taken in fractions, as in (Osipov et al., 2013).
they fit within 95% (SD × 2) of the differences observed in the model group. Thus, we can assume that bilateral asymmetry in the three individuals from the Sungir burials is insignificant. In further analyses, we will consider the data averaged by sides in accordance with the accepted methodology (Spoor et al., 2003).
Intra-group analysis . The cochlea and semicircular canals reach their adult size and mature morphology between the 17th and 25th weeks of intrauterine development (Jeffery, Spoor, 2004; Richard et al., 2010). There is no further significant change in the size of these structures. Thus, all three presented bony labyrinths have already reached their definitive form and are morphologically “adult” (Fig. 2–4). This allows them to be treated as equals, without reservations or corrections.
The possibility of assigning the studied individuals to a homogeneous sample from the morphological point of view was considered. The F-criterion was employed to compare the variability indices in the Sungir group and the model population (Osipov et al., 2013) (Table 3). The results demonstrated that the F-criterion did not reach the critical value in any instance. Consequently, the diversity observed in the Sungir group can be attributed to normal variability, and individual data can be employed to calculate averages.
Intergroup analysis. The studies have demonstrated that the structure of the bony labyrinth is reliably distinct between the lineages of Neanderthals and humans of the modern morphological type (from the Middle Pleistocene to the present day). The differences in structure can be observed in the small size of the upper semicircular canal, the large lateral canal, and the low position of the posterior semicircular canal in relation to the plane of the lateral canal (Spoor et al., 2003; Bouchneb, Crevecoeur, 2009; Wu et al., 2014).
Samples of Neanderthals, people of the modern morphological type (MMT) of the Middle and Upper Paleolithic, and modern humans were used as a comparative reference for the Sungir group (Table 4). A comparison of diagnostically significant features, including the lateral semicircular canal radius (LSCR) and the position of the posterior canal relative to the lateral plane (sagittal index SLI), reveals that the Sungirians differ significantly and with statistical reliability from Neanderthals, and have no differences from people of the modern morphological type. According to the diagnostically significant anterior semicircular canal radius (ASCR), there are no reliable differences between the samples. In addition, the Sungirians exhibit significant differences in three features (PSCR%, LSCR%, PSCh/w)
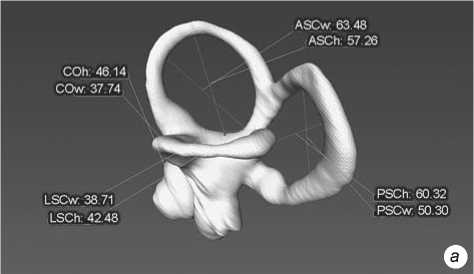
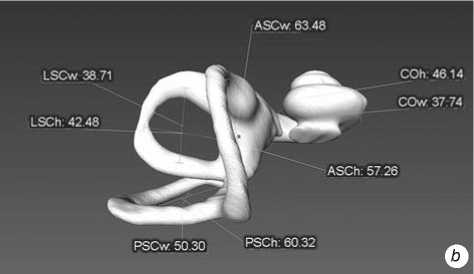
Fig. 2 . Left bony labyrinth of individual Sungir 1. a – lateral view; b – top view.
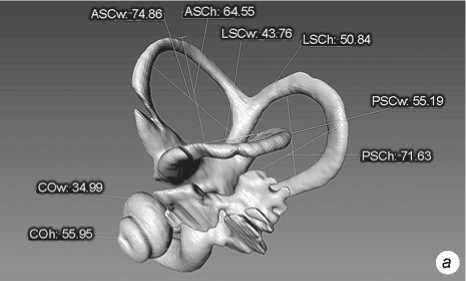
Fig. 3 . Left bony labyrinth of individual Sungir 2. a – lateral view; b – top view.
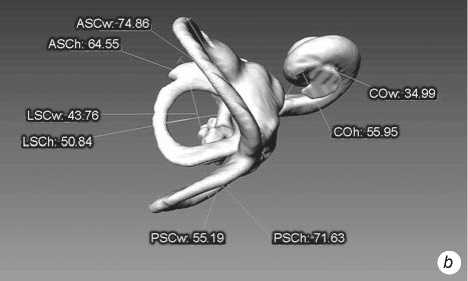
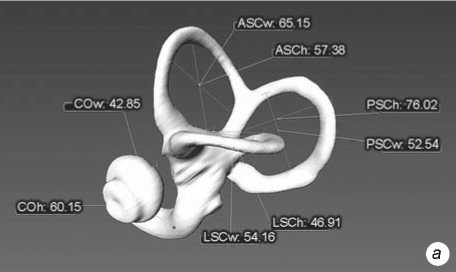
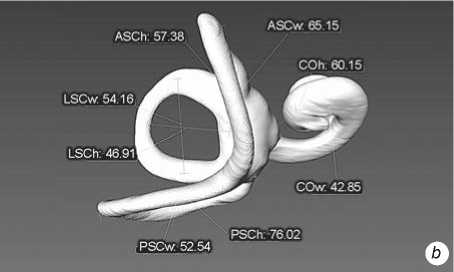
Fig. 4 . Left bony labyrinth of individual Sungir 3. a – lateral view; b – top view.
Table 3. Sungir Group (SG) data and Model Population (MP) variability indicators
In terms of the bony labyrinth morphology, the Sungir group can be considered to occupy a place in the lineage of people of the modern morphological type. The identified features, namely, the large relative size of the anterior canal (ASCR%) and the narrower posterior canal (PSCh/w), distinguish Sungirians among the MMT humans. However, further confirmation is required because of the small sample size.
Another mathematical procedure, discriminant analysis, was employed to ascertain the proximity of the Sungirians to Neanderthals and Upper Paleolithic humans. For the purposes of this study, published individual measurements were included. The application of this approach resulted in a notable reduction in the number of analyzed features and the composition of the compared samples (Table 5). A stepwise analysis was carried out, with the inclusion of various variants. However, other alternative methods yielded inconclusive results. As anticipated, two variables were found to be involved in the discriminant function: the sagittal labyrinthine index (SLI) and the relative size of the lateral canal radius (LSCR%). The Wilks’ lambda statistic was calculated to be 0.27, indicating that the samples could be effectively distinguished.
The results of the analysis do not contradict the previous conclusion on the t-criterion; rather, they clarify it. The probabilities of belonging to the classification
Table 4. Comparison of the Sungir Group with other anthropological samples (Student’s t-test)
|
Trait |
Sungir ( n = 3) |
Neanderthals ( n = 30) |
t |
Middle Paleolithic humans ( n = 11) |
t |
Upper Paleolithic humans ( n = 10) |
t |
Modern humans ( n = 180) |
t |
|||||
|
m |
s |
m |
s |
m |
s |
m |
s |
m |
s |
|||||
|
ASCR |
3.1 |
0.2 |
3.0 |
0.2 |
0.62 |
3.3 |
0.2 |
–1.62 |
3.3 |
0.2 |
–1.61 |
3.2 |
0.2 |
–0.98 |
|
PSCR |
3.0 |
0.2 |
2.8 |
0.2 |
1.54 |
3.0 |
0.2 |
–0.08 |
3.1 |
0.3 |
–0.74 |
3.1 |
0.3 |
–0.94 |
|
LSCR |
2.3 |
0.1 |
2.6 |
0.2 |
–3.13 |
2.4 |
0.2 |
–0.73 |
2.5 |
0.2 |
–1.73 |
2.3 |
0.2 |
0.39 |
|
SLI |
46.1 |
5.9 |
63.5 |
5.8 |
–4.84 |
53.0 |
6.2 |
–1.79 |
43.7 |
9.4 |
0.53 |
50.7 |
6.8 |
–1.35 |
|
ASCR, % |
36.7 |
0.5 |
35.9 |
1.5 |
1.94 |
38.1 |
1.3 |
–2.98 |
37.2 |
1.4 |
–0.97 |
37.3 |
1.3 |
–2.16 |
|
PSCR, % |
35.6 |
0.5 |
33.6 |
1.6 |
4.66 |
34.7 |
1.6 |
1.64 |
34.5 |
1.7 |
1.84 |
36.0 |
1.8 |
–1.37 |
|
LSCR, % |
27.7 |
0.9 |
30.5 |
1.1 |
–5.15 |
27.2 |
1.6 |
0.73 |
28.3 |
0.9 |
–1.06 |
26.8 |
1.8 |
1.77 |
|
ASCh/w |
91.0 |
4.2 |
92.6 |
5.0 |
–0.63 |
88.5 |
6.9 |
0.78 |
89.5 |
6.7 |
0.46 |
89.8 |
5.1 |
0.48 |
|
PSCh/w |
109.5 |
4.0 |
100.7 |
8.0 |
3.06 |
100.0 |
7.9 |
2.86 |
106.7 |
7.6 |
0.83 |
104.1 |
8.8 |
2.25 |
|
LSCh/w |
94.0 |
7.8 |
92.7 |
6.7 |
0.28 |
83.4 |
9.7 |
1.98 |
94.0 |
6.2 |
0.01 |
90.8 |
7.0 |
0.71 |
|
COR |
2.4 |
0.2 |
2.3 |
0.1 |
0.84 |
2.5 |
0.1 |
–1.23 |
2.4 |
0.1 |
–0.20 |
2.3 |
0.1 |
0.86 |
|
COh/w |
136.0 |
4.3 |
132.5 |
11.4 |
0.99 |
129.7 |
7.7 |
1.83 |
141.5 |
8.7 |
–1.49 |
132.7 |
9.1 |
1.25 |
Notes. Bold text highlights diagnostically significant traits and reliably different values.
Neanderthals: Amud 1, 7, Arcy-Sur-Cure C7.1544, Dederiyeh 1, Devil’s Tower 1, La Chapelle-aux-Saints 1, Engis 2, La Ferrassie 1–3, Forbes’ Quarry 1, Kebara 1, Krapina 38.1, 38.12, 38.13, 39.1, 39.4, 39.8, 39.13, 39. 18, Marillac LP01-H02, Le Moustier 1, Obi-Rakhmat 1, Pech de l’Azé 1, Petit Puymoyen 5, La Quina 5, 27, Spy 1, 2, Tabun 1; Middle Paleolithic MMT humans: Qafzeh 3, 6, 7, 9, 11–13, 15, 21, Skhul 1, 5; Upper Paleolithic MMT humans: Cro-Magnon 1, Lagar Velho 1, Laugerie-Basse 1, Malori 1, Nazlet-Khater 2, Muierii 2, Oase 2, Abri Pataud 1, 3, Rosherel 1; modern humans: China ( n = 26), Belgium ( n = 100), sample from around the world ( n = 54).
Samples of Neanderthals and MMT humans after (Wu et al., 2014).
Table 5. Means of groups used in the discriminant analysis, and individual data of Sungirians
|
Trait |
Neanderthals ( n = 22) |
Upper Paleolithic MMT humans ( n = 7) |
Sungir |
S1 |
S2 |
S3 |
|||
|
m |
s |
m |
s |
m |
s |
||||
|
ASCR |
3.04 |
0.16 |
3.30 |
0.17 |
3.08 |
0.21 |
2.9 |
3.3 |
3.1 |
|
PSCR |
2.84 |
0.26 |
3.09 |
0.18 |
2.99 |
0.20 |
2.8 |
3.1 |
3.1 |
|
LSCR |
2.56 |
0.17 |
2.50 |
0.10 |
2.33 |
0.13 |
2.2 |
2.5 |
2.3 |
|
ASCR, % |
36.2 |
1.6 |
37.4 |
1.4 |
36.7 |
0.25 |
36.6 |
36.9 |
36.5 |
|
PSCR, % |
33.6 |
1.8 |
34.5 |
1.4 |
35.6 |
0.45 |
35.3 |
35.4 |
36.1 |
|
LSCR, % |
30.2 |
1.1 |
28.1 |
0.7 |
27.7 |
0.35 |
28.1 |
27.7 |
27.4 |
|
ASCh/w |
93.1 |
5.7 |
90.9 |
8.9 |
91.0 |
4.2 |
95.8 |
88.5 |
88.6 |
|
PSCh/w |
102.4 |
7.8 |
107.5 |
8.1 |
109.5 |
4.0 |
112.5 |
111.0 |
105.0 |
|
LSCh/w |
92.6 |
5.7 |
93.7 |
5.5 |
94.0 |
7.8 |
100.0 |
97.0 |
85.2 |
|
SLI |
62.3 |
4.8 |
44.5 |
8.2 |
46.1 |
5.9 |
52.7 |
44.0 |
41.6 |
Notes. Bold text highlights reliably different traits.
Neanderthals: Dederiyeh 1, La Chapelle-aux-Saints 1, La Ferrassie 1-3, La Quina 5, 27, Le Moustier 1, Pech de l’Azé 1, Petit Puymoyen 5, Spy 1, 2, Tabun 1 (Spoor et al., 2003), Obi-Rakhmat 1 (Glantz et al, 2008), Krapina 38.1, 38.12, 38.13, 39.13, 39.18, 39.20, 39.4, 39.8 (Hill, Radovcic, Frayer, 2014); Upper Palaeolithic MMT humans: Abri Pataud 1, 3, Cro-Magnon 1, Laugerie-Basse 1 (Spoor et al, 2003), Nazlet-Khater 2 (Bouchneb, Crevecoeur, 2009), Muierii 2 (Ponce de León, Zollikofer, 2010), Oase 2 (Ponce de León, Zollikofer, 2013).
groups of the Sungirians clearly place the adolescents S2 and S3 in the group of MMT humans, while the adult male S1 has about the same chance of being assigned to both groups, with a slightly higher attraction to Neanderthals (Table 6). The two-trait classification showed that all the Neanderthals clearly fell into the Neanderthal group, whereas ~29% (two individuals) of the MMT individuals fell outside their titled group and were assigned to the Neanderthal group (Table 7). These “outliers” were individuals Abri-Pato 1 and Oase 2. Their a posteriori probabilities of belonging to the Neanderthal group were 0.734 and 0.847, respectively, and 0.266 and 0.153 for the MMT group.
A similar situation is described for Xujiayao 15 (Northern China), a late Pleistocene individual (Wu et al., 2014). According to the skull morphology, it is fully consistent with the lineage of MMT humans. According to the bony labyrinth structure, it is classified with a very high probability (0.95%) as Neanderthal (Table 8). On this basis, the authors of the paper make a broad generalization. Irrespective of the population position of Xujiayao 15, the implication is that a
“Neanderthal” configuration of the bony labyrinth could have been present in humans of modern morphological type throughout Eurasia during the Late Pleistocene. This makes the feature less of a “Neanderthal” marker and more relevant to the paleobiology of Late Pleistocene Homo , whether it is discrete in itself or a consequence of other aspects of cranial morphology (Ibid.).
Conclusions
Because of its protection, the bony labyrinth is one of the best-preserved structures of the human skull. During the intrauterine period, it takes on its final form. There is minimal bilateral and sexual variability in the morphology of the bony labyrinth. Therefore, its structural characteristics seem the most suitable for analyzing intergroup variability.
Studying the structural characteristics of the inner ear of ancient and modern humans has revealed two morphological types in Eurasia that differ significantly
Table 6. The Sungir people’s posterior probabilities of classification group membership
|
Sungir |
Neanderthals |
Upper Paleolithic MMT humans |
|
S1 |
0.573 |
0.427 |
|
S2 |
0.004 |
0.996 |
|
S3 |
0.001 |
0.999 |
Table 7. Discriminant analysis classification results (by individuals)
|
Individuals |
Percentage |
Neanderthals |
Upper Paleolithic MMT humans |
|
Neanderthals |
100.0 |
22 |
0 |
|
Upper Paleolithic MMT humans |
71.4 |
2 |
5 |
|
Total |
93.1 |
24 |
5 |
Table 8. Comparison of means for classification groups and indicators of individuals other than MMT humans
|
Trait |
Neanderthals |
Upper Paleolithic MMT humans |
Sungir 1 |
Abri Pataud 1 |
Oase 2 |
Xujiayao 15 |
||
|
m |
s |
m |
s |
|||||
|
ASCR |
3.0 |
0.2 |
3.3 |
0.2 |
2.9 |
3.2 |
3.2 |
2.9 |
|
PSCR |
2.8 |
0.2 |
3.1 |
0.3 |
2.8 |
2.8 |
3.3 (?) |
2.8 |
|
LSCR |
2.6 |
0.2 |
2.5 |
0.2 |
2.2 |
2.4 |
2.5 |
2.7 |
|
ASCR, % |
35.9 |
1.5 |
37.2 |
1.4 |
36.6 |
39 |
36 |
34.6 |
|
PSCR, % |
33.6 |
1.6 |
34.5 |
1.7 |
35.3 |
33 |
36 |
33.7 |
|
LSCR, % |
30.5 |
1.1 |
28.3 |
0.9 |
28.1 |
28 |
28 |
31.7 |
|
ASCh/w |
92.6 |
5.0 |
89.5 |
6.7 |
95.8 |
84 |
103 |
87.1 |
|
PSCh/w |
100.7 |
8.0 |
106.7 |
7.6 |
112.5 |
106 |
– |
98.3 |
|
LSCh/w |
92.7 |
6.7 |
94.0 |
6.2 |
100.0 |
92 |
94.1 |
82.8 |
|
SLI |
63.5 |
5.8 |
43.7 |
9.4 |
52.7 |
54 |
55.1 |
61.4 |
Note. Bold text highlights diagnostically significant traits.
in their structure. One belongs to the line of modern morphological type from the Middle Paleolithic, while the other belongs to the Neanderthal line.
The absence of increased bilateral asymmetry of the bony labyrinth was observed in individuals from the Sungir burials. The Sungirians can be considered a morphologically homogeneous group owing to the interindividual variability in the size of the inner ear parts. The comparison of the mean values of the bony labyrinth characteristics in this group with the corresponding indicators of Neanderthals and anatomically modern humans of various chronological associations revealed their undoubted belonging to the latter and reliable differences from the former. Discriminant analysis made it possible to specify this conclusion. It has shown that, according to the bony labyrinth structure, the two young individuals are clearly defined as belonging to the modern morphological type, whereas the adult can be attributed with equal probability to both classification groups. For humans of the modern morphological type, such a situation is not exceptional and even rare. The “Neanderthaloid” features of the structure of the inner ear (the large size of the lateral semicircular canal and the high sagittal index) occur in a small but significant number of people from the Upper Paleolithic. Such representatives include the adult male from the Sungir burials.
Therefore, when diagnosing an individual, it should be taken into account that the “modern” morphology of the bony labyrinth almost unambiguously identifies an individual as belonging to a modern anatomical type, whereas “Neanderthaloid” is not such an obvious marker, since it is found not only in Neanderthals.
Acknowledgment
This study was supported by the Ministry of Science and Higher Education of the Russian Federation (Grant Agreement No. 07515-2022-328).
