Characteristics of double sodium layer over Haikou, China (20.0° N, 110.1° E)
")
Author: Dali Yang, Tiemin Zhang, Jihong Wang, Jianqing Wu, Linmao Wang, Xu Zou, Hongyan Peng
Journal: Солнечно-земная физика @solnechno-zemnaya-fizika
Article in issue: 2 т.5, 2019.
Free access
We study the property of double sodium layer structures (DSLs) in the mesosphere and lower thermosphere (MLT) by a lidar at the low-latitude location of Haikou (20.0° N, 110.1° E), China. From April 2010 to December 2013, 21 DSLs were observed within a total of 377 observation days. DSLs were recorded at middle latitudes of Beijing and Wuhan, China, but were rarely observed at low latitudes. We analyze and discuss characteristics of DSLs such as time of occurrence, peak altitude, FWHM, duration time, etc. At the same time, the critical frequency f oEs and the virtual height h' Es of the sporadic E layer Es were observed by an ionosonde over Danzhou (19.0° N, 109.3° E). We discuss such their characteristics as differences of time, differences of altitude compared to DSLs. We used an Nd:YAG laser pumped dye laser to generate the probing beam. The wavelength of the dye laser was set to 589 nm by a sodium fluorescence cell. The backscattered fluorescence photons from the sodium layer were collected by a telescope with the Φ1000 mm primary mirror.
Lidar, ionospheric layer, double sodium layer
Short address: https://sciup.org/142220332
IDR: 142220332 | UDC: 551.550, | DOI: 10.12737/szf-52201904
Характеристики двойного натриевого слоя над Хайкоу, Китай (20.0° N, 110.1° E)
Изучено свойство структуры двойного натриевого слоя (ДНС) в мезосфере и нижней термосфере лидаром на низких широтах в Хайкоу (20.0° N, 110.1° E), Китай. В период с апреля 2010 по декабрь 2013 г. в общей сложности 377 дней наблюдался 21 ДНС. ДНС были зарегистрированы на средних широтах Пекина и Уханя (Китай), но редко регистрировались на низких широтах. Также были проанализированы и рассмотрены такие характеристики ДНС, как время появления, максимальная высота, полуширина на половине высоты (ПШПВ), длительность и т. д. В то же время критическая частота f oEs и виртуальная высота h' Es спорадического E-слоя Es наблюдались ионозондом над Даньчжоу (19.0° N, 109.3° E). Обсуждаются такие их характеристики, как, например, различия во времени, различия высоты по сравнению с ДНС. Для генерирования зондирующего пучка использовался лазер Nd:YAG с накачкой красителей. Длина волны лазера на красителях была установлена на 589 нм с помощью натриевой флуоресцентной клетки. Флуоресцентные фотоны обратного рассеивания из натриевого слоя были получены телескопом с главным зеркалом Φ1000 мм.
Text of the scientific article Characteristics of double sodium layer over Haikou, China (20.0° N, 110.1° E)
INTRODUCTION
Earth’s atmosphere has a thickness of about 120 km. The atmospheric layer between 80 and 110 km contains neutral metal atoms such as sodium Na, iron Fe, potassium K, calcium Ca, etc. These neutral metal atoms can be detected by a ground-based lidar. The MLT composition is very complex. Meteor ablation occurs when me- teors fly through this atmospheric layer, injecting metal particles into it and forming neutral metal layers. The density of these metal layers is affected not only by kinetic process, but by chemical process as well. Slipher et al. [1921] reported that the first discovery of sodium in the atmosphere was made in 1929. Bowman et al. [1969] first observed sodium layers in the atmosphere with a lidar. Clemesha et al. [1978] first observed the occurrence of a sporadic sodium layer in the atmosphere. Gardner, Voelz [1985] has reported that sodium layers can be disturbed by gravity waves observed with a lidar in the same way as they can be impacted by a tidal wave [Gardner et al., 1986]. Kwon et al. [1987] first observed sodium layers during the daytime. Gardner et al. [1988] have reported that sodium layers are confined to a height 80–110 km and have complex physical, chemical, and kinetic interactions with other atoms, molecules, and ions. According to [Gong et al., 2003], if a sodium layer appears at 105–125 km and is clearly separated from the normal sodium layer (80–105 km), it is called the double sodium layer structure (DSL). Wang et al. [2012] have reported that 17 DSLs were observed during 319 nights; it is equivalent to the 5.3 % probability of finding DSLs at a mid-latitude station (Beijing, China, 40° N, 116° E). In this paper, we report the observations of DSLs from April 2010 to December 2013, and we study characteristics of DSLs at low latitudes.
EQUIPMENT
A sodium resonance lidar is located in Haikou (20.0° N, 110.1° E), China. A tunable Nd:YAG pumped dye laser was used to generate a probing beam. The wavelength of the dye laser was set to 589 nm by using a sodium fluorescence cell. The energy, divergence, and repetition rate of the laser beam were ~42 mJ per pulse, 1 mrad, and 30 Hz respectively. The backscattered fluorescence photons from the sodium layer are collected by a telescope with the primary mirror of diameter 1000 mm. The field of view of the telescope was normally set to ~2 mrad, and the bandpass of the optical filter was ~1 nm. A cooled PMT, fast amplifier, and time-resolved photon counter were used for signal detection, and a computer was used for data collection. Each lidar file contains 5000 laser pulses with an altitude resolution of 97 m. This corresponds to about 3 min for the 30 Hz repetition rate of the laser.
Data have been acquired by the DPS-4 ionosonde over Danzhou, China (19.0° N, 109.1° E), the station closest to the lidar. In this configuration, the lidar and ionosonde detected nearly the same range in the mesopause region. It records data automatically every 15 min, and its frequency scans from 0.5 to 15 MHz for 150 s to create a data file. For comparison, we have chosen data obtained with both the ionosonde and the lidar at Hai-kou from April 2010 to December 2013. The ionosonde SAO files provide information on Es-layer parameters such as f o E s and h' E s .
OBSERVATIONS
Referring to Figure 1, DSLs were observed over Haikou, China on March 4, 2012 at 16:15 UT. This Figure clearly shows that the second sodium layer appeared
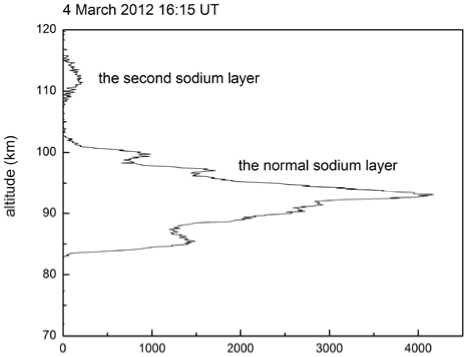
sodium (cm )
Figure 1. A typical DSLs structure observed at 16:15 UT on 4 March 2012 over Haikou at an altitude of 108.0 to 115.2 km. The sodium layer had a peak density of 208 cm–3 and an altitude of 112.1 km. Its full width at half maximum (FWHM) was 3.1 km. The normal sodium layer was at altitudes 82.9–102.7 km and its main peak was at 93.0 km, the sodium density was 4172 cm–3, and FWHM of the normal sodium layer was 4.9 km. The ratio of the DSL peak density was 4.9 %. The gap between the second sodium layer and the normal sodium one was from 102.7 to 108.0 km; the sodium density was nearly zero. The second sodium layer was independent of the normal sodium layer. According to [Gong et al., 2003], it was typical of DSLs.
We have found 21 DSLs in total for 377 days from April 2010 to December 2013; it is a 5.5 % probability of finding DSLs over Haikou, China. This result indicates the probability of DSL occurrence at low and middle latitudes. In addition, in the DSLs over Haikou the density of the second sodium layer was low, no more than 1000 cm–3. Table 1 lists the main parameters of the DSLs, including date, universal time of occurrence, etc.
To determine the characteristics of the DSLs over Haikou, we have statistically analyzed the four-year observation data presented in Figure 2. Figure 2, a shows a histogram of the number of DSLs for each month of observation. The DSLs are demonstrated to occur generally in May, June, July, and August, occasionally in March, November, and December; they are not observed in January, February, April, September, and October. This conclusion is similar to that made by Wang et al. in Beijing [Wang et al., 2012] , where DSLs occur only in spring and summer. Figure 2, b shows the hours when the DSLs were observed. From the observation, DSLs more frequently appeared from 13:00 to 16:00 UT. Figure 2, c shows the peak altitude of the second sodium layer. The peak altitude was more likely to be lower than 110 km, and less likely to be higher than 110, which was quite different from the Beijing observations from 110 to 125 km [Wang et al., 2012] . FWHM of the second sodium layer, shown in Figure 2, d , was between 1.5 and 5.0 km.
At present, theoretical studies indicate that the sodium layer is closely related to the E s layer. Since the second sodium layer is in DSLs, it is located between 105
Table 1
The main characteristics of DSLs at Haikou, China (20.0° N, 110.1° E)
|
No. |
Date |
Timea, UT |
Densityb, cm–3 |
Peak altitude, km |
FWHMc, km |
Duration, min |
RPDd, % |
|
1 |
7 May 2010 |
15:27 |
429 |
108.6 |
3.9 |
50 |
9.8 |
|
2 |
8 May 2010 |
16:04 |
344 |
106.5 |
2.6 |
42 |
10.4 |
|
3 |
13 May 2010 |
17:04 |
344 |
108.3 |
1.7 |
111 |
12.4 |
|
4 |
19 June 2010 |
15:12 |
200 |
105.0 |
3.0 |
86 |
10 |
|
5 |
13 July 2010 |
<13:37 |
255 |
107.9 |
3.1 |
108 |
10.5 |
|
6 |
7 Nov. 2010 |
14:22 |
616 |
105.3 |
1.8 |
125 |
15.4 |
|
7 |
29 Dec. 2010 |
16:24 |
133 |
105.6 |
1.4 |
17 |
10.7 |
|
8 |
6 May 2011 |
<13:08 |
213 |
108.6 |
3.0 |
25 |
5.8 |
|
9 |
18 May 2011 |
15:04 |
293 |
107.3 |
2.1 |
47 |
6.5 |
|
10 |
29 May 2011 |
14:44 |
993 |
106.6 |
2.8 |
106 |
37.2 |
|
11 |
12 June 2011 |
14:51 |
141 |
108.2 |
2.1 |
159 |
2.4 |
|
12 |
17 June 2011 |
14:24 |
477 |
106.5 |
2.3 |
256 |
25.4 |
|
13 |
1 July 2011 |
15:48 |
53 |
115.1 |
1.9 |
92 |
3.2 |
|
14 |
3 July 2011 |
16:09 |
135 |
109.6 |
3.6 |
72 |
3.8 |
|
15 |
14 Aug. 2011 |
<12:30 |
103 |
106.5 |
1.9 |
57 |
6.1 |
|
16 |
22 Aug. 2011 |
15:17 |
140 |
109.4 |
3.1 |
67 |
6.7 |
|
17 |
4 March 2012 |
16:15 |
208 |
112.1 |
3.1 |
69 |
4.9 |
|
18 |
5 June 2012 |
14:58 |
454 |
109.2 |
4.6 |
119 |
13.5 |
|
19 |
1 July 2012 |
13:59 |
407 |
109.3 |
2.7 |
133 |
13.3 |
|
20 |
9 May 2013 |
<11:40 |
540 |
106.7 |
1.7 |
98 |
30.7 |
|
21 |
1 Dec. 2013 |
21:22 |
198 |
108.6 |
1.8 |
59 |
6.9 |
-
aTime is the second sodium layer beginning.
-
bDensity is the peak density of the second sodium layer.
-
cFWHM is full width at half maximum of the second sodium layer.
-
dRPD is the ratio of peak density between the second sodium layer and the normal sodium layer. < denotes that the beginning of the second sodium layer was not detected.
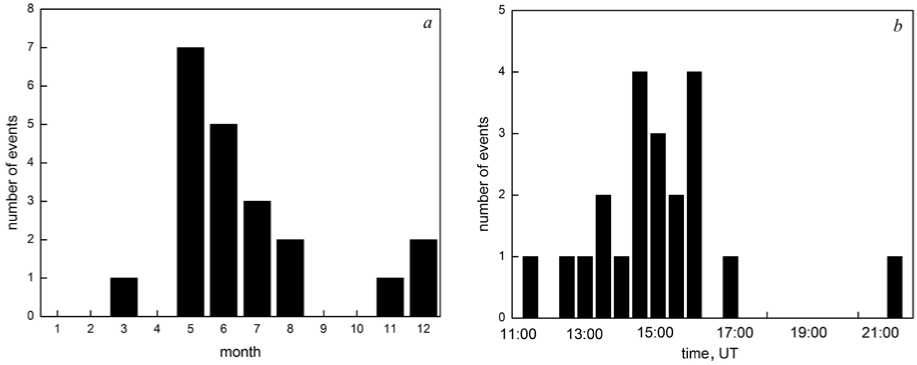
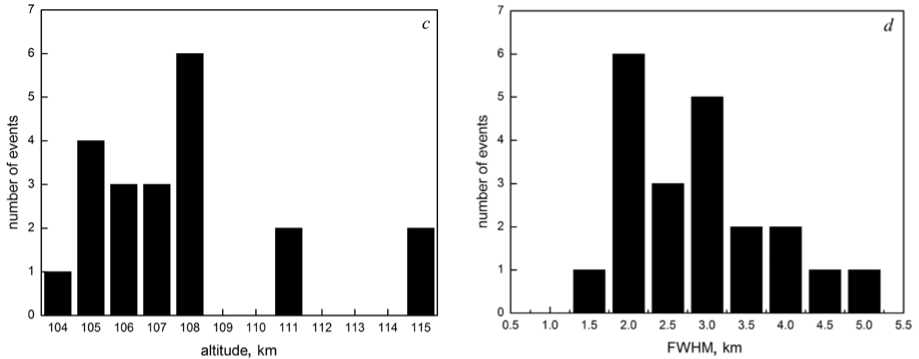
Figure 2 . Statistics of DSLs: the month in which DSLs occurred ( a ); the time when DSLs occurred ( b ); altitude of the second sodium layer ( c ); FWHM of the second sodium layer ( d )
Table 2
The main parameters of Es observed over Danzhou (19.0° N, 109.3° E).
|
No. |
Date |
h' E s , km |
f o E s , MHz |
Duration, min |
Time difference, min |
Altitude difference, km |
|
1 |
7 May 2010 |
– |
– |
|||
|
2 |
9 May 2010 |
– |
– |
|||
|
3 |
14 May 2010 |
106.3 |
5.38 |
60 |
–44 |
2.0 |
|
4 |
19 June 2010 |
113.8 |
5.58 |
135 |
–15 |
–8.8 |
|
5 |
13 July 2010 |
107.5 |
5.00 |
225 |
23 |
0.4 |
|
6 |
7 Nov. 2010 |
107.3 |
3.25 |
150 |
–76 |
–2.0 |
|
7 |
30 Dec. 2010 |
109.4 |
5.28 |
60 |
16 |
–3.8 |
|
8 |
6 May 2011 |
108.8 |
5.15 |
30 |
–8 |
–0.2 |
|
9 |
18 May 2011 |
109.4 |
4.40 |
180 |
–30 |
–2.1 |
|
10 |
29 May 2011 |
111.3 |
5.17 |
120 |
44 |
–4.8 |
|
11 |
12 June 2011 |
115.0 |
5.28 |
150 |
19 |
–6.8 |
|
12 |
17 June 2011 |
105.0 |
5.08 |
285 |
7 |
1.5 |
|
13 |
1 July 2011 |
110.0 |
3.50 |
60 |
–108 |
11.3 |
|
14 |
4 July 2011 |
112.5 |
3.55 |
135 |
–18 |
–2.9 |
|
15 |
14 Aug. 2011 |
108.8 |
5.30 |
120 |
–80 |
–2.3 |
|
16 |
22 Aug. 2011 |
111.3 |
5.50 |
75 |
20 |
–1.9 |
|
17 |
5 March 2012 |
– |
– |
|||
|
18 |
5 June 2012 |
– |
– |
|||
|
19 |
1 July 2012 |
107.5 |
3.77 |
90 |
–10 |
–2.0 |
|
20 |
9 May 2013 |
103.8 |
4.30 |
150 |
–113 |
–7.1 |
|
21 |
2 Dec. 2013 |
– |
– |
Notes. “–” means that there are no Es data. Time difference is the time between DSL and Es peaks; the negative value indicates that first Es appeared and then DSLs. Altitude difference is the second sodium layer of DSLs and h' Es; the negative value suggests that h' E s is earlier than DSLs.
and 120 km in the ionosphere. We have analyzed the change in E s with the occurrence of DSLs. Table 2 lists the main parameters of Es observed over Danzhou (19.0° N, 109.3° E), when DSLs occurred over Haikou. When DSLs were observed, we compared the simultaneous Es with complete data records. Table 2 presents 16 events in total, including h ' Es, f oEs, Es duration, etc. The time difference is between DSLs and Es; the negative value means that first Es appeared and then DSLs. The altitude difference is between the second sodium layer and E s ; the negative value implies that E s was higher than DSLs. As can be seen in Tables 1 and 2, Es is strongly sporadic in the presence of DSLs. When DSLs occurred, 62.5 % of f oEs exceed 5 MHz. The time difference between DSLs and h ' Es is within ±60 min (75.0 %). We can also see that the altitude difference is within ±2 km (62.5 %), within ±5 km (87.5 %). According to the analysis of E s , DSLs are closely related to E s .
DISCUSSIONS
Since the lidar and the ionosphere were not located at the same place, weather conditions and equipment of the two places were more uncertain. There was a smaller amount of recorded data from the two places for the same time. We have figured out that DSLs and Es interrelate and have determined the time difference and the altitude difference for the DSLs and Es data. We selected the DSLs observed on May 13, 2010, and the data on Es were also relatively complete. As shown in Figure 3, a, the density and altitude distributions were recorded from 13:30 to 21:30 UT. As can be seen from the Fig- ure, the DSLs lasted for 111 min from 17:04 to 18:55 UT; during this period, the DSLs appeared three times (indicated by the arrow). The first DSLs began at 17:04 UT, the density of the second layer was up to 344 cm–3 at 17:27 UT, and the altitude was 108.2 km. The second DSLs followed with an interval of 22 min between the two DSLs, the altitude of the second sodium layer was 108.8 km. At 18:28 UT, the third DSLs occurred, and the altitude of the second sodium layer was 106.0 km. Figure 2, b shows the distribution of foEs and h'Es over Danzhou. From 13:15 to 15:00 UT, there was no Es observed. At 15:15 UT, foEs dropped to 4.35 MHz and h'Es increased to 117.5 km. Thus there were three consecutive Es, the first Es at 16:00 UT, foEs at 4.60 MHz, and h'Es at 113.8 km. The second Es was at 16:45 UT, foEs increased to 5.38 MHz, and h'Es decreased to 106.3 km. The third Es was at 17:45 UT with the foEs intensity of 5.31 MHz and h'Es at 112.5 km. The second and third foEs were more intense, and two stronger Es were 60 min apart. After 18:00 UT, the foEs intensity started to decrease. At 21:15 UT, the foEs intensity increased to 4.17 MHz and h'Es was at 103.8 km. According to the above observations, there were three Es and three DSLs. The Es occurred, on average, 60 min earlier than the DSLs and the altitude difference between h'Es and the second sodium layer was, on average, within 8 km. The occurrence of DSLs is shown to be related to Es.
CONCLUSION
DSLs were observed with a lidar over Haikou, China (20.0° N, 110.1° E) from April 2010 to December 2013.
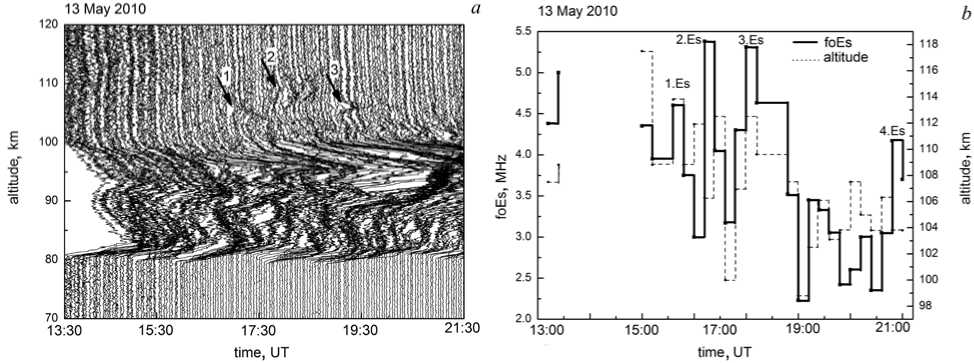
Figure 3 . Distribution of the peak density and altitude during the occurrence of the second sodium layer over Haikou between 13:30 and 21:30 UT ( a ); distribution of f oEs and h' Es observed over Danzhou on May 13, 2010 from 13:00 to 21:00 UT ( b )
We have found 21 DSLs during 377 observation days, which amounts to a 5.5 % probability. The probability of occurrence of DSLs at low latitudes is consistent with that at middle latitudes. DSLs occur generally in May, June, July, and August. In addition, the density of the second sodium layer of DSLs was low, no more than 1000 cm–3. According to the analysis of DSLs and E s , DSLs are closely related to E s . The time difference between DSLs and h' Es is within ±60 min (75.0 %). We can also see that the altitude difference is within ±2 km (62.5 %) and within ±5 km (87.5 %).
This research is supported by National Natural Science Foundation of China under grant No. 41364005 and the Open Fund for State Key Laboratories under grant No. Y62612A87S. We acknowledge the State Meridian Project database for providing the data. We thank teachers and students of the lidar project team.
References Characteristics of double sodium layer over Haikou, China (20.0° N, 110.1° E)
- Bowman M.R., Gibson A.J., Sandford M.C.W. Observation of mesospheric Na atoms by tuner laser radar. Nature. 1969, vol. 221, no. 1, pp. 456-458.
- Clemesha B., Kirchhoff V., Simonich D., Takahashi H. Evidence of an extra-terrestrial source for the mesospheric sodium layer. Geophys. Res. Lett. 1978, vol. 5, iss. 10, pp. 873-876 DOI: 10.1029/GL005i010p00873
- Gardner C.S., Voelz D.G. Lidar measurements of gravity wave saturation effects in the sodium layer. Geophys. Res. Lett. 1985, vol. 12, iss. 11, pp. 765-768. i011p00765 DOI: 10.1029/GL012
- Gardner C.S., Voelz D.G., Sechrist C.F, Segal A.C. Lidar studies of the night-time layer over Urbana Illinois. Seasonal and nocturnal variations. J. Geophys. Res. 1986, vol. 91, iss. A12, pp. 13659-13673 DOI: 10.1029/JA091iA12p13659
- Gardner C.S., Senft D.C., Kwon K.H. Lidar observations of substantial sodium depletion in the summertime Arctic mesosphere. Nature, 1988, vol. 332, pp. 142-144.
- Gong S.S., Yang G.T., Wang J.M., Cheng X.W., Li F.Q., Wan W.X. A double sodium layer event observed over Wuhan, China by lidar. Geophys. Res. Lett. 2003, vol. 30, iss. 5, pp. 13-1-13-4 DOI: 10.1029/2002GL016135
- Kwon K.H., Gardner C.S., Senft D.C, Roesler F.L., Harlander J. Daytime lidar measurements of tidal winds in the mesospheric sodium layer at Urbana, Illinois. J. Geophys. Res. 1987, vol. 92, iss. B8, pp. 8781-8786.
- Slipher V.M. Emissions in the spectrum of the light of the night sky. Publ. Astron. Soc. Pac. 1929, vol. 41, pp. 262-263.
- Wang J., Yang Y., Cheng X., Yang G., Song S., Gong S. Double sodium layers observation over Beijing, China. Geophys. Res. Lett. 2012, vol. 39, iss. 15, pp. L15801-1-L15801-5 DOI: 10.1029/2012GL052134
