Comparative analysis of the energy efficiency of modern environmentally friendly computers

Author: Barta Va Klrn, Szalay Zsigmond Gbor, Kovcs Rpd Endre
Journal: Региональная экономика. Юг России @re-volsu
Section: Фундаментальные исследования пространственной экономики
Article in issue: 3 (21), 2018.
Free access
As a result of technological advances, the performance of computers is growing continuously, while at the same time, their energy consumption is growing, too. Computer development needs to focus increasingly on finding energy efficient solutions to keep the operation of supercomputer centers on a sustainable level. As a result, green computing is getting more and more important in the world of supercomputers as well. Our paper examines the technical data of supercomputers (HPC) - with a focus on performance and energy consumption - on TOP500 and Green500 lists released over the past 10 years. The computing capacity of the machines on the TOP500 list of the most powerful computers is growing exponentially. Until 2017 the rate of growth of the energy efficiency indicator was slower than that of the computing capacity, therefore the total energy consumption of the machines on the TOP500 list was continuously increasing. This trend seems to have changed; in the period from November 2016 to June 2017 the growth rate of the energy efficiency of supercomputers exceeded the increase in their computing capacity...
Green computing, energy efficiency, hpc, supercomputer, top500 list, green500 list, exascale computer
Short address: https://sciup.org/149131269
IDR: 149131269 | UDC: 338.49 | DOI: 10.15688/re.volsu.2018.3.8
Компаративный анализ показателей энергоэффективности современных экологичных компьютеров
В результате технологического прогресса характеристики компьютеров постоянно совершенствуются на фоне роста их энергопотребления. Развитие компьютерной техники вынуждает все больше концентрироваться на поиске энергоэффективных решений для работы центров суперкомпьютеров на приемлемом и устойчивом уровне. В результате энергоэффективные (экологичные) компьютеры становятся все более востребованными среди суперкомпьютеров. В статье изучаются технические и экономические данные суперкомпьютеров с учетом их энергопотребления (списки топ-500 суперкомпьютеров и 500 энергоэффективных компьютеров были составлены 10 лет назад). Мощность компьютеров в списке топ-500 (список самых энергетически мощных компьютеров) увеличивается по экспоненте. До 2017 г. скорость роста энергоэффективного показателя была медленнее, чем мощность компьютеров, тем более что общее энергопотребление компьютеров из списка топ-500 постоянно увеличивалось. Этот тренд изменился с ноября 2016 по июнь 2017 г., когда рост энергоэффективности суперкомпьютеров превысил рост их мощности...
Text of the scientific article Comparative analysis of the energy efficiency of modern environmentally friendly computers
DOI:
-
I. Introduction
The development of computers has been steady since their first appearance. According to Moore’s law the number of transistors in a dense integrated circuit doubles approximately every two years. The technological development of the last decades has proven this prediction from1965 to be right. Today, however, there are several articles that discuss the end of Moore’s law [1; 7; 17].
Nowadays, the largest computers can perform thousands of TFlop operations in1 second. By the terminology introduced in the 1960s, a system that performs at or near the current highest operational rate is called a supercomputer. These systems are also called High-Performance Computing (HPC) systems. (HPC is the field of IT specializing in supercomputers.)
Initially the only goal in the development of computers was to achieve higher computing capacity. In the early 2000s, energy efficiency became more important in many areas. This consideration has also become more prominent in the development of computers and data centers. The capacity of supercomputers is growing rapidly. If their energy consumption was to increase at the same rate, the total cost of ownership of the largest supercomputers would be prohibitive due to their energy consumption. It would be a serious challenge, not only to limit the cost, but also to provide the sufficient power. This is the reason why more and more attention is paid to the energy consumption of computers, especially
HPCs. Therefore, the supercomputers are being ranked on energy efficiency too. Because this is an important aspect of development, innovative technical solutions get a lot of attention. There are several fields - research, development, hosting -, which require the construction of bigger and bigger data centers. When designing and operating these data centers, the innovations in energy efficiency are key variables.
-
I.1. Green IT
Green IT is not just about keeping the power consumption of computers in hand. The green thinking has to be present throughout the entire life-cycle of devices from production to operation, until decommissioning and then managing the electrical waste. Green IT includes the energy efficient hardware, well-designed data centers, the use of green software -even the software development itself may be green -, and the creation of an appropriate IT strategy [14].
If we restrict our examination to the operation of the IT infrastructure, we have to concentrate on how the consumption of energy is managed. The energy cost of a larger data center typically represents between 10 % and 20 % of TCO (Total Cost of Ownership) (fig. 1) [2; 13; 16]. Choosing the right hardware elements and creating a good cooling system can therefore significantly reduce operating costs. The HPC systems are flagships of technical development. The new, innovative hardware and the new concepts in the design of data centers appear in
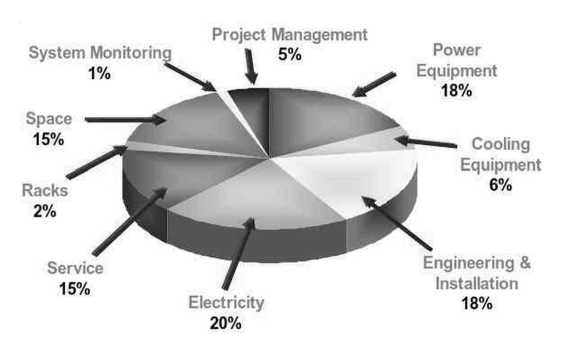
Fig. 1. A review of the breakdown of TCO components of a data center Note. Source: [16].
these systems first. System architects pay attention to these supercomputing systems, and the experiences gained here contribute to the general development of the IT sector.
-
I.2. The significance of the energy efficiency of supercomputers
In some areas of science, research would require the construction of computers with more and more computing capacity. However, this is not only impeded by the costs of construction, but also the operating costs of computing centers.
For many years, researchers have been interested in how and when it would be possible to build an exascale computer [8; 10; 12; 18]. The exascale computer is capable of at least one exaFlopS (1000 petaFlopS).
Japan and China both do serious research to achieve this goal [5; 20]. In 2015, the United States of America has announced its Exascale program, after President Barack Obama had signed the executive order: Creating the National Strategic Computing Initiative. According to this program, an exascale computer is meant to be constructed within 10 years [15].
Examining the growth trend of the TOP500 supercomputers’ energy efficiency indicators provides an important basis for predicting future energy consumption. Therefore, this paper examines how the energy efficiency of HPCs has evolved over the past ten years and tries to draw some conclusions about the expected development.
-
II. Materials and Method
-
II.1. The TOP500 list
The TOP500 list of supercomputers has been published twice a year since 1993.These lists rank the most powerful non-distributed computer systems in the world. (Distributed system – system of network linked autonomous computers.) These lists well represent the trends in the development of high performance computing. The lists are published in June, at the time of International Supercomputing Conference, and in November at the time of ACM/ IEEE Supercomputing Conference [19]. The ranking is based on the LINPACK Benchmark. This benchmark is to solve a dense system of linear equations. The user can get the maximal achieved performance Rmax (Gflop/s) for the problem size Nmax, and the size where half the Rmax execution rate is achieved (N1/2). These results are completed with the value of Rpeak. This is the theoretical peak performance Gflop/s for the machine. It can be calculated from advertised clock rate of the CPU [3].
-
The ranking is based on the value of RMAX. Nowadays this value is measured in teraflops (trillion floating point operations per second).
-
II.2. The Green500 list
As the energy efficiency became more and more a central question in the course of general technical development, the measurement of energy consumption and the number of floating point operations per unit of energy, became important data points in the examination of supercomputers. Virginia Tech computer science professor Wu-Chun Feng in 2006 launched the Green500, a project, which tracks and ranks the fastest systems in the world, by their performance per watt. The first Green500 list was published in November 2007. From this moment on, the supercomputers of the TOP500 list was being ranked twice a year on their energy efficiency as well. The Green500 list was always published after the release of the TOP500 list [9]. The power measurement methodology of the two lists has been standardized in 2016. This has made it possible to unify the two lists [6].
-
II.3. The indicators of energy efficiency and their measurement
In 2005 Wu-Chun Feng and his colleagues in Los Alamos National Laboratory surveyed which indicators would be best suited to characterize the energy efficiency of computers. In their investigations the performance-power ratio - despite all of its disadvantages - produced the most measurable and comparable results [11].
No metric has been found to be more suitable since. So the computers on the Green lists are ranked by the number of floating point operations performed with the use 1J (1Ws) energy. Its unit of measurement is GFlopS/W. The LINPACK Benchmark is used for the measurement; the detailed description of methodology can be downloaded from the Top500 organization’s website [4]. During the test, the system’s total energy consumption is measured, including computational nodes, interconnect network, head or control nodes, storage system, and cooling system (fig. 2).
-
II.4. Methodology
Our research is based on data from the TOP500 and Green500 lists published from November 2007 to June 2017. In the list published in November 2017, many of the supercomputers did not have energy consumption data, so we could not consider this list at several analyzes. In our research we have studied various statistical indicators. We analyzed the time series data using regression curves and we made predictions based on them. By computing the correlation coefficient of the indicators, we examined
the relation between performance and energy efficiency. Furthermore using data from the last complete Green500 list, we examined the dispersion of the supercomputers based on energy efficiency.
-
III. Results
-
III.1. Growth of the computing performance
The performance of supercomputers with the highest computing capacity is increasing continuously. Growth isn’t consistent; it’s characterized by large leaps in the second half of the examined period. In 2011 the Japanese K-computer took the first place of the TOP500 list. It has produced three times greater RMAX value, than the previous leader. The next leap occurred in June 2013 when the Chinese Tianhe-2 (MilkyWay-2) supercomputer became the
leader of the list. Its performance was 33, 862, 700 MFlop/s, nearly doubling the performance of the former leader Titan. This supercomputer remained on the top of the list up until June 2016 when another Chinese supercomputer, the Sunway TaihuLight took the first place. It has more than 2.74 times larger computing performance than the MilkyWay. It has preserved its leadership since then.
-
General technical development is better characterized by the aggregate value of RMAX on the TOP500 lists. This sum shows a more constant growth (fig. 3).
From 2007 to 2011 the TOP1 supercomputers’ computing performance was only 5-6 percent of the aggregate performance of the TOP500 supercomputers. But in June 2011 the performance of the leading K-computer had 13.85 % of the total performance of
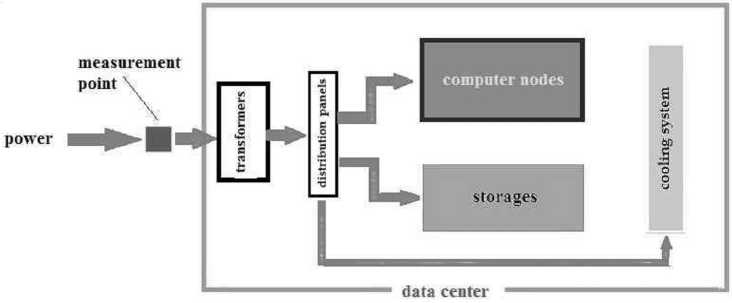
Fig. 2. Power measurement schematic
Note. Source: own editing.
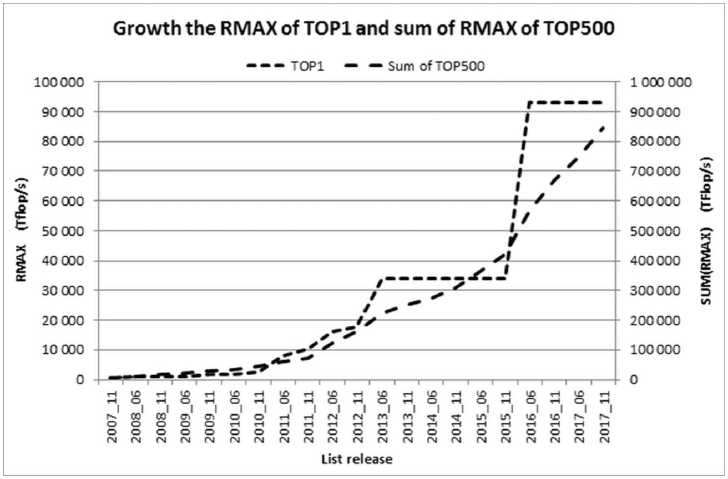
the list. From this time the TOP1 supercomputers typically have more than 10 % part of the aggregate performance. Therefore, from 2012, the large leaps on the top are reflected in aggregate RMAX values too. The graph of RMAX’s aggregate values shows a leap in June 2013 what was followed by a relatively slower increase. This is partly due to the lack of change at the top of the list for three years. The increase of the sum of RMAX values has remained slow despite of the next leap in June 2016. The growth was exponential at all time, but the regression functions which describe the two periods, have different parameters (fig. 4).
-
III.2. Energy consumption of supercomputers
Serious challenge is to restrict the growth of the supercomputers’ energy consumption. If this would increase at similar rate as the performance of supercomputers, than power supply of larger data centers would be an unmanageable problem soon. Examining the aggregate energy consumption of all supercomputers on TOP500 lists, it can be seen that this value has increased linearly until 2016 (fig. 5).
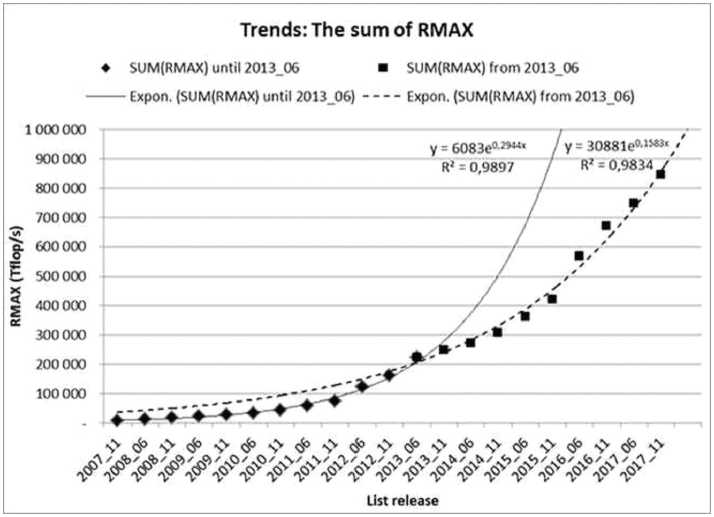
Fig. 4. Trend of sum of RMAX of TOP500
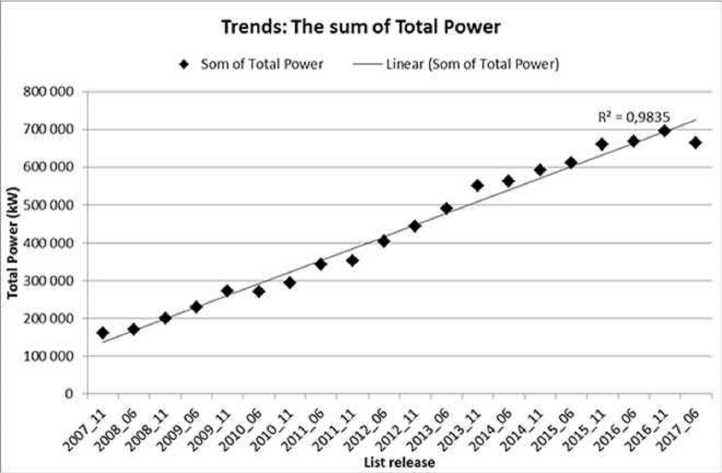
Fig. 5. Sum of Total Power of TOP500
As the performance of the supercomputers increased at a growing pace, the linear growth of the energy consumption indicates, that the energy efficiency has increased too, but at a slower pace. By 2017 this trend has changed. The aggregate energy consumption of supercomputers on the list released in June was less, than that was on the previous list. So, during this period the energy efficiency increased more than the performance.
Next, we examine in more detail how the energy efficiency indicator of supercomputers - the number of operations performed with the use 1J (Ws) energy (MFlopS/W) – has changed over the past 10 years.
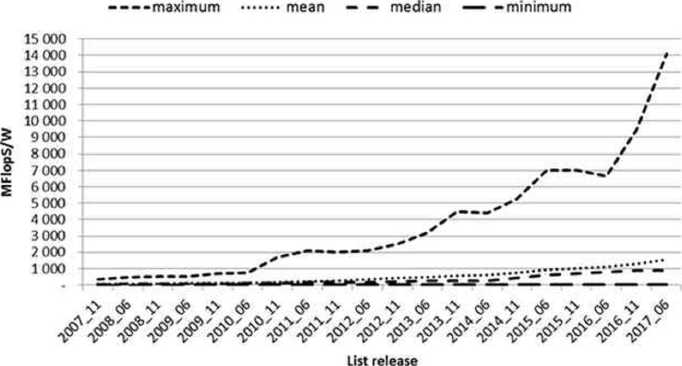
The increase in the energy efficiency indicator of Green’s top-end supercomputers is much less of a constant than the rate of increase of the RMAX value, at the top of the TOP500 list. The Green list includes only supercomputers of the TOP500 list. Therefore it may occur that a supercomputer from the top of the Green list is not included on a subsequent list, instead it is replaced by a supercomputer with a lower energy efficiency indicator, but higher computational capacity. It may also happen, that the leader of the list had been upgraded, that resulted in a somewhat worse energy efficiency indicator. It was so in June 2013, when the previous leader, the Japanese Tsubame-KFC remained on the top of the Green list, but with a higher RMAX value, and a lower energy efficiency indicator. In June 2016, the Japanese Shoubu supercomputer preserved its first place on the Green list while it has made a significant leap forward on the TOP500 list, its energy efficiency deteriorated. In conclusion the maximum value of energy efficiency indicator (MflopS/W) on the Green lists does show some fluctuation (fig. 6). Therefore, it is better to examine the change in the average MflopS/ W value of Green5 supercomputers.
When the first Green lists were compiled, the number of operations performed with the use of 1J (Ws) energy seemed to be growing linearly. From the data of the first 5 years, Wu Feng co-founder of the Green500 produced a linear extrapolation for the average MFlopS/W values of both Green5 and Green10 supercomputers. Based on these, he gave forecasts for the MFlopS/W values expected. According to him, the average value of energy efficiency indicators of Green5 would have been 5,780 MFopS/W in 2018 [8]. However this value was already exceeded in June 2015. Furthermore, the average value of Green5 on the November 2016 list was 7,089 MFlopS/W, which is higher than the 6,930 MFlopS/W predicted for 2020 (fig. 7).
Examining the graph of the average value of energy efficiency indicators of Green5 supercomputers, it can be seen, that it has a growing pace. The exponential regression curve fits well (R2 = 0.9786) with the points of the graph. However there was a little relapse in November 2015. At that point, the value calculated from the data of the list is only 83 % of the value of the fitted regression curve. It was because the former second and third supercomputers dropped out from the Green5; and the ones which were behind them moved ahead, so it can be
considered as an outlier value. But in 2017, significant improvement was made. The value calculated from data of the June 2017 Green list is already 12 % higher than the value of the fitted regression curve, and the value calculated from the data of the November 2017 list is 20 % above the value of the fitted regression curve. It is noteworthy that not only one or two very powerful supercomputers have made it to the top of the list, but eight supercomputers in June, and another five in November exceeded the previous leader.
According to this trend line, if development continues at such a rate, the energy efficiency indicator projected for 2020 will be 33,242MFlopS/W.
At the end of the Green list, the values of energy efficiency indicators are far from those values which are at the head of the list, but even from the average value of the list. At the end of the list, the growth rate is very slow. The lowest value on the June 2017 list hardly exceeded the median value of the 2007 list (fig. 6). Since June 2009, the worst energy efficiency indicator has only increased by a factor of 4, while the best value increased more than 26 times. In conclusion the distance between the worst and the best values is growing continuously. While in 2007 the highest value was 98 times larger, than the lowest, in 2017 this ratio is 269 (table).
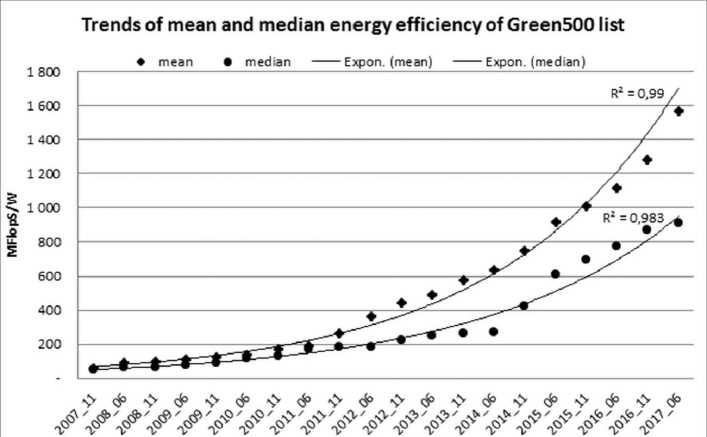
The trend in the energy efficiency of supercomputers on the TOP500 list is characterized well by the mean and median MFlopS/W values. These - like the maximum values -, show accelerating growth. Of course this is much slower than the growth at the top of the list (fig. 8).
The graph shows that the median value is notably below the mean value. For example, on the latest complete list of June 2017, the median is only 58 % of the mean. This indicates that the energy efficiency of supercomputers at the top of the Green list stands out, and a large portion of supercomputers are lagging behind significantly.
The examination of the correlation between MFlopS/W and RMAX indicators of the lists shows that the correlation coefficient is typically around 0.28. The positive value of correlation coefficient suggests that the energy efficiency of supercomputers with higher performance is better than that of the smaller
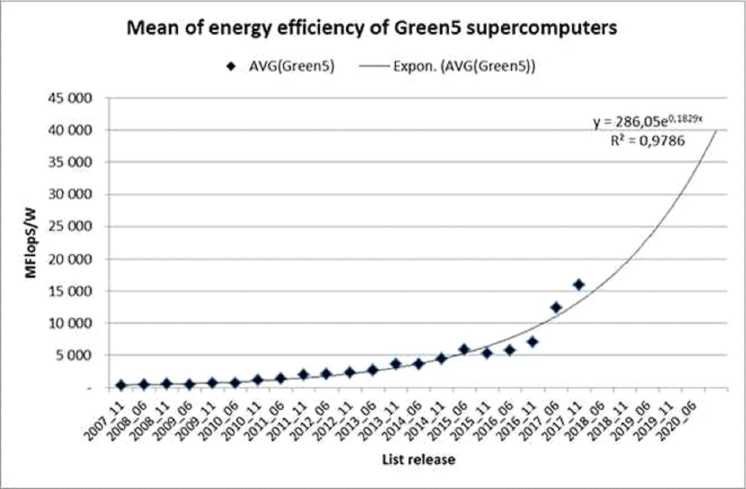
Fig. 7. Mean of energy efficiency of Green5 supercomputers
Table
Energy efficiency in Green500 lists in 2007, 2009 and 2017
|
List release |
Minimum MFlopS/W |
Green1 MFlopS/W |
|
2007_11 |
3.65 |
357.23 |
|
2009_06 |
13.03 |
536.24 |
|
2017_06 |
52.39 |
14,110 |
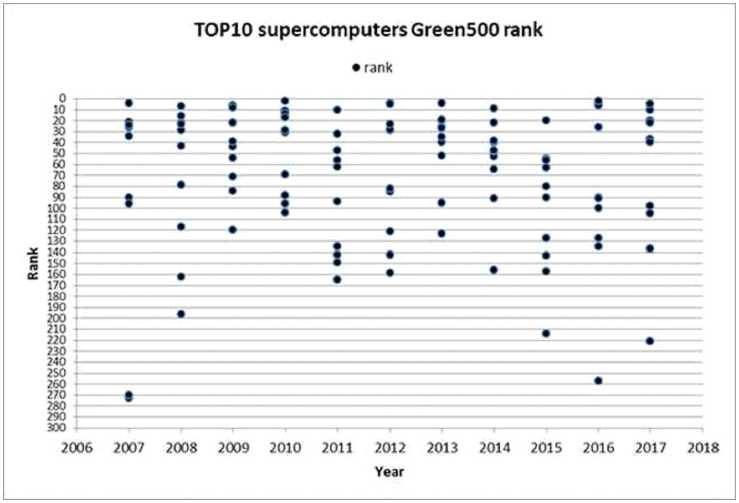
ones. But the small value of the coefficient shows that the difference is not too large. The better indicators of the top supercomputers are partly due to the fact that the systems at the top of the TOP500 list are relatively new, or are recently upgraded supercomputers. These are designed with the most modern principles in mind and they contain the latest energy-efficient hardware. The number of operations per watt-second is gaining more of an importance for supercomputers of a larger scale, because the possible savings in energy are higher. Accordingly, the TOP10 supercomputers can usually be found at the top of the
Green lists too; - with only one or two exceptions -they are in the first half of the lists. Almost every year, there was at least one supercomputer in the TOP10, which was in the Green10 too (fig. 9).
It is worth examining the dispersion of supercomputers based on their energy efficiency indicators, on the June 2017 Green list. It can be seen that the vast majority of supercomputers are in the lowest category, with values under 1.5 GFlopS/W (1,500 MFlopS/W). There are far fewer supercomputers in the interval between 1.5 and 3 GFlopS/W (1,500 and 3,000 MFlopS/W). And only one or two supercomputers
List release
are in the categories above 4 GFlopS/W (4,000 MFlopS/W) (fig. 10).
Only 14 supercomputers achieve half of the Green1 supercomputer’s MFlopS/W value, and only a further 16 achieve the quarter of it. Thus, 94 % of the TOP500 supercomputers’ have energy efficiency far below the current technological possibilities.
It means that - with the exception of a relatively small number of supercomputers -, there was little emphasis placed on better energy efficiency, during the design phase. For a larger part of the machines on the TOP500 list, energy efficiency was not included among the most important goals of construction.
It is worth comparing the increase of the mean value of RMAX of the TOP500 supercomputers, and the change in the mean of MFlopS/W indicator (fig. 11). As shown clearly on the graph, until 2017, the growth rate of energy efficiency lagged behind the increase of performance. So the total energy consumption of the TOP500 supercomputers has grown steadily. As it can be seen on the graph, until November 2016 the growth rate of energy efficiency lagged behind the increase of performance. So the total energy consumption of the TOP500 supercomputers has grown steadily. But in the next 6 months, - after the release of the November 2016 list -, the growth rate of the average MFlopS/W indicator exceeded the growth of the average RMAX value. While the former increased by 22 %, the latter increased only by 11 % (fig. 11). If this marks a new trend, the energy consumption of supercomputers remains manageable, even with a significant increase in performance.
-
IV. Conclusions
Our examinations show that only a few supercomputers have outstanding energy efficiency indicators. But if average energy efficiency will increase faster than the average computing capacity of supercomputers, it is likely that energy consumption will not grow to an unsustainable size to block further development.
The current leader of the TOP500 list has a 93 petaFlopS performance. It would only be slightly more than 10-fold of an increase to achieve the exaFlopS. The construction of an exascale supercomputer can be done within a foreseeable future. The biggest challenge would not be the construction of a computer with such computing capacity, but to develop supercomputing software and to curtail the energy consumption to a reasonable level. It would be possible to construct an exascale computer with the hardware available today, but it would be prohibitively expensive. The performance of an exascale supercomputer would be 10.751 times higher than the RMAX of the current TOP1 supercomputer. This supercomputer takes the 20th place in the Green list published in November 2017. Its total energy consumption is 15,371 MW. The energy consumption of exascale computer – built according to the specifications of today’s TOP1 supercomputer -would be at least 10.751 times the energy
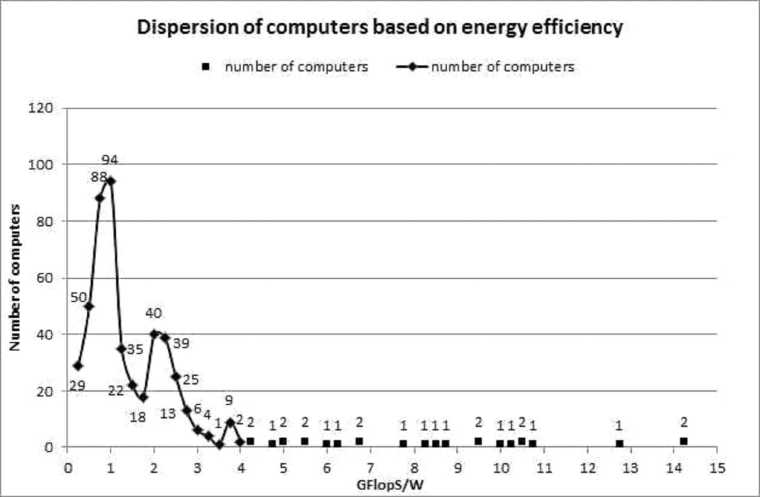
Fig. 10. Dispersion of supercomputers, based on Green list June 2017
Trends: Mean of RMAX and mean of MFIopS/W
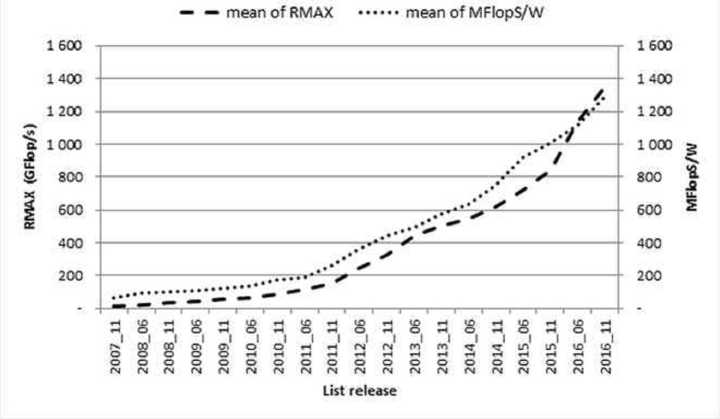
Fig. 11. Growth of average RMAX and average MFlopS/W
consumption of current TOP1 supercomputer. So it would be more than 165.25 MW (10.751*15.371 MW). If the current growth of the MFlopS/W value continues, the energy needs of an exascale computer built in 2020 – calculated using the 33.24GflopS/W energy efficiency indicator predicted by the trend line (fig. 7) - would be only 30.08 MW.
So, there are still significant technical improvements needed, in order to build an affordable and sustainable exascale computer. Looking at development trends, this could happen in the near future.
References Comparative analysis of the energy efficiency of modern environmentally friendly computers
- Brooks R. The End of Moore’s Law. URL: https://rodneybrooks.com/the-end-of-moores-law/.
- Danilov S. Consolidate with Oracle Engineered Systems and Cut Your Costs. URL: https://www.slideshare.net/IPExpo/consolidate-with-oracleengineered-systems-and-cut-your-costs.
- Dongarra J.J., Luszczek P., Petitet A. The LINPACK Benchmark: Past, Present, and Future. July 2002. URL: http://www.netlib.org/utk/people/JackDongarra/PAPERS/hplpaper.pdf.
- Energy Efficient High Performance Computing Power Measurement Methodology (version 2.0 RC 1.0). Top500.org. URL: https://www.top500.org/static/media/uploads/methodology-2.0rc1.pdf.
- Feldman M. China Will Deploy Exascale Prototype This Year. URL: https://www.top500.org/news/china-will-deploy-exascale-prototype-this-year.
- Feldman M.Energy-Efficient Supercomputing Comes of Age with TOP500-Green500 Merge. URL: https://www.top500.org/news/energy-efficient-supercomputingcomes-of-age-with-top500-green500-merge.
- Feldman M. Moore’s Law Is Breaking Down, But That’s OK. URL: https://www.top500.org/news/mooreslaw-is-breaking-down-but-thats-ok.
- Feng W. On the Path to Energy-Efficient Exascale: A Perspective from the Green500. URL: https://synergy.cs.vt.edu/pubs/talks/140327-HPCC-Green500.pdf.
- Green500.org. URL: https://www.green500.org.
- Hill R. The Challenges of Energy Efficient Exascale Computing. URL: https://www.enterprisetech.com/2013/04/30/the_challenges_of_energy_efficient_exascale_computing.
- Hsu C.-H., Feng W.-C., Archuleta J.S. Towards Efficient Supercomputing:A Quest for the Right Metric. Parallel and Distributed Processing Symposium, 2005. Proceedings 19th IEEE International. Denver, Colorado, IEEE Publ., 2005. 8 p.
- Hsu J. When Will We Have an Exascale Supercomputer? URL: http://spectrum.ieee.org/computing/hardware/when-will-we-have-an-exascalesupercomputer.
- Koomey J., Brill K., et al. A Simple Model for Determining True Total Cost of Ownership for Data Centers. Uptime Institute White Paper, Version 2, 2007. 9 p.
- Murugesan S., Gangadharan G.R. Harnessing Green IT Principles and practices.Wiley Publ., 2012. 395 p.
- Obama B. Creating a National Strategic Computing Initiative. Executive Order 13702, Federal Register, 2015, 80.148: 46177.
- Rasmussen N. Determining Total Cost of Ownership for Data Center and Network Room Infrastructure. Schneider Electric. White Paper 6, 2011. 8 p.
- Simonite T. Moore’s Law Is Dead. Now What? MIT Technology Rewiev, 2016.
- Thibodeau P. Scientists, IT Community Await Exascale Computers. URL: http://www.computerworld.com/article/2550451/computer-hardware/scientists-it-community-await-exascale-computers.html.
- Top500.org. URL: https://www.top500.org.
- Trader T. Japan’s Post-K Computer Hits 1-2 Year Speed Bump. URL: https://www.hpcwire.com/2016/09/08/japan-post-k-computer-hits-1-2-year-speed-bump.
