Comparative Evaluation of Supervised Learning Algorithms for Breast Cancer Classification

Author: Adithya Kusuma Whardana, Ruth Kristian Putri
Journal: International Journal of Engineering and Manufacturing @ijem
Article in issue: 4 vol.15, 2025.
Free access
Breast cancer is a leading cause of mortality among women worldwide, particularly in developing countries. Accurate and early diagnosis is crucial to improve patient outcomes. This study compares the performance of three supervised machine learning algorithms—Support Vector Machine (SVM), K-Nearest Neighbor (KNN), and Random Forest (RF)—in classifying breast cancer cases using the Breast Cancer Wisconsin dataset. The dataset consists of 569 instances with 33 features, categorized into malignant and benign classes. Each method was evaluated based on its classification accuracy. The results show that Random Forest achieved the highest accuracy at 94.07%, outperforming SVM with 90.06% and KNN with 90.00%. The findings suggest that Random Forest provides the most reliable performance for breast cancer classification within the scope of this dataset. This study highlights the importance of selecting an appropriate algorithm to enhance diagnostic precision and recommends Random Forest as an effective method for similar classification tasks.
Breast Cancer, K-Nearest Neighbor (KNN), SVM (Support Vector Machine), Random Forest
Short address: https://sciup.org/15019869
IDR: 15019869 | DOI: 10.5815/ijem.2025.04.03
Text of the scientific article Comparative Evaluation of Supervised Learning Algorithms for Breast Cancer Classification
Breast cancer is a malignant disease that arises from abnormal growth in the breast cells, which can invade surrounding tissues and metastasize to other parts of the body [1]. Globally, breast cancer is one of the leading causes of cancer-related deaths among women, second only to lung cancer in prevalence [2]. Although there are various detection methods, such as imaging and physical examinations, they are prone to human error and can be time-consuming, which leads to delays in diagnosis and treatment [5]. Early detection of breast cancer plays a crucial role in improving treatment outcomes and patient survival rates, where early intervention can increase survival chances up to more than 86% [4]. Traditional detection methods rely heavily on physical examinations and imaging techniques, which are timeconsuming and prone to human error [5]. Machine learning has been increasingly adopted to support early diagnosis efforts by analyzing medical data patterns that are often difficult to detect manually [6]. Machine learning algorithms such as Support Vector Machine (SVM), K-Nearest Neighbor (KNN), and Random Forest (RF) have shown promising results in breast cancer classification tasks [7, 8]. In addition, advanced image denoising techniques have been explored to improve data quality before classification tasks [9].
Machine learning has been increasingly adopted to support early diagnosis efforts by analyzing medical data patterns that are often difficult to detect manually [6]. Machine learning algorithms such as Support Vector Machine (SVM), K-Nearest Neighbor (KNN), and Random Forest (RF) have shown promising results in breast cancer classification tasks [7, 8]. RF is often considered the most accurate, yet suffers from computational complexity that makes it less feasible for real-time diagnosis in clinical settings [15]. This study aims to systematically evaluate and compare the performance of SVM, KNN, and Random Forest algorithms for breast cancer classification using the Breast Cancer Wisconsin dataset. The primary goal is to identify the most effective method for accurate classification of malignant and benign tumors, while also addressing practical limitations related to computational cost and parameter optimization. In addition, advanced image denoising techniques have been explored to improve data quality before classification tasks [9].
Given these troubling rates, early and precise identification of breast cancer is important to better patient outcomes. Machine learning techniques such as Support Vector Machine (SVM), K-Nearest Neighbor (KNN), and Random Forest (RF) are now used to categorize breast cancer kinds. Each of these approaches has advantages and disadvantages: SVM performs well on smaller datasets but struggles with larger and more complicated data; KNN is easy and straightforward but computationally expensive on large datasets; Random Forest provides excellent accuracy and flexibility but may have higher computation rates in very large data scenarios.
The primary goal of this study is to compare the performance of SVM, KNN, and Random Forest algorithms using the Breast Cancer Wisconsin dataset, primarily to see which method provides the maximum classification accuracy for malignant and benign tumors. This study aims to identify not just the best-performing algorithm, but also its practical limits. Finally, the authors hope to make a clear suggestion on the most effective way of breast cancer classification to help early detection activities.
Previous studies have tried to improve the performance of this algorithm. Research applying KNN combined with feature selection techniques for land sale price prediction, reported improved accuracy in breast cancer classification, achieving up to 80% accuracy [16]. The use of backward elimination in SVM classification resulted in significant performance improvement, with the incorporation of the naive bayes method making the performance of SVM good [17]. Remaining challenges, such as sensitivity to noisy data in KNN, complexity of parameter tuning in SVM, and computational burden in RF, highlight research gaps that require further exploration. This approach aligns with other findings emphasizing the importance of feature reduction techniques such as backward elimination in SVM optimization [21].
This research proposes a comparative evaluation of SVM, KNN, and Random Forest algorithms for breast cancer classification using the Breast Cancer Wisconsin dataset. Feature selection techniques and hyperparameter optimization are incorporated to improve model performance. By systematically comparing these methods, this study aims to identify the most effective algorithm to support early and accurate diagnosis of breast cancer.
2. Literature Review
Numerous machine learning algorithms have been investigated for breast cancer classification, with Support Vector Machine (SVM), K-Nearest Neighbor (KNN), and Random Forest (RF) being some of the most widely explored techniques. Research has consistently shown that SVM often outperforms traditional models, such as logistic regression, in terms of accuracy when classifying breast cancer malignancy levels, especially in binary classification tasks [22]. SVM is particularly effective in these contexts, although its performance tends to decrease as the complexity of the dataset increases, which can limit its applicability to larger or more intricate datasets [23]. Other studies have highlighted SVM's ability to deliver precise diagnostic results, particularly when applied to mammography images, underlining its significance in the early stages of cancer detection [24]. Other comparative studies also explored SVM against decision tree methods to evaluate effectiveness in classification tasks [14].
KNN has shown promising results for classifying breast cancer, although its effectiveness can be hindered by noise and variations in data scaling [25]. Research also demonstrates that integrating feature selection techniques significantly improves KNN accuracy by eliminating irrelevant or redundant features, thereby enhancing its classification power. KNN computational demands increase substantially when working with larger datasets, making it less efficient for realtime applications [20].
RF, recognized for its robustness and high classification accuracy, has also gained considerable attention in breast cancer research. Several studies indicate that combining Random Forest with feature selection not only boosts its performance but also allows it to manage complex datasets more effectively than other traditional models [7]. Its ability to handle high-dimensional and noisy data makes it particularly useful in scenarios where large amounts of data must be processed, and it has demonstrated significant flexibility in various environments, such as web-based applications for predicting cancer recurrence [10].
While SVM, KNN, and Random Forest have each shown promise in breast cancer classification, much of the previous research has evaluated these algorithms in isolation, without making direct comparisons under consistent testing conditions. This study seeks to address this gap by systematically comparing the performance of SVM, KNN, and Random Forest algorithms using the Breast Cancer Wisconsin dataset. The goal is to identify the most accurate and effective classification method, taking into accounts both diagnostic performance and computational efficiency.
3. Material and Method
The data used in this study is sourced from the UCI Machine Learning Repository, a well-established online platform designed to support machine learning research. The repository offers an extensive database containing domainspecific theory and data generators, which are valuable for conducting various machine learning analyses [22]. The dataset utilized in this study, known as the Breast Cancer Wisconsin (Diagnostic) dataset, is based on digital images of breast masses obtained through Fine Needle Aspiration (FNA). The images focus on the cell nuclei, which are described by several key attributes in the dataset.
This dataset includes two main variables: the ID number and the diagnosis (where 'M' represents Malignant and 'B' stands for Benign) [17]. Additionally, the dataset contains ten real-valued features that describe various characteristics of the breast masses. For instance, "texture" refers to the standard deviation of greyscale values in the image, while "radius" measures the average distance from the center to the surrounding boundary points [5]. The "perimeter" refers to the length around the boundary of the mass, and "smoothness" is calculated as the average local variation in the radius length. "Compactness" is determined by dividing the perimeter by the area and subtracting 1.0, while "concave points" measure the number of inward curvature segments along the boundary. Other features such as "concavity" represent the sharpness of the contour's concave sections, and "fractal dimension" describes the self-similarity of the mass's structure [18].
-
3.1 Method
The first step in the process is Data Input, where raw data is collected for processing. After that, the Problem Identification stage focuses on distinguishing between Benign and Malignant cases. The Problem Statement of this study was to determine which classification-Benign or Malignant-was more prevalent, using three different methods. During the Data Cleaning stage, the data set was refined to remove unnecessary or irrelevant data, ensuring that only the most useful information was used. The next stage categorizes the data into two classes: Benign and Malignant, which are the target labels used for analysis. Finally, the Results stage presents the results obtained from the processes performed in the previous stages.
In this study, the Breast Cancer Wisconsin dataset, sourced from the UCI Machine Learning Repository, was used. The dataset is divided into X (features) and Y (labels) variables, where X consists of numerical features, and Y represents labels, with two categories: Malignant (M) and Benign (B). The dataset is then divided into training and testing sets, to facilitate model training and evaluation. Figure 1 represents the steps of this research.
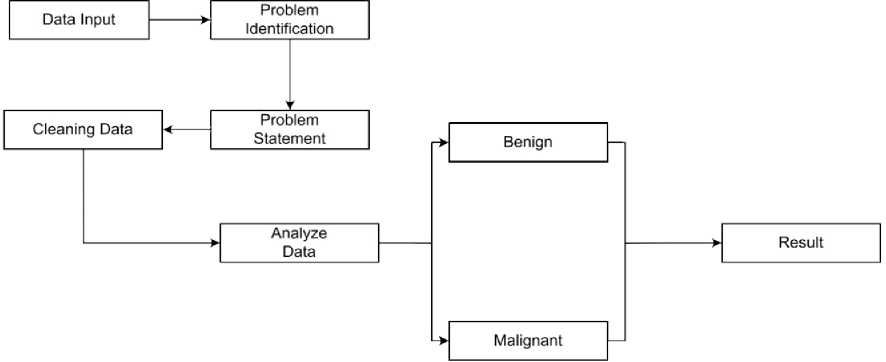
Fig. 1. Flowchart Proposed Research
Explanation of the Figure1, input data, The first step in the process is to collect the raw data to be processed. At this stage, the dataset used is the Breast Cancer Wisconsin dataset which contains data about breast tumors (Benign or Malignant). Step two, Once the data is collected, the next stage is problem identification, where the focus is on distinguishing between Benign (B) and Malignant (M). This is the main problem that this study aims to solve. Step three, at this stage, the problem statement is stated. In this case, the problem to be solved is to determine which classification method is more accurate in separating Benign and Malignant based on the existing dataset, using three different methods. Step Four, Data cleaning is done at this stage. Not all data in the dataset will be used in the analysis. This cleaning aims to remove irrelevant data or repair corrupted data, so that only quality data is used in the model. The fifth step, at this stage, after separating the data, the next step is to analyze the data using different algorithms (SVM, KNN, and Random Forest) the flow of data analysis that shows the steps at this stage is shown in Figure 2, where data analysis uses 3 methods, which can be a benchmark, which method is the best of the three, so that in the future it can be used by other studies or can be developed in combination with other methods.
To ensure the reliability and accuracy of the comparison results, this study employed several best practices in experimental design and model evaluation. First, the dataset was preprocessed through careful data cleaning to eliminate noise and irrelevant attributes, thereby minimizing bias in the input data [17, 20]. The dataset was then split into training and testing sets to prevent overfitting and to allow objective performance evaluation of each algorithm [7, 22]. Accuracy, as the primary evaluation metric, was consistently applied across all models to enable a fair comparison. Additionally, each algorithm was implemented using standardized parameters and evaluated on the same data partitions, ensuring that differences in performance reflect the algorithm’s capabilities rather than inconsistencies in experimental conditions [1, 3]. The use of a well-established dataset such as the Breast Cancer Wisconsin (Diagnostic) dataset also contributes to the credibility of the results, as it has been widely adopted in similar machine learning research [8, 10]. These steps collectively enhance the trustworthiness and reproducibility of the study findings.
Support Vector Machine
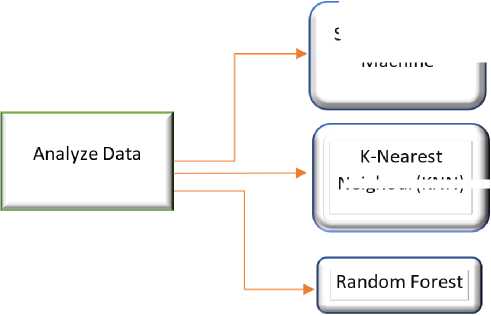
Neighour KNN)
Fig. 2. Analyze Data Flow
The cleaned and classified data will be analyzed to determine patterns and relationships between features in the dataset and tumor diagnosis. The next step is to separate the data into two main categories: Benign and Malignant. These labels will be used in the classification process to determine the type of tumor. In the last stage, the results of the analysis and classification will be extracted and presented. The last step showing the accuracy and performance of the three tested algorithms will be compared. These results will provide insight into the most effective method for breast cancer classification.
The materials and methods proposed in this study are carefully designed to support the primary objective: identifying the most effective supervised learning algorithm for breast cancer classification. By utilizing the Breast Cancer Wisconsin (Diagnostic) dataset-sourced from a reputable machine learning repository [22]-this study ensures data consistency, reliability, and relevance to the medical diagnostic domain. Preprocessing steps, including data cleaning and normalization, help to reduce noise and improve the quality of the input data, which is crucial for achieving high classification accuracy [17, 20].
The division of data into training and testing sets enables objective evaluation of model performance [7]. The implementation of three different algorithms-SVM, KNN, and Random Forest-in the same controlled environment ensures a fair comparative analysis [3, 8]. The performance of each algorithm was then assessed using a standard metric (accuracy), which aligned directly with the research objective of determining the most suitable algorithm for classifying malignant and benign tumors. This structured approach, supported by visualization and evaluation techniques, provides a comprehensive framework that facilitates accurate, reproducible and meaningful results, thus directly contributing to the achievement of the research objectives [1, 10].
-
3.1.1 Support Vector Machine (SVM)
In this study using Support Vector Machines (SVM) which is an algorithm applied to structural risk minimization machine learning and statistical learning theory for tasks such as pattern recognition and regression [16]. In the study, SVM works by identifying the optimal hyperplane that minimizes the difference between positive and negative breast cancer samples in a pre-selected data set of corrupted data. The margin, which measures the distance between the hyperplane and the closest sample of each class, plays an important role in this process [15].
M - 1
x y ( x , w ) = ∑ ω j φ j ( x ) = wT φ ( x ) .
J = 0
Equation (1) represents a linear model where the output y(x, w) is expressed as a weighted sum of basis functions φ j ( x ). , ω j are the weights assigned to each basis function ϕ_j(x), where j ranges from 0 to M-1, and M represents the total number of parameters in the model. The term ϕ(x) is a vector that contains the basis functions φ j ( x ) evaluated at the input x. The vector w represents the weights associated with these basis functions, and the notation wT φ ( x ) indicates the dot product between the weight vector and the basis function vector, producing the model’s output. This formulation is commonly used in various machine learning models, including Support Vector Machines (SVM), where the goal is to find the optimal weights w that minimize classification error or maximize margin. Support Vector Machine (SVM) uses a linear model as a decision boundary, the formula used is shown in equation (2).
y ( x ) = wT ф ( x ) + b
Equation 2 is represents the core of the Support Vector Machine (SVM) approach, where x is the input vector, w denotes the weight parameters, and ф ( x ) is the basis function that maps the input data into a higher-dimensional space. This formulation allows SVM to separate the data points into two classes,with Benign and breast cancer Malignant, by finding the optimal hyperplane that maximizes the margin between them. The results obtained in this study using the SVM approach show an accuracy of 87.44% for training data and 90.06% for testing data. The training dataset consisted of 249 Benign samples and 149 Malignant samples, while the testing dataset included 108 Benign and 63 Malignant samples, demonstrating the model's robustness in classifying breast cancer data.
-
3.1.2 K-Nearest Neighbour (KNN)
At this stage describes the research conducted, namely using K-Nearest Neighbors (KNN) which is a classification algorithm by categorizing objects based on the number of their nearest neighbors [11]. The data is grouped into different categories, with each group reflecting the characteristics of the corresponding input data, namely malignant and benign breast cancer. The key parameter in KNN used, denoted as k, determines how many neighboring points indicate that it is characteristic of malignant breast cancer or benign breast cancer. If k = 1, the KNN method will assign the query point to the same class as its nearest neighbor i.e. malignant or benign breast cancer [16]. Although setting k = 1 can improve classification accuracy, factors such as variations in image pixel size, additional noise, and camera resolution can still affect model performance [12].
KNN breast cancer classification, works by calculating the distance between a query point (which represents a cancer sample) and other data points in the dataset. The algorithm then assigns the query point to a class (Benign or Malignant) based on the majority of its nearest neighbors. This distance calculation is crucial for determining the decision boundaries that separate different types of cancer[19]. By evaluating the closeness between samples, KNN can effectively partition the data into Malignant and Benign categories based on their similarity[20]. The Euclidean distance metric is commonly used to calculate the adjacency distance, as shown in equation (3), and plays an important role in accurately classifying tumors.
euc -|( a 1 — b 1 )+- + ( a n - b n ) ]
The Euclidean distance formula, as shown in equation 3, calculates the straight-line distance between two points in a multi-dimensional space. This formula is used to measure the distance between two data points, denoted as (a1, a2, ..., an) and (b1, b2, ..., bn), where each corresponding coordinate pair (ai, bi) represents a dimension in the space. where 'euc' represents the Euclidean distance, 'ai' and 'bi' are the coordinates of the data points in each dimension, and 'n' is the number of dimensions. This metric is commonly used in machine learning algorithms, such as K-Nearest Neighbors (KNN), to calculate the similarity or dissimilarity between data points. The smaller the Euclidean distance, the more similar the data points are. In the context of this study, it is used to measure the distance between tumor data points in the classification of benign and malignant cases[20]. To calculate case similarity, the formula in equation 4 is used [23].
n У " f ( pi , qi ) Xwi
Similarity ( p , q ) = -=-1------------, (4)
wi
The formula for Similarity(p, q) calculates the similarity between two data points, denoted as p and q, based on their features. In this equation, the sum runs over all features of the data points, from t = 1 to n, where n is the total number of features. The function f(pi, qi) measures the relationship or similarity between the i feature of p and q. The term wi represents the weight assigned to each feature, which is used to give more importance to certain features in the calculation. The overall similarity is then computed by summing these weighted relationships and normalizing them by the weight wi. This approach is commonly used in various machine learning models, where determining the similarity between data points is crucial for classification tasks such as distinguishing between benign and malignant tumors [20].
-
3.1.3 Random Forest (RF)
Random Forest (RF) is a powerful machine learning technique that aggregates the outputs of numerous decision trees to provide a single, more reliable conclusion. As its name suggests, the method relies on constructing a "forest" of trees, which are generated using a technique called bootstrapping, or bagging. Each tree in the forest makes an individual classification prediction, and the prediction with the most votes becomes the final decision. RF is especially useful for classifying large datasets and can handle a variety of data sizes and types with consistent accuracy. The process involves combining individual decision trees, where each tree is trained on a randomly selected subset of the data. RF algorithm has the advantage of flexibility, often yielding strong results even without extensive parameter tuning.
In this study, RF trees were built by considering a random subset of features at each node split, instead of selecting the most significant feature. This reduces overfitting and improves model performance by increasing variability and providing a wider decision path. The RF algorithm is based on the principles of ensemble learning, which combines multiple classifiers to tackle complex problems and improve overall model performance. The process takes place in two main stages, first, multiple decision trees are built from random samples from the dataset, second, each tree makes a prediction, and the final classification is determined based on the majority vote (for classification tasks).
While Random Forest has many advantages, including its ability to handle non-linear data and its robustness against overfitting, it also presents some challenges. These include a tendency to be biased when working with categorical variables, and it may suffer from slower computation times when processing large datasets. Additionally, Random Forest may not be well-suited for problems involving linear data with sparse features. Despite these limitations, it is a widely used and reliable technique, particularly in the diagnosis of breast cancer, where its classification capabilities help differentiate between benign and malignant.
In breast cancer classification research, the Random Forest (RF) algorithm has been successfully applied to predict tumor malignancy, leading to notable improvements in classification accuracy [1]. Its ensemble-based structure enhances predictive capability by aggregating multiple decision trees, enabling effective differentiation between malignant and non-malignant cases. This method not only improves overall diagnostic performance but also serves as a reliable tool for early cancer detection [3,10]. The underlying mechanism of probability estimation in Random Forest is mathematically formulated in equation (5), which illustrates how the final class probability is derived by averaging the predictions from each individual tree in the ensemble.
P ( c I , x ) = 1 ∑ T t = 1 Pt ( c I , x ) (5)
Where P ( c I , x ) is the final probability of class c for a given input x and context I calculated as the average of predictions p t from each tree t in the ensemble of size t this averaging process enhances model robustness by reducing the effect of overfitting from individual trees. Random Forest is calculated by aggregating the predictions from all individual trees. This ensemble-based strategy enhances model robustness and reduces the risk of overfitting by smoothing out the variability of individual classifiers. It forms the foundation for making probabilistic predictions in Random Forest models, especially in high-stakes applications such as medical diagnostics. To construct each decision tree that contributes to this ensemble prediction, the training data must be recursively partitioned. This partitioning is formally described in Equation (6).
Q ( φ ) = {( I , x )| f φ ( I , x ) < }
Q ( φ ) = Q \ Q ( φ )
The process of dividing the dataset based on the decision rule φ is formally described in equation (6).Specifically, the subset
Q
( φ ) represents all input pairs ( I , x ) for which the splitting function f φ ( I , x ) satisfies a given condition,
while the complementary subset Q ( φ ) contains the remaining data, defined as the difference between the full set Q and
Q 1 ( φ )
.This partitioning is fundamental in constructing decision trees within the Random Forest model, as it determines how the dataset is recursively split to form optimal branches. Counting (φ) provides the largest information gain where the Shannon entropy H(Q) is computed on the normalized graph of the label fraction lI(x) for all (I,x) ∈ Q, with equation 7.
φ * = argmaxG ( φ )
| Q ( φ
G ( φ ) = H ( Q ) - ∑ S ∈ {1, r } | Q s | H ( Q S ( φ ))
Equation 7 represents the optimization process of an objective function G(φ), which aims to find the optimal partition φ* that maximizes the value of the function. The function G(φ) itself is defined as the difference between the overall entropy H(Q) of the data set Q, and the weighted sum of the entropies of the data sections QS(ϕ) resulting from the partition ϕ, where the index S represents a particular subset (e.g., positive and negative classes). The sum weight is based on the proportion of the subset size (Q (φ) to the total data Q , thus giving the relative contribution of each part to the overall entropy. This formulation is widely used in the context of attribute selection in decision trees or information modeling, where the main objective is to minimize the uncertainty (entropy) of the data distribution after it has been divided based on a criterion φ .
4. Result
Based at the effects of breast cancer classification from the comparison of the 3 methods used (SVM, KNN and Random Forest) results in conclusions from table 1 where the table contains Benign, Malignant and accuracy data from each method used.
Table 1. Result of Several Method
|
Metode |
Benign |
Malignant |
Accuracy Score |
|
SVM |
108 |
63 |
90.06% |
|
KNN |
75 |
39 |
90.00% |
|
Random Forest |
67 |
47 |
94.07% |
In table 1 is a table of the results obtained, that the accuracy value of the Random Forest algorithm is higher, this proves that the Random Forest algorithm has the best method among the other two methods, including the KNN and SVM algorithms, on the same dataset used.
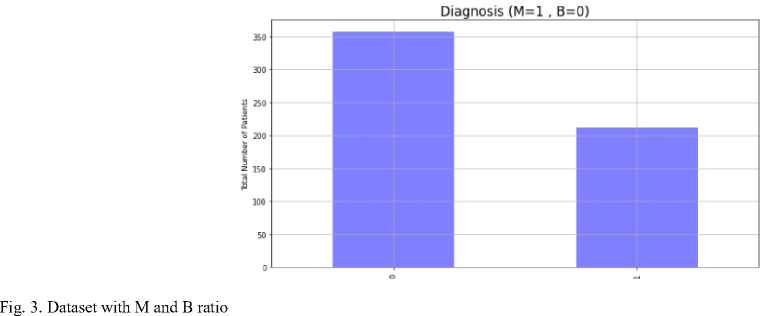
Figure 3 contains the number of Malignant datasets labeled 1 and Benign datasets labeled 0. It can be seen that there are more malignant data.
The distribution of benign and malignant cases in the Breast Cancer Wisconsin database is then shown in Figure 4.
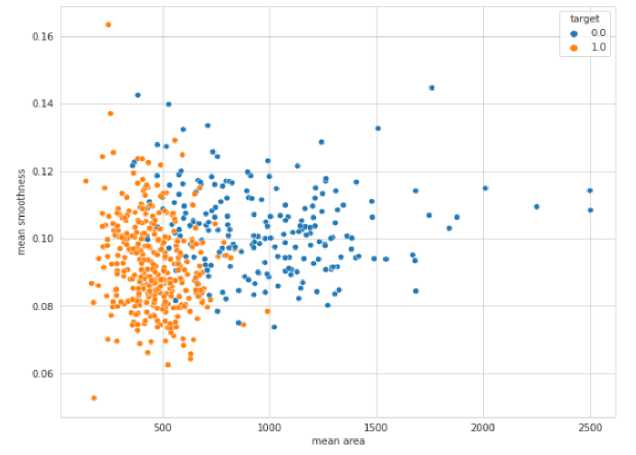
Fig. 4. Malignant and Benign Dispersion
The results show that of the three prediction methods that produce higher accuracy in breast cancer classification is RF. Proper selection of algorithms plays an important role in improving prediction performance. Future research is encouraged to explore alternative algorithms and use different datasets to identify the most effective model for similar research problems. The method applied in this study has shown superior performance compared to other algorithms tested on the Wisconsin Breast Cancer Database, indicating its potential as a viable alternative. Further research is recommended to refine the current algorithm and investigate other techniques that can produce better results.
4.1 Discussion
5. Conclusion and Future Research Directions
The results obtained in this study indicate that the Random Forest algorithm performs better than both SVM and KNN in classifying breast cancer data using the Wisconsin dataset. The superior accuracy of Random Forest at 94.07% supports previous research that emphasizes its ability to handle high-dimensional and noisy data effectively [3, 7, 8]. Meanwhile, the marginally lower performance of SVM and KNN suggests that while they are still viable options, they may be more sensitive to parameter selection and data distribution characteristics [20, 25]. These findings highlight the importance of not only choosing the right algorithm but also ensuring that preprocessing and model tuning are properly applied to optimize results.
To provide a deeper understanding of the results, it is essential to examine not only the accuracy scores but also the behavior and characteristics of each algorithm in handling the dataset. Random Forest demonstrated consistent performance across different subsets of the data, suggesting its robustness against overfitting and its ability to generalize well to unseen data. This is particularly advantageous in medical contexts, where false positives or negatives can have serious implications. On the other hand, KNN performance may have been affected by the curse of dimensionality, as the algorithm relies heavily on distance metrics, which become less reliable in high-dimensional spaces [20]. Similarly, SVM showed strong performance but requires careful kernel selection and parameter tuning to maintain its classification accuracy [17]. These observations confirm that algorithm performance is not solely dependent on accuracy, but also on how well the model adapts to the nature of the data. Therefore, the selection of a machine learning model in real-world applications should consider not only the evaluation metrics but also computational efficiency, interpretability, and stability across varying data distributions.
These findings not only support the broader use of ensemble methods in healthcare but also demonstrate how algorithm selection can directly impact diagnostic reliability. By providing an empirical comparison under consistent conditions, this study offers a reproducible reference point for future academic evaluations, particularly in medical datasets with high dimensionality and class imbalance. Additionally, novel models that integrate dynamic learning and multiscale texture analysis have been proposed to enhance diagnostic performance in image-based breast cancer detection [13].
This study presents a comparative evaluation of three supervised machine learning algorithms—Support Vector Machine (SVM), K-Nearest Neighbor (KNN), and Random Forest (RF)—for the classification of breast cancer using the Breast Cancer Wisconsin (Diagnostic) dataset. The proposed method, which involved consistent preprocessing, standardized evaluation metrics, and equal testing conditions, offers a reliable foundation for algorithm comparison. The findings confirm that Random Forest demonstrates superior performance, offering both high accuracy and robustness, making it a strong candidate for implementation in diagnostic decision-support systems.
From a scientific perspective, this work contributes to the ongoing efforts in medical informatics by providing empirical evidence that supports the use of ensemble learning models, particularly Random Forest, in handling complex, high-dimensional healthcare data. The clear methodological framework applied here can also serve as a reference model for future evaluations in similar domains.
In terms of practical application, the findings may assist developers and clinicians in choosing more effective machine learning tools to enhance early detection of breast cancer. Future research could explore the integration of ensemble learning methods with advanced feature selection techniques or hybrid models that combine interpretability and scalability. Moreover, the application of models such as XGBoost or lightweight neural networks may offer added flexibility, as they can perform reliably across both small and large datasets, thus widening the scope of use in diverse healthcare settings.
Academically, this work reinforces the role of algorithm benchmarking in medical data science, while applicatively, it provides decision support for clinicians and software developers in selecting effective, scalable classification tools for early cancer detection. The implementation of the proposed approach can be adapted into screening systems or diagnostic software in hospitals, offering a foundation for future medical AI development.
Acknowledgment
We would like to express our gratitude to the reviewers for their precise and succinct recommendations that improved the presentation of the results obtained.
