
Comparative screening of leguminous tree species for drought tolerance in lateritic soils of Purulia, West Bengal
Journal: Journal of Stress Physiology and Biochemistry @jspb
Article in issue: 2 т.22, 2026.
Free access
In dry areas, plant productivity is limited by the scarcity of water. This research aims to evaluate the suitability of certain legume plants in the dry laterite soil of Purulia and nearby districts in West Bengal, India. Seedlings, 25 days old, Adenanthera pavonina L., Albizia procera (Roxb.), Pongamia pinnata (L.), and Peltophorum pterocarpum (DC.) Backer ex K. Heyne from the Leguminosae (Fabaceae) family were subjected to PEG-induced water stress (-0.5 and -1.0 MPa) to measure their relative water content and the levels of chlorophyll, protein, soluble sugars, and proline in their leaves, as well as the activities of the enzymes catalase, peroxidase, and superoxide dismutase (SOD). In all species, chlorophyll and protein levels in the leaves decreased with higher PEG-induced water stress, while soluble sugar and proline levels increased. The activity of the enzyme catalase, peroxidase, and SOD also decreased with increased water stress, with the smallest decline observed in P. pterocarpum. This suggests that P. pterocarpum is potentially the most water stress-tolerant among the studied plants.
Short address: https://sciup.org/143186140
IDS: 143186140
Text of the scientific article Comparative screening of leguminous tree species for drought tolerance in lateritic soils of Purulia, West Bengal
Agroforestry is gaining importance due to its significant potential to tackle various challenges, including the demand for fuel, fodder, timber, and shade protection. Successful agroforestry practices require comprehensive research that is adapted to the specific climate and soil conditions of a particular area. Recently, there has been an increasing demand of fuelwood species as alternatives to non-renewable energy sources.
Water availability in terrestrial environments is a critical factor for plant productivity. In arid regions, limited water resources restrict plant productivity. Plants under water stress exhibit changes in their morphology, anatomy, physiology, and biochemistry, which can affect their potential yield. The characteristics of stress-induced changes in a plant largely depend on the degree of stress applied, which typically begins with stress signalling, leading to changes in membrane components or gene activity (Bray, 1993).
Plants exhibit a rapid molecular response to environmental changes. The physical and biochemical responses of plants to environmental stress, particularly their adaptation to water scarcity, have been extensively studied (Bhattacharjee and Mukherjee, 2002; Kar, 2011). Polyethylene glycol is preferred over other osmotic substances because it does not penetrate the apoplastic space. PEG with various molecular weights is often used because stress accumulates more quickly with PEG than in soil systems (Verslues et al. , 2006).
A reduction in protein and leaf chlorophyll due to water stress is common. Osmotic stress from polyethylene glycol reduced chlorophyll levels in Thymus vulgaris (Razavizadeh et al. , 2019). A common outcome of water stress is low protein levels, caused by either reduced protein synthesis or increased protein hydrolysis. In radish seedlings under water stress, a significant reduction in soluble proteins was observed (Mahesh et al. , 2013). Accumulation of proline and soluble carbohydrates was noted in cotton exposed to drought conditions. Water scarcity increased sugar accumulation in Brassica napus (Ali et al. , 2014).
Under stress, plant leaves produce reactive species such as active oxygen species, which include superoxide radicals, hydrogen peroxide (H2O2), hydroxyl radicals (OH), and singlet oxygen, due to biochemical and physiological processes within the cell. The presence of abiotic stress can further increase the levels of these active oxygen species. Developing drought stress tolerance can be achieved by modulating the activities of enzymes involved in peroxide metabolism. The activities of catalase, superoxide dismutase (SOD), and peroxidase enzymes have been observed in various plants like sorghum, sunflower, and wheat under water stress conditions (Zhang & Kirkham, 1994; Kosar et al., 2020).
In the context of current global climate change, water scarcity is expected to become more frequent in the near future (Farooq et al. , 2014). The early seedling development stage is particularly vulnerable to water stress. Therefore, selecting drought-resistant genotypes early in the growing season is crucial and effective (Xie et al. , 2013).
MATERIALS AND METHODS
In the present investigation, four tree species namely Adenanthera pavonina L., Albizia procera (Roxb.), Pongamia pinnata (L.) and Peltophorum pterocarpum DC.) Backer ex K.Heyne of the family Leguminosae (Fabaceae) were used. Seedlings (25 days old) were taken as experimental plant materials to assess responses to water stress.
These plants were used as experimental materials to assess their responses to water stress. Seedlings were grown from vigorous seeds that were surface sterilized with sodium hypochlorite, initially placed on moist filter paper in petri dishes, and then transferred to acid-washed sand beds. The germinating seeds were incubated in a growth chamber set at a temperature of 25 ± 2°C with a daily cycle of 8 hours of light and 16 hours of darkness. Vigorous seedlings were subjected to osmotic stress induced by polyethylene glycol (PEG-6000), a commonly used osmotic agent. Two levels of water stress (-0.5 and -1.0 MPa) were created using PEG solution concentrations of 19.6% and 29.6%, respectively, based on the work of Michel and Kaufmann (1973). The PEG solution was applied to the seedlings of the studied species by immersing their roots in the solutions. A control group was maintained using distilled water. Incubation lasted for 24 hours under 8-hour light and 16-hour dark cycles at a temperature of 25 ± 2°C. At the end of the experimental period, leaves were collected from the respective plants. The leaf samples were then analyzed for biochemical parameters, including chlorophyll content, protein, carbohydrates, proline, and the activities of enzymes such as catalase (EC.1.11.1.6), peroxidase (EC.1.11.1.7), and superoxide dismutase (EC 1. 15.1.1).
Relative water content (RWC): The relative water content of the leaves from seedlings of the investigated plant species was estimated using the formula of Weatherly (1962). Leaves from both stressed and control seedlings were washed with distilled water, the surface solution was blotted, and the fresh weight was recorded. The isolated leaves were then immersed in distilled water for 4 hours, blotted again to remove the surface solution, and the turgid weight was measured. For dry weight determination, the plant materials were oven-dried at 80 °C for three days.
Relative water content was calculated according to the following formula-
RWC = (Fresh weight-Dry weight) / (Turgid weight-Dry weight) X 100.
Chlorophyll: Leaf samples weighing 50 mg from the seedlings were first placed in 5 ml of methanol and kept in the refrigerator overnight. Subsequently, they were blended with the same methanol and spun at 5000 rpm for 10 minutes. The liquid supernatants were decanted, and the remaining pellets were rinsed twice with a small amount of cold methanol. All supernatants were then combined and adjusted to a total volume of 10 ml. The overall chlorophyll content was measured using the supernatants according to Arnon's method (1949). Chlorophyll absorbance was recorded at 650 nm using a UV-VIS spectrophotometer (LABINDIA), and the amount was calculated using Arnon's formula. The chlorophyll content was expressed as mg per g of dry weight.
Soluble carbohydrates: The carbohydrate content of the leaf sample was determined using the method of McCready et al. (1950). To measure carbohydrate content, a 50 mg leaf sample from each set was crushed in 5 ml of hot 80% ethanol and then centrifuged at 5000 rpm for 10 minutes. The supernatant containing ethanol-soluble carbohydrates was then evaporated to dryness. Chlorophyll was removed by rinsing with solvent ether. The soluble carbohydrates were then eluted again with hot 80% ethanol. To 1 ml of this extract, 3 ml of 0.2% anthrone reagent was added under cold conditions, and the grass-green colour was stabilized by heating the tubes in a boiling water bath for 7 minutes. The absorbance was measured at 610 nm using a UV-VIS spectrophotometer (LABINDIA) and compared with a standard curve prepared from glucose. Carbohydrate content was expressed as mg glucose equivalents per g of dry weight.
Proline: The proline concentration in leaf tissue was evaluated using the procedure outlined by Bates et al. (1973). To begin, 200 mg of plant material was ground in 5 ml of 3% aqueous sulfosalicylic acid, and the homogenate was then centrifuged at 5000 rpm for 10 minutes. Two ml of the supernatant obtained was mixed with 2 ml of acid ninhydrin reagent and incubated at 100°C for one hour. The reaction was stoped by placing it in an ice bath. The mixture was then extracted with 4 ml of toluene in a separating funnel through vigorous shaking. The toluene layer was separated from the lower aqueous phase, and its absorbance was measured at 420 nm. The proline content was quantified by comparing the absorbance to a standard curve made from L-proline and expressed as
µmol g-1 dry weight.
Enzyme activities: To determine the activities of catalase and peroxidase, the enzymes were extracted by homogenizing leaf tissue in cold 0.1 M phosphate buffer (pH 7.0) containing 1% PVPP, followed by centrifugation at 10,000 rpm at 4°C. The supernatant served as the enzyme source, and the catalase activity assay was conducted according to the method described by Biswas and Choudhury (1984). Peroxidase activity was determined by monitoring the rate of pyrogallol oxidation. The activity of the enzyme SOD was assessed by measuring its ability to inhibit the photochemical reduction of NBT, following the method of Giannopolitis and Ries (1977) with modifications by Roy Chowdhury and Choudhuri (1985). The 3 ml reaction mixture contained 0.05 M Na 2 CO 3 , 0.1 mM EDTA, 63 μM NBT, 13 μM methionine, 20 μl enzyme extract, and 1.3 μM riboflavin, with riboflavin added last. Five ml of distilled water was added to the reaction mixture and shaken. The assay mixture was then incubated under light at 20 μmol m2s1 for 30 minutes. After incubation, absorbance was immediately measured at 560 nm using a UV-VIS spectrophotometer. The non-irradiated sample served as a control and was subtracted from A560.
Expression of enzyme activity: For each enzyme assay, a zero-time control was used as a blank, and enzyme activity was calculated using the formula [(ΔA × TV) / (T×V×wt)], where ΔA was the absorbance of the sample after incubation minus the absorbance of the zerotime control (for catalase activity, the absorbance of the zero-time control minus the absorbance of the sample after incubation), TV represents the total volume of the filtrate, t is the incubation time, and V is the total volume of the filtrate used for incubation (Fick & Qualset, 1975). Enzyme activity was expressed as unit min1 g1 dry weight (for catalase and peroxidase) or unit h1g1 dry weight (for SOD).
RESULTS
Relative water content: Plants have developed various strategies to manage the negative impacts of water stress. Table 1 demonstrated the impact of shortterm (24 h) water stress (0, -0.5, and -1.0 MPa) induced by PEG-6000 on the relative water content (RWC) of the leaves of seedlings from different species. Generally, water stress significantly decreased RWC in all species compared to the control, with the effect becoming more pronounced at higher levels of water stress. The reduction of RWC from respective control values (Figure 1.) was less in A. pavonina and P. pterocarpum under both water stress levels, indicating their ability to maintain tissue hydration and osmotic adjustment. In contrast, other species, particularly A. procera, exhibited the greatest decline at the -1.0 MPa level of water stress, suggesting a higher susceptibility to water scarcity.
Chlorophyll : The data in Table 2 show that chlorophyll content in the leaves of all species significantly decreased as PEG-induced water stress increased. Among the unstressed leaves (Control), P. pterocarpum had the highest chlorophyll level that is 5.42 mg g-1 DW, while A. pavonina had the lowest being 3.89 mg g-1 DW (Figure 2.). In A. pavonina seedlings, the reduction in chlorophyll content compared to the control was least at the -1.0 MPa level, while other species, particularly A. procera , showed the greatest decline at this level of water stress.
Total protein : The total protein content in the leaves at the seedling stage was lower in stressed leaves compared to controls across all species (Table 3). The highest protein content in control leaves was found in P. pinnata (253.2 mg g-1 DW), while A. pavonina had the lowest being153.2 mg g-1 DW (Figure 3). When considering the percentage decrease from the control, the decline in protein content in A. pavonina and P. pterocarpum was relatively less at both levels of water stress. In contrast, P. pinnata , where the protein level was quite high under control conditions (253.20 mg g-1 DW), percentage of decline was maximum at both -0.5 MPa and -1.0 MPa stress level followed by A. procera . Under severe stress (-1.0 MPa), all species showed a considerable reduction, likely resulting from protein denaturation or reduced synthesis due to limited resource supply.
Soluble sugar: Table 4 illustrates the varying concentrations of soluble sugar in seedlings of selected plants subjected to water stress. In untreated leaves, sugar content ranged from 80.21 mg g-1 DW in A. pavonina to 38.2 mg g-1 DW in P. pinnata (Figure 4). In all instances, leaves under water stress exhibited higher soluble sugar levels than their control counterparts. This accumulation is a common adaptive mechanism under osmotic stress, functioning as a solute to sustain osmotic equilibrium. The percentage increase compared to controls was most pronounced in P. pterocarpum followed by A. pavonina. Soluble sugar accumulation was least in P. pinnata under severe stress (-1.0 MPa) level. Elevated carbohydrate levels likely enhance drought resistance.
Proline : Table 5 presents the changes in proline content in the leaves of the studied plant species under water stress. Under moderate water stress conditions (-0.5 MPa), the proline content increased significantly in A. pavonina and P. pterocarpum , as depicted in Figure 5. Under severe stress (-1.0Mpa), proline content increased markedly across all species, with the highest accumulation recorded in A. pavonina followed by P. pterocarpum. Although P. pinnata have highest proline under control condition, a comparatively lower increase observed in P. pinnata and A. procera, suggests a limited capacity for osmotic adjustment.
Catalase enzyme activity : Table 6 shows the catalase activity in the seedling leaves of rapidly growing tree legumes exposed to two levels of water stress. Activity was least affected by water stress in A. pavonina and P. pterocarpum at both the levels of water stress. Among other species, A. procera showed lowest catalase activity under water stress .
Peroxidase activity : Peroxidase activity in the stressed seedlings of fast-growing species was lower compared to the unstressed controls (Table 7). Peroxidase activities of the control seedlings varied (Figure 7) and it was highest in A. procera (33.20-unit min-1g-1 DW) and lowest in case of P. pterocarpum (20.54 unit min-1g-1 DW). It was found that the stress-induced lowering of the activity in relation to control was less in A. pavonina and P. pterocarpum compared to other species at both level of water stress. Among other species, A. procera showed lowest peroxidase activity followed by P. pinnata , upon imposition of higher water stress (-1Mpa).
SOD enzyme activity : Table 8 recorded the activity of enzyme superoxide dismutase (SOD) of the selected plant species subjected to water stress. SOD activity showed little variation among species ranging from 101 to 104-unit h-1g-1 DW (Figure 8). However, the rate of decline in the activity due to water stress varied among species as shown in the Figure 8. The extent of decrease in activity (over control) of such enzyme was clearly less in A. pavonina in comparison to other species. P. pterocarpum closely followed A. pavonina . In case of A. procera and P. pinnata , the rate of decline is greater, rendering them less tolerant to drought.
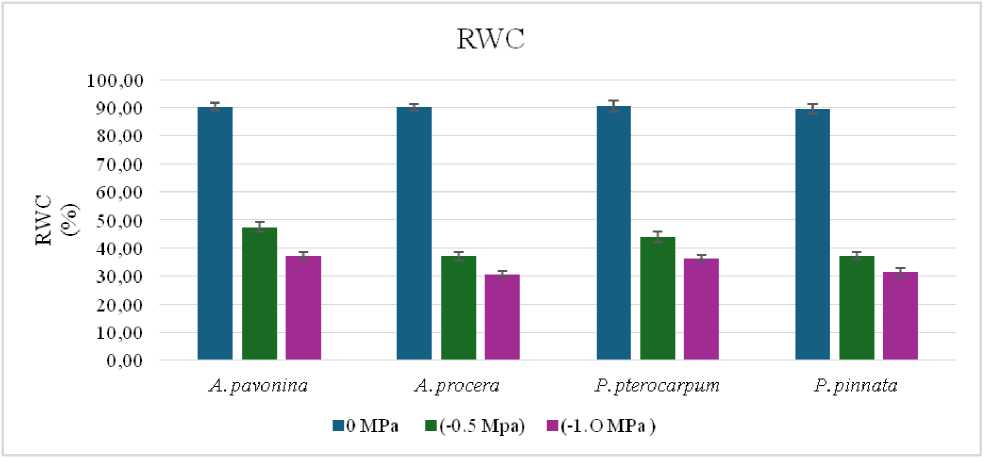
Figure 1: Effect of different levels (0, -0.5 and -1.0 MPa) of PEG induced water stress on relative water contents in the leaves of investigated plant species.
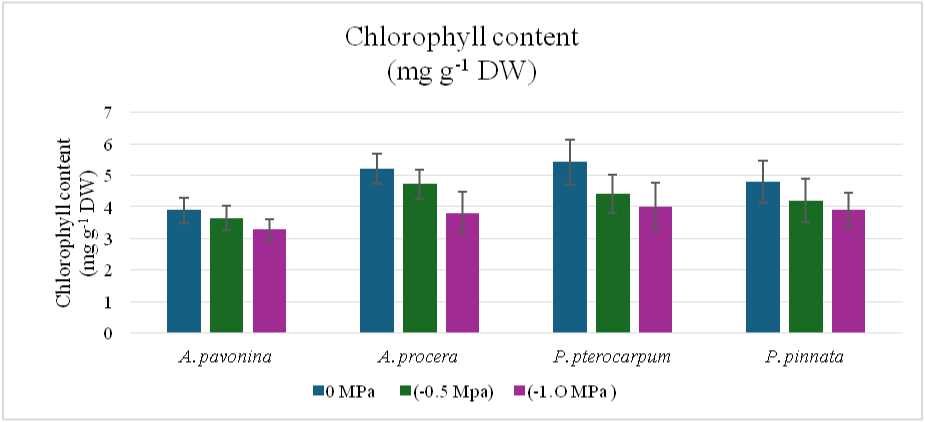
Figure 2: Effect of different levels (0, -0.5 and -1.0 MPa) of PEG induced water stress on chlorophyll contents in the leaves of investigated plant species.
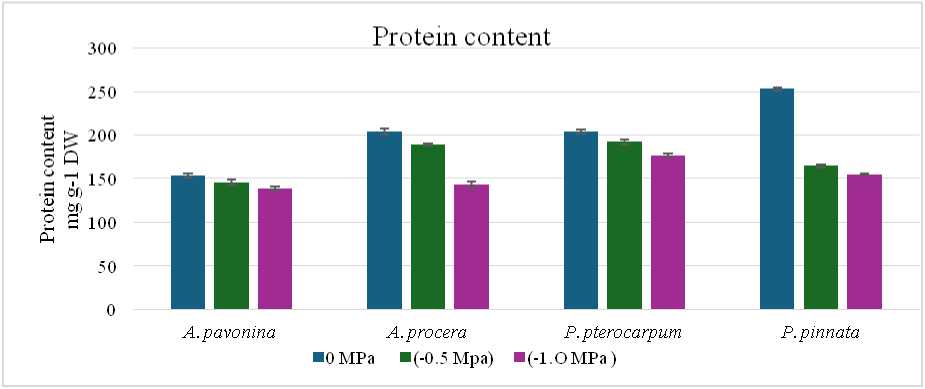
Figure 3: Effect of different levels (0, -0.5 and -1.0 MPa) of PEG induced water stress on protein contents in the leaves of investigated plant species.
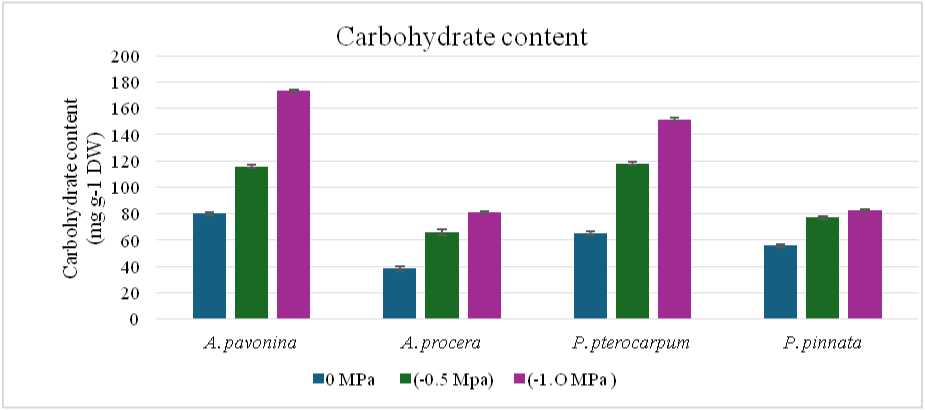
Figure 4: Effect of different levels (0, -0.5 and -1.0 MPa) of PEG induced water stress on soluble sugar contents in the leaves of investigated plant species.
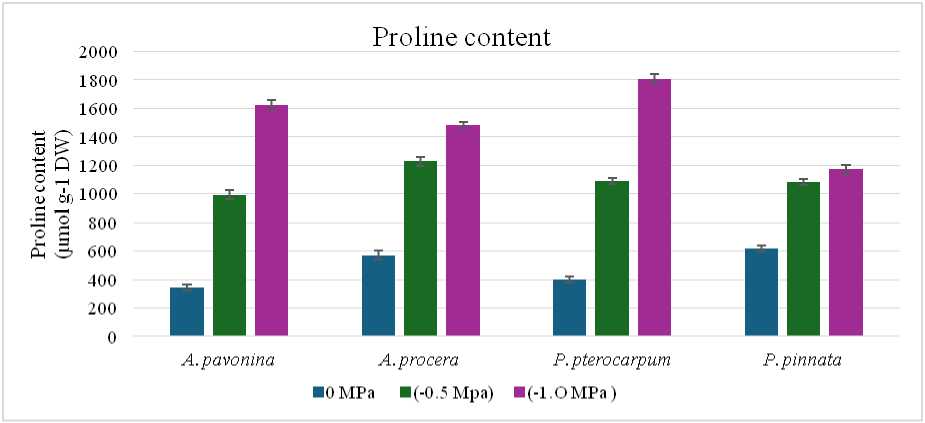
Figure 5: Effect of different levels (0, -0.5 and -1.0 MPa) of PEG induced water stress on proline contents in the leaves of investigated plant species.
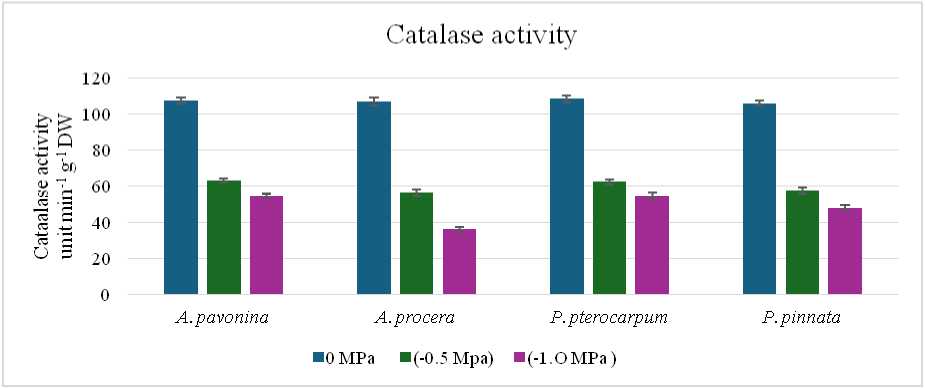
Figure 6: Effect of different levels (0, - 0.5 and -1.0 MPa) of PEG induced water stress in the activities of Catalase in the leaves of investigated plant species.
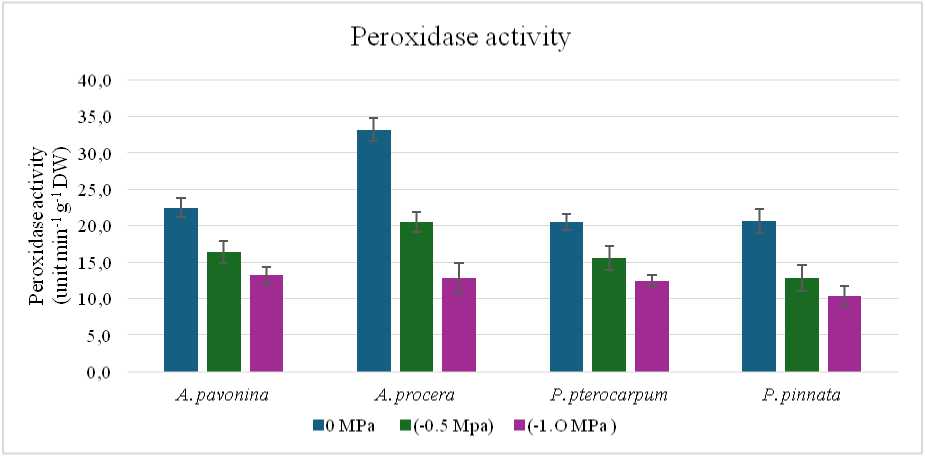
Figure 7: Effect of different levels (0, - 0.5 and -1.0 MPa) of PEG induced water stress in the activities of peroxidase in the leaves of investigated plant species.
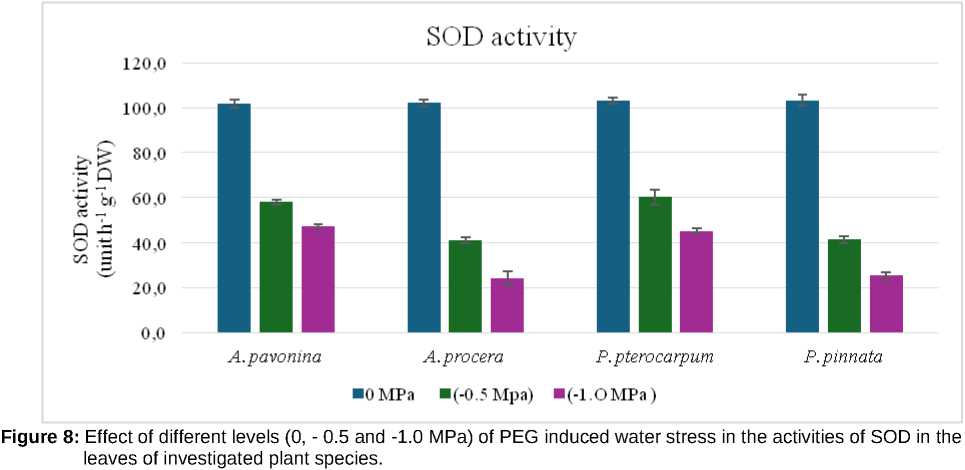
Table 1: Relative water contents (%) in the leaves of seedlings exposed to different levels (0, -0.5 and -1.0 MPa) of
PEG-induced water stress.
|
Water stress |
Adenanthera pavonina |
Albizia procera |
Peltophorum pterocarpum |
Pongamia pinnata |
|
0 Mpa |
90.24 ±0.92 |
90.18 ±1.1 |
90.54 ±0.91 |
89.46 ±1.6 |
|
-0.5 Mpa |
47.35 ±0.80 |
37.12 ±0.74 |
43.85 ±0.99 |
37.18±0.93 |
|
-1.0 Mpa |
37.20 ±1.3 |
30.65 ±1.2 |
36.37 ±1.14 |
31.31±0.74 |
Table 2: Chlorophyll contents (mg g-1 DW) in the leaves of seedlings exposed to different levels (0, -0.5 and -1.0 MPa) of PEG-induced water stress.
|
Water stress |
Adenanthera pavonina |
Albizia procera |
Peltophorum pterocarpum |
Pongamia pinnata |
|
0 Mpa |
3.89±0.41 |
5.20±0.48 |
5.42±0.72 |
4.80±0.66 |
|
-0.5 Mpa |
3.64±0.38 |
4.72±0.46 |
4.40±0.61 |
4.20±0.67 |
|
-1.0 Mpa |
3.28±0.35 |
3.80±0.67 |
4.0±0.75 |
3.90±0.53 |
|
Table 3: Protein contents (mg g-1 DW) in the leaves of seedlings exposed to different levels (0, PEG-induced water stress. |
-0.5 and -1.0 MPa) of |
|||
|
Water stress |
Adenanthera pavonina |
Albizia procera |
Peltophorum pterocarpum |
Pongamia pinnata |
|
0 Mpa |
153.2±1.41 |
203.7±1.24 |
204.2±1.02 |
253.2±1.61 |
|
-0.5 Mpa |
145.3±1.64 |
189±1.33 |
192.2±1.15 |
164.6±1.58 |
|
-1.0 Mpa |
138.7±2.18 |
143.2±1.55 |
175.8±1 |
154.5±1.20 |
Table 4: Soluble carbohydrate contents (mg g-1 DW) in the leaves of seedlings exposed to different levels (0, -0.5 and -1.0 MPa) of PEG-induced water stress.
|
Water stress |
Adenanthera pavonina |
Albizia procera |
Peltophorum pterocarpum |
Pongamia pinnata |
|
0 Mpa |
80.2±1.37 |
38.2±1.67 |
65.3 ±1.54 |
55.8± 1.19 |
|
-0.5 Mpa |
115.9±1.19 |
65.8±2.15 |
118.1±1 |
77.2 ±1.1 |
|
-1.0 Mpa |
173.2±1.13 |
81.2±1.02 |
151.4 ±1.14 |
82.6 ±1.08 |
|
Table 5: Proline contents (μmol g-1 DW) in the leaves of seedlings exposed to different levels (0, PEG-induced water stress. |
-0.5 and -1.0 MPa) of |
|||
|
Water stress |
Adenanthera pavonina |
Albizia procera |
Peltophorum pterocarpum |
Pongamia pinnata |
|
0 Mpa |
342.2±1.64 |
570.2±1.45 |
402.2±2.09 |
620.1±1.94 |
|
-0.5Mpa |
991.8±1.25 |
1227.1±2.42 |
1090.6±2.12 |
1085.3±1.34 |
|
-1.0Mpa |
1625.6±2.65 |
1480.3±1.35 |
1810.1±2.05 |
1170.4±1.26 |
Table 6: Catalase enzyme activity (unit min-1 g-1 DW) in the leaves of seedlings exposed to different levels (0, -0.5 and
-1.0 MPa) of PEG-induced water stress
|
Water stress |
Adenanthera pavonina |
Albizia procera |
Peltophorum pterocarpum |
Pongamia pinnata |
|
0 Mpa |
107.4 ±1.46 |
106.6±2.19 |
108.3 ±1.9 |
105.9 ±1.3 |
|
-0.5Mpa |
63 ±1.07 |
56.3 ±1.7 |
62.2 ±1.48 |
57.4 ±1.55 |
|
-1.0Mpa |
54.6 ±1.25 |
36 ±1.27 |
54.6 ±1.68 |
48.1 ±1.57 |
Table 7: Peroxidase enzyme activity (unit min-1g-1 DW) in the leaves of seedlings exposed to different levels (0, -0.5 and -1.0 MPa) of PEG-induced water stress.
|
Water stress |
Adenanthera pavonina |
Albizia procera |
Peltophorum pterocarpum |
Pongamia pinnata |
|
0 Mpa |
22.5±1.3 |
33.2±1.6 |
20.54±1.1 |
20.67±1.6 |
|
-0.5Mpa |
16.4±1.6 |
20.6±1.4 |
15.55±1.7 |
12.86±1.8 |
|
-1.0Mpa |
13.2±1.1 |
12.9±2.1 |
12.39± 0.9 |
10.38±1.4 |
|
Table 8: SOD enzyme activity (unit h-1g-1 DW) in the leaves of seedlings exposed to different levels (0, -0.5 and -1.0 MPa) of PEG-induced water stress. |
||||
|
Water stress |
Adenanthera pavonina |
Albizia procera |
Peltophorum pterocarpum |
Pongamia pinnata |
|
0 Mpa |
101.8±1.7 |
102.2±1.6 |
103.2±1.5 |
103.4±2.2 |
|
-0.5Mpa |
58±1 |
41.4±1.3 |
60.4±1.4 |
41.6±1.5 |
|
-1.0Mpa |
47.3±1.2 |
24.4±1 |
45.4±1.2 |
25.4±1.8 |
DISCUSSION
In this study, the relative drought tolerance of four tree species was evaluated. Due to the impracticality of assessing their mature performance under field conditions, the study utilized seedlings to determine their response to water stress induced by PEG-6000 solution in a controlled laboratory environment. Plant responses to abiotic stress involve a complex interplay of physiological and biochemical mechanisms that collectively determine tolerance or susceptibility. The marked reduction in relative water content (RWC) across stress levels indicates that water deficit directly impairs cellular hydration, validating previous findings that RWC is a sensitive indicator of plant water status under drought conditions (Barrs and Weatherley, 1962; Anjum et al., 2011). Among the plants, A. pavonina and P. pterocarpum are able to maintain relatively higher RWC, thereby exhibiting greater drought tolerance. Chlorophyll content also declined significantly under stress, a common phenomenon associated with pigment degradation and impaired photosystem stability (Ashraf and Harris, 2013). In the seedlings of A. pavonina decline in chlorophyll content over control was minimal at -1.0 MPa level. Maintenance of chlorophyll under stress may provide a physiological advantage by sustaining photosynthetic activity and growth.
Stress-induced changes in protein levels often reflect synthesis of stress-responsive proteins, such as dehydrins and heat shock proteins, which enhance cellular stability and defense (Kosová et al. , 2011). Decline in protein content (over control) in A. pavonina and P. pterocarpum was observed to be relatively less at both the levels of water stress.
Carbohydrate metabolism showed strong modulation by stress, with an overall accumulation observed in most species. Such accumulation is often attributed to osmotic adjustment and the provision of energy reserves for survival under adverse conditions (Farooq et al. , 2009). The accumulation of soluble carbohydrates, was greatest in P. pterocarpum .
Proline is widely recognized as a compatible solute that contributes to osmotic balance, stabilization of macromolecules and reactive oxygen species (ROS) detoxification (Szabados & Savouré, 2010). Proline accumulation was most pronounced in A. pavonina followed by P. pterocarpum . Its differential accumulation across species underscores its role as a critical biochemical marker of stress tolerance.
Catalase activity decreased significantly with increasing stress level in all species. Under control condition, highest CAT activity was observed in P. pterocarpum (108.25 U min ⁻ ¹ g ⁻ ¹ DW), followed by A. pavonina (107.39 U min ⁻ ¹ g ⁻ ¹ DW). However, at higher stress level (-1.0 MPa), a decline in activity was noted, indicating oxidative damage due to stress. The reduction in CAT activity under severe water stress has been reported, suggesting prolonged ROS exposure leading to enzyme inactivation (Zhang et al. , 2021).
The peroxidase enzyme exhibited a similar trend of decline as water stress intensified. A. procera showed the highest POD activity under control condition (33.20 U min ⁻ ¹g ⁻ ¹ DW) but unable to maintain higher activity at -1.0 MPa, suggesting weak antioxidant defense. POD enzymes often play important role in scavenging hydrogen peroxide under stress (Pandey et al. , 2017).
SOD, the initial defense against superoxide radicals, also decreased as PEG stress levels inreased. All species showed high SOD activity under control conditions, with P. pinnata being the highest (103.4 U h ⁻ ¹ g ⁻ ¹ DW). However, under high stress (-1MPa), SOD activity reduced significantly in P. pinnata (25.44 U h ⁻ ¹g ⁻ ¹DW). Similar reductions in SOD activity have been noted in various tree species, often linked to excessive ROS accumulation that inhibits enzymes (Zhang et al. , 2021; Duan et al. , 2024). Moderate SOD retention in A. pavonina and P. pterocarpum suggest better oxidative resilience under water scarcity.
CONCLUSION
These findings support the idea that plant stress tolerance results from the combined effect of multiple traits working together (Blum, 2011) and emphasize the importance of trait-based screening for selecting and improving stress-resilient species. Further research integrating molecular and physiological analyses could offer valuable insights into gene regulation related to enzymatic defense under water stress.
CONFLICTS OF INTEREST
All authors declare that they have no conflicts of interest.
