Conceptual analysis of different clustering techniques for static security investigation

Author: Bassam A. Hemade, Hamed A. Ibrahim, Hossam E. A. Talaat
Journal: International Journal of Intelligent Systems and Applications @ijisa
Article in issue: 2 vol.11, 2019.
Free access
Power system contingency studies play a pivotal role in maintaining the security and integrity of modern power system operation. However, the number of possible contingencies is enormous and mostly vague. Therefore, in this paper, two well-known clustering techniques namely K-Means (KM) and Fuzzy C-Means (FCM) are used for contingency screening and ranking. The performance of both algorithms is comparatively investigated using IEEE 118-bus test system. Considering various loading conditions and multiple outages, the IEEE 118-bus contingencies have been generated using fast-decoupled power flow (FDPF). Silhouette analysis and fuzzy partition coefficient techniques have been profitably exploited to offer an insight view of the number of centroids. Moreover, the principal component analysis (PCA) has been used to extract the dominant features and ensure the consistency of passed data with artificial intelligence algorithms’ requirements. Although analysis of comparison results showed excellent compatibility between the two clustering algorithms, the FCM model was found more suitable for power system static security investigation.
Artificial intelligence, cascading outages, contingency screening and ranking, fuzzy c-means, k-means
Short address: https://sciup.org/15016570
IDR: 15016570 | DOI: 10.5815/ijisa.2019.02.04
Text of the scientific article Conceptual analysis of different clustering techniques for static security investigation
Published Online February 2019 in MECS
Cascading outage is one of the most frequently stated problems with power system reliability. Due to the increasing demand on power and new deregulations, the system operator has to operate power system equipment close to their security limit. Consequently, single tripping of a transmission line or generation unit may trigger a sequence of unplanned outages that eventually result in a total blackout [1]. Therefore, the vulnerability of transmission circuits, power transformers, and generation units should be investigated all the time to ensure that their outage will not leave the network in danger[2]. The study of system security under steady-state conditions is known as contingency analysis [3]. Typically, contingency analysis aims to investigate the consequences of a single or multiple equipment outages on the security of the whole electrical network. Such analysis ends up identifying the initial events, cascading chains, and the necessary preventive actions.
According to NERC, a single outage (N-1) should not leave the system under threat [4]. Moreover, many studies have taken this investigation a step further to N-k (where k ≥ 2). These studies can be divided into two main groups based on their methodology, either by using less accurate but very fast algorithm [5-8] or by using performance indices [9, 10]. Considering thousands or even millions of possible contingencies, it is infeasible to perform N-K steady-state contingency analysis of a modern interconnected power system, especially if k > 2, without a compromise. The compromise includes two parts; the first part involves how far the operator needs to investigate the security of the network against the blackout, under specific operating conditions. The second part specifies the time margin to respond. Typically, if the system operator is looking for an online response, the security investigation should not include more than one element (N-1), to gain the necessary speed. On the other hand, if the operator wants to go with the investigation beyond N-1, the time margin to respond will be more significant, and the online response may not be applicable anymore because of the computational burden attached with such studies. Nevertheless, most contingencies have less probability of occurring than others which dramatically reduced the number of cases that need to be investigated. Even though most critical contingencies are rare to occur, their occurrence has a destructive consequence and should be treated with due caution. The contingencies, which have a higher probability of occurrence, have to be identified and ranked based on their severity for more rigorous analysis.
In summary, this paper presents a comparative conceptual analysis of two clustering algorithms for power system contingency investigations. The presented work aims to investigate the behavior of the k-means algorithm compared with the fuzzy c-means algorithm for screening and ranking power system contingencies. The composite insecurity index (CISI) has been adopted to quantify the severity of each contingency, where k-means and fuzzy c-means are used to group contingencies based on the common characteristics they share among others and finally giving each observation a meaningful label based on cluster centers. Therefore, this paper has been organized into four sections. First, section II summarizes the previous work involving power system contingency analysis. Then, section III reviews the concept of CISI for power system monitoring and contingency analysis. Third, section IV covers the k-means, Fuzzy c-means clustering algorithm; in addition to featuring extraction techniques using principal component analysis (PCA). Fourth, section V involves the numerical verification of both algorithms using the IEEE 118-bus test system. Finally, the conclusions summarized in section VI.
-
II. Related Work
Bearing in mind the complicity of modern interconnected power systems, the unplanned outage of any single element in the power system network today may have an adverse impact on the other elements and the security of the entire power network. The degree of severity varies according to the criticality of the tripped element in the network. Under those circumstances, the network has to run through a set of pre-specified contingencies that are designed to measure how badly each element affects the security of the power network. The number of these contingencies depends on the size of the network and the contingency level that is going to be studied. By neglecting the contingency order, however, the number of expected cases (C) for N-k contingency can be determined as follows [11]:
C^N+ N (N - П | ^^ — D(V — 2) |
= 2 ^
where C is the total number of contingencies and N is the number of elements. However, the first term in (1) represents the number of N-1 contingency which is equal to the number of power system network elements. The second term in (in) represents the N-2 contingency and so on. Even for a small network, the number of contingencies would be enormous and ambiguous in some cases [12], which increase the demands for a classification technique.
Considering the overwhelmed number of cases resulted from performing N-k analysis, the contingency screening has been formulated as an optimization problem in [11, 13, 14] to identify catastrophic events based on a genetic algorithm. In [13] the contingency selection issue has been modeled as a combinatorial optimization problem and solved by genetic algorithms. The advantage of the proposed method was the fact that there is no need for off-line calculations required. The study has failed to consider a higher level of contingencies and appropriate treatment of contingencies. Nevertheless, the higher level of contingencies effect has been considered in [14]. In
-
[14] a genetic algorithm is proposed to solve a general bilevel-programming-based model for N-k power system security assessment. The modeling framework provided by the proposed approach allows considering the nonlinearities and nonconvexities associated with the operation of power systems under contingency. However, considering a large system, the proposed approach was found computationally expensive.
Alternatively, in [15, 16] neural networks have been used for contingency screening and ranking. However, using supervised techniques requires that data passed to them to be labeled. Therefore, the screening and ranking were based on performance indices that have already been presented in [17]. In [9] the Monte Carlo method has been exploited to evaluate the performance of the proposed indices under different loading conditions. The proposed technique, which can be considered an extension of deterministic methods, offers not only an opportunity to identify critical nodes but also critical facilities that possibly require more attention from planners in the future.
On the other hand, the vulnerability of network has been addressed and assessed in [2, 18-24]. The vulnerability studies aim to identify critical components and recognize severe scenarios. Therefore, many indices have been proposed in [2, 18-24] to conduct the vulnerability of the network. A comparison of four methods for power system contingency screening and ranking has been presented in [25]. All compared methods were defined regarding the voltage profile at each bus. In [26] a performance index based on voltage-reactive power has also been introduced. The simulation of contingencies has covered N-2 contingency using fast decoupled power flow. Contingencies have been classified and divided into three groups (non-critical, critical, and most-critical) based on the magnitude of the proposed index. Even though the study has introduced a promising idea, by considering the interconnected power network, the voltage index cannot only be used to reflect the actual state of contingencies. However, in [27] the same classification has been done using three different indices. The simulation covers the outage of multiple lines up to N-2, but they do not include the effects of generation unit tripping.
Generally, the process of contingencies ranking differs based on the adopted methodology, in [28-33] rigid boundaries have been used to identify the worst scenarios. These boundaries are established based on a wellunderstanding of network characteristics. On the other hand, in [34-38] different artificial intelligence methods have been adopted. The use of artificial techniques reduces the required effort to understand the characteristics of the electrical network and offers an excellent opportunity to generalize the well-trained model to serve other purposes. The adopted artificial techniques were found efficient in identifying the most catastrophic contingencies. Most classifiers used in [16, 28, 30, 38-40] relied on labeled data, where each observation has already been studied and analyzed before. The role of the artificial model, in such a situation, is finding a suitable class for each unseen observation in the future. Such a technique will save a lot of time and resources. But not all problems in the real world come with labels, especially power system issues. Accordingly, unsupervised clustering algorithms are found more convenient for power system studies [34, 35, 37, 41-43]. Clustering algorithms offer an opportunity to split the unlabeled data into subsets based on the characteristics the samples share among others. The performance of clustering algorithms depends mainly on the similarity measure that clustering algorithms adopted in the first place. In other words, the similarity measure is what characterizes many clustering algorithms. As a result, the static security of modern power system has been comparatively investigated using two well-known clustering algorithms, namely K-means and Fuzzy c-means.
-
III. Composite Insecurity Index
As previously stated, the contingency analysis objective can be summarized in identifying and ranking the most deleterious scenarios for further rigorous analysis [28, 44-47]. Various indices could use to reflect the impact of contingencies on the security of the power system. The performance index proposed in [3] can be considered the first attempt to quantify the severity of contingencies. Then many attempts followed [3] have been reported in [29, 36, 45, 48-50]. The simplicity of the mathematical structure is what characterizes the performance index in [3]. However, it found suffering terribly from the masking effect problem [29, 30], which makes performance index results questionable. In contrast, robust indices have been presented in [51, 52]. Compared with the performance index in [3], the performance of the composite insecurity index (CISI) in [51, 52] was found superb and comprehensive. CISI defined in terms of the thermal limit of transmission lines, voltage profile at each bus, active and reactive power of the generation unit. Comprehensive behavior makes CISI an excellent choice for power system contingency screening and ranking and can be mathematically summarized as follows:
=∑
1=1
( )× ( )
( )
( )× ( )
( )
, ( )× ( )
( )
, ( )× ( )
+∑
7=1 L
+∑
Z=1 L
+∑
Z=1
( )
where CISI is the composite insecurity index, ISILines(i) is the thermal index of transmission line (i), P(i) thermal limit of line (i), ISIVoltage(j) is the Voltage index of bus (j), VSch(j) is the scheduled voltage at bus(j), ISIA, Power(l) is the active power index of generator (l), Pg(l) is an active power limit of generator (l) in megawatt, ISIR, Power(l) is the reactive power index of generator (l), and Qg(l) is the reactive power of generator (l) in megaVAR.
-
IV. Artificial Intelligence Techniques to Power System Contingency Analysis
-
A. K-Means Algorithm
K-Means (KM) is a straightforward unsupervised clustering technique that basically aims to split the unlabeled dataset into different subsets. Because of its simplicity, KM is a fast clustering algorithm, and it always converges. Accordingly, there are different advanced artificial intelligence techniques such as learning vector quantization and Gaussian mixture that use the structure of the KM algorithm as the basis of their sophisticated structure. However, the initial placement of centroids has a significant impact on the clustering results of KM which requires more attention to avoid having clusters with only one observation assigned to them, or, in the worst scenarios, no observations assigned to them at all.
Consequently, the K-means algorithm is suitable when a rough estimation of clusters number has existed. Even though the number of subsets or subset centers represents a challenge to data analysts, different machine learning methods can offer a good indication about the number of clusters, when the number of clusters is not apparent. In this work, for instance, the Silhouette analysis has been adapted to offer an insight view about a plausible number of clusters.
On an iterative basis, the distortion measure of KM tries to minimize the covariance matrix by continuously updating the cluster centers and observations assigned to each cluster. The objective function of such an optimization problem can be expressed mathematically as follows [53, 54].
J=argmin
∑ ∑‖ - ‖
∈
where x (x 1 , x2,..., x n ) is the dataset, C i is the partitioned sets, µi is the mean of points, and k is the number of clusters where the target is to find the µi value that minimizes J .
Typically, the output of the KM algorithm usually used in two different ways; the first benefits involved splitting the dataset into k groups, which is an obvious use case. The second uses concerned with giving each observation a meaningful label based on the resulting centroids. As a result, after assigning the number of centroids, the clustering process based on KM algorithm can be divided into three main steps. First, initial placement of centroids and there are plenty of techniques that can be used [35, 55]. Observations assignments will follow the initial placements stage to each cluster center. Based on the initial assignment of observations, the second step includes statistical calculations to determine the new placement of cluster centroids. Finally, the KM algorithm will keep updating the results until the termination condition materialized.
-
B. Fuzzy C-Means Algorithm
Unlike KM algorithm that use rigid decision boundaries to distinguish clusters, Fuzzy C-Means (FCM) allows each observation to have a degree of membership in each cluster. Problems with hard-clustering techniques can just be summarized in samples located near boundary decisions, or in the worst scenarios, samples that are located on the boundary itself. These samples, which are located on a semi-equal distance from all cluster centers, represent a challenge in the decision-making process. On the other hand, FCM is an unsupervised technique that combines the benefits of hard-clustering algorithms, such as hard c-means, and fuzzy terminology [56, 57].
Considering pattern recognition problem, FCM aims to minimize the objective function [58], and can be mathematically formulated as follows:
∑
∑ Uy ‖ CISl[ - Sj ‖ ,1≤m≤∞ i=l^^j=l where ^tj is the membership degree (fuzzy partition matrix) of CISIt in the set j, CISIt is the ith of composite insecurity index in feature space, Sj is the vector of dataset centroid, and ‖-‖Д express the relationship between any sample in feature space and center of the set. Since the FCM is basically an iterative optimization technique, the membership ^tj and set centers Sj will be updated continuously by using (5) and (6) until the tolerance to imprecision in (7) materialized.
Ul1 = ∑ ; ( ‖ c^ - ‖
-
∑ (‖ CISI{ - sk ‖)(5)
wℎ=
∑^=1 Ujj × Cisif(6)
^j = ∑ Nijm
∑ max(| ^4 - ^ij |) ≤ e(7)
where £ is the termination condition and has a small value between 0 and 0.1, and k is the number of iterations. The target of this iterative process, like KM algorithm, is to keep searching for the optimal location of cluster centers and the degree of membership of each sample until the termination condition in (7) verified [59]. Therefore, for high confirming efficiency and receiving excellent support regarding the decision-making process, FCM has been broadly adopted in real-world application [56, 57] that requires a decent amount of reliability.
Additionally, considering labeled data, it is easy enough to identify the number of clusters. However, for unlabeled data, there is no exact number of clusters that could be assumed live in the dataset, this problem is known as the cluster validity problem. In such a situation, it is necessary to adopt a method or technique that can identify the most plausible number of clusters.
For the KM algorithm, the Silhouette average coefficient has been adopted to offer an overview of the probable number of clusters that data at hand might have. It may be considered a measure of how each observation in one cluster close to other samples assigned to other clusters. Silhouette’s average coefficient has values ranging from -1 (a sample incorrectly assigned to the wrong cluster) to 1 (a sample is assigned to a specific cluster that is far away from the other clusters). On the other hand, a value of 0 shows that the sample could be located on the boundary decision between different sets. These results can visually be interestingly concluded as will be discussed later.
Alternatively, the FCM algorithm has used the Fuzzy Coefficient Partition (FCP), as part of its structure, to determine the probable number of clusters. Similar to Silhouette analysis, FCP is a measure to what extent the number of clusters fits the dataset. The values of FCP are ranging from 0 (completely fuzzy) to 1(hard-clustering), and can be mathematically interpreted as follows:
( и ∗ UT ) т (8) FPC ( U )= ()
where U is the membership degree, n is the number of observations, and the operator ‘*’ stands for the standard matrix multiplication. Nevertheless, it is important to stress that Silhouette analysis and FPC belong to the category of metric classification, which shows that both algorithms lack the connection to the geometrical structure of data [60]. Therefore, even though both adopted algorithms eliminate some of the ambiguity attached with unlabeled data clustering problem, a reasonable and logical judgment, unfortunately, is also required.
-
C. Feature Extraction
For bulk power system the N-k contingency analysis (where k ≥ 2, 3, 4) would result in an enormous number of cases. Most of these cases are redundant and not offer new information about the current system state. Also, considering all possible contingencies will require large storage and more powerful processor. On the other hand, undoubtedly, the redundant contingencies will not only require more sophisticated infrastructure but also will adversely affect the overall performance of the adopted artificial tool. Most artificial intelligence tools require the data passed to them be distinct, and independent, which is not the case with data at hand. Therefore, the need for feature extraction and dimensionality reduction technique has arisen. In [6, 61, 62] different techniques have been used to eliminate the redundancy problem attached with contingency analysis. Forward sequential method, Entropy maximization, fisher discrimination and principal component analysis (PCA) are some of these techniques.
In this work, the PCA algorithm has been used to ensure that the data passed to the adopted clustering algorithms are consistent with requirements. PCA is an unsupervised dimensionality reduction algorithm that has been extensively used in different applications recently. The PCA algorithm has five steps; these steps can be concluded as shown below:
Step 1: Calculate the center of the dataset with N dimension using the arithmetic mean.
Step 2: Find the direction that has the most variance and obtain the N × N covariance matrix.
Step 3: Pick up the principal component vector that has the highest eigenvalue of the dataset.
Step 4: Pick up the next highest principal component vector which either orthogonal or linearly independent of all previously computed vectors.
Step 5: Rid of the least variance features and save the new N × M list.
It is important to stress that PCA as an unsupervised algorithm could change the number of features or even the value of the feature itself. However, PCA does not alter the number of samples. Therefore, the number of rows (samples (N)) will hold constant where the number of columns (features (M)) will be changed according to the resulted covariance matrix.
So far, this section has focused on the two different clustering algorithms for power system contingency and feature extraction technique using PCA; the following section will discuss the results of the numerical investigation.
-
V. Simulation Results
To emphasize the significant differences between the two proposed clustering algorithms, the IEEE 118-bus test system (having 54 generators, 186 transmission lines, the total generated active power = 5509.82 MW, and the total generated reactive power = 1649.81 MVAR) is
chosen. A computer with processor Intel Core i7- 7th gen, 2.9 GHz, and RAM of 8 GB have been used to simulate different contingencies of the IEEE 118-bus test system. Moreover, all essential analysis including contingencies replications, artificial techniques implementation, and data visualization is carried out using Python language. The simulated contingencies covered multiple outages of various transmission lines and generation units, under different loading conditions. The total number of simulated cases using fast decoupled power flow (FDPF) was 3,756,456-case. Also, for labeled data, there are plenty of measures that characterize the performance of classification algorithms. However, considering unlabeled data, there is no measure of how clustering algorithms well perform against the unlabeled new dataset. Therefore, in this work, KM and FCM algorithms performance are compared based on computation time, resources usage, and efficiency.
Because of its sensitivity to sample scaling, PCA has been applied over dataset for two main reasons, as previously described, first, to reduce the dimensions of a dataset, and second, to ensure that the converted dataset is consistent with clustering algorithms’ requirements. The results of the PCA are depicted in Fig. 1. The reported results in Fig. 1 is merely a transformation from insecurity indices domain, which is shown in Fig. 2, into feature domain as shown in Fig. 1.
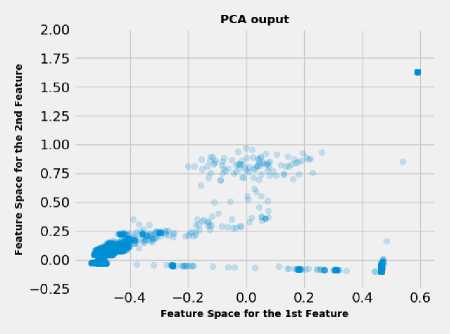
Fig.1. The PCA output of IEEE 118-bus test system
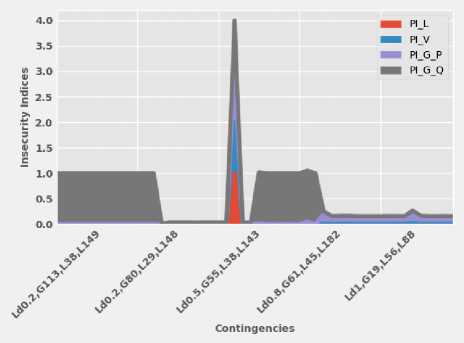
Fig.2. A sample of insecurity indices representation of IEEE 118-bus test system contingencies
Fig. 2 shows the performance of insecurity indices in tracking most of the network’s contingencies. Besides, the interpretation of the x-axis coding of Fig. 2 is reported in Table 1.
Table 1. The description of the x-axis indexing code for Fig.2.
|
Contingency No. |
Code No. |
Description |
|
852490 |
Ld0.2, G113, L38, L149 |
Loading is 20 % of the base load, Generator on bus 113 and line No. 38 and 149 are tripped |
|
⁝ 590784 |
⁝ Ld0.2, G80, L29, L148 |
⁝ Loading is 20 % of the base load, Generator on bus 80 and line No. 29 and 148 are tripped |
|
⁝ 1,259,359 |
⁝ Ld0.5, G55, L38, |
⁝ Loading is 80 % of the base load, Generator on |
|
L143 |
bus 55 and line No. 38 and 143 are tripped |
|
|
⁝ 2,188,030 |
⁝ Ld0.8, G61, L45, |
⁝ Loading is 80 % of the base load, Generator on |
|
L182 |
bus 61 and line No. 45 and 182 are tripped |
|
|
⁝ |
⁝ |
⁝ Loading is 100 % of the base load, Generator on |
|
2,791,524 |
Ld1, G19, L56, L88 |
bus 19 and line No. 56 and 88 are tripped |
-
A. Case 1(K-Means Clustering Model)
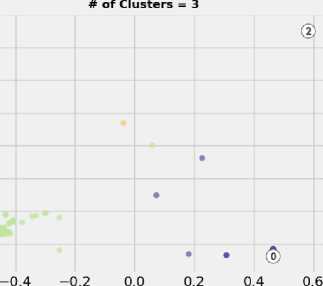
For the power system contingency assessment, the synthesis of the KM model achieved according to specific conditions; The maximum number of iterations is taken as 300, where the tolerance is considered 0.005. Furthermore, the number of clusters have been identified using Silhouette analysis as previously mentioned. Once the number of plausible centroids identified, the KM model was created. The results of the Silhouette analysis have been reported in Fig.3. The three clusters have perfectly fitted the dataset based on Silhouette’s average coefficient. For three clusters, the KM algorithm has run over IEEE 118-bus contingencies, and the results have been reported in Fig. 4. Although the elapsed time (8.1050 seconds) for KM model training was relatively small compared with other sophisticated algorithms, the KM algorithm was found suffering badly from the larger number of observations. Therefore, only 1% (35,154 × 2) of observation considered in the training stage.
-
B. Case 2(FCM Clustering Model)
Unlike the KM algorithm, FCM can easily assimilate a more considerable amount of observation. On the other hand, the same conditions have been followed as in the case of the KM algorithm. The number of clusters has been identified, for the FCM algorithm, using FPC. The results have been reported in Fig. 5. The results, shown in Fig. 5, are in agreement with those obtained by Silhouette analysis, shown in Fig. 3. As Fig. 5 shows, there is no significant difference between the different number of clusters. Slight changes in FPC values can be traced back to the nature of observations and how they are distributed in the feature space. So, it is important to stress that logical and reasonable judgments are also required to determine a plausible number of clusters. Nevertheless, both algorithms show that 3 clusters are very suitable for fitting IEEE 118-bus contingencies. Once the number of centroids identified, the FCM algorithm was applied as shown in Fig. 6. Even though both algorithms have finished the process of data clustering at almost the same time, the FCM algorithm has assimilated more data than the KM algorithm. Besides, the KM algorithm consumes a considerable amount of resources even with a lower number of observations.
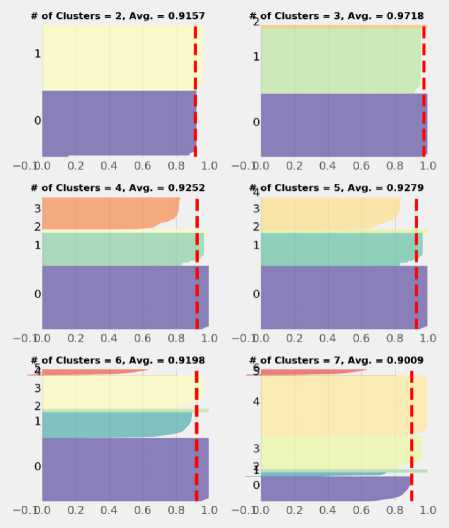
Fig.3. Silhouette analysis results of IEEE 118-bus test system
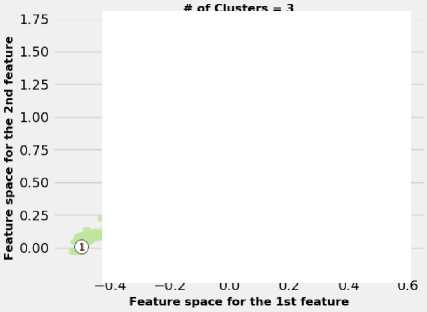
Fig.4. KM results for IEEE 118-bus test system
-
C. Comparison of KM and FCM algorithms
Considering the infeasibility of correctly interpreting the clustering results in the feature domain, the clustering results of both algorithms have been transformed back from feature space, as shown in Fig. 6, to indices domain, as shown in Fig. 7, Fig. 8, and Fig. 9. KM clustering results split the IEEE 118-bus test system’s contingencies into three clusters, as shown in Fig. 7, Fig. 8, and Fig. 9. Closer inspection of contingencies in Fig. 7, Fig. 8, and
Fig. 9 show that the clustering algorithms were working based on two main bases; these bases are the severity of contingencies and the characteristics of these contingencies. In other words, the contingencies have been divided into groups based on two main factors; these factors are the severity of insecurity indices and the characteristics that observations share among others. For instance, the collected observation in Fig. 7 (cluster No. (0)) includes all cases that their occurrence has a minor impact on the security of the IEEE 118-bus system, also, these contingencies, as shown in Fig. 7, are suffering from the same issues. These issues are the lack of reactive power support, and the active power of generation units, which, if not appropriately treated, maybe eventually led to voltage problems. On the other hand, Fig. 8 (Cluster No. (1)) shows all contingencies that their outages may result in cascading blackouts, where all insecurity indices reached the maximum value, which is an equal four, refers to (2). Reached the maximum value means that the power follow does not converge at the end. Stated differently, cases included in Cluster No. (1) Fig. 8 represents the most catastrophic contingencies that could ever hit the network under various loading conditions and multiple equipment outages. Nevertheless, it is important to stress that power flow divergence is not by necessarily mean the system is insecure, but it is a good indication that more investigation is required. Moreover, from the operational perspective, knowing which element or combination of elements that could lead to severe scenarios or even putting the network under stress is good enough to prepare preventative countermeasures to maintain the security and integrity of the network. On the other hand, cluster No. (2), as shown in Fig. 9, contains all contingencies that their outages result in experiencing the shortage of reactive power support. As apparent in Fig. 9, the reactive power index of the generation unit dominates the whole graph.
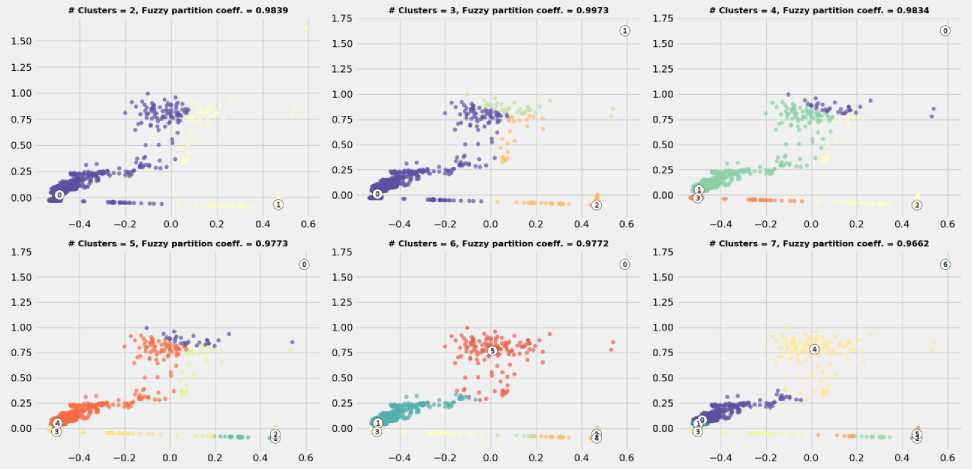
Fig.5. Fuzzy Partition Coefficient (FPC) results for IEEE 118-bus test system contingencies.
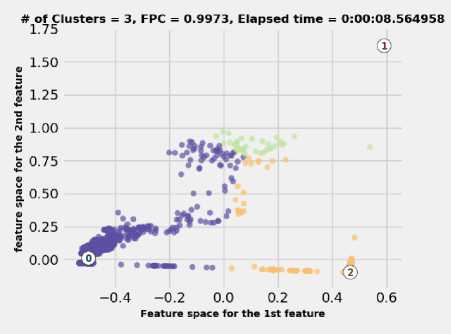
Fig.6. The FCM results for IEEE 118-bus test system
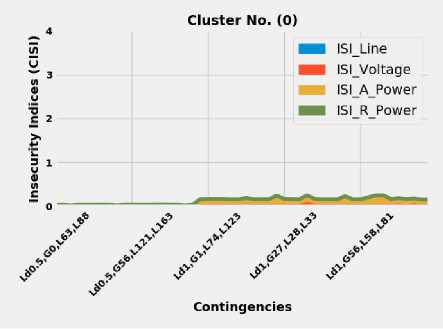
Fig.7. The clustering results of contingencies based on KM and FCM algorithms, Cluster No. (0)
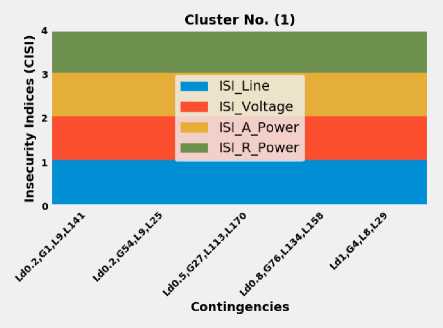
Fig.8. The clustering results of contingencies based on KM and FCM algorithms, Cluster No. (1)
by having less harmful contingencies than other clusters for IEEE 118-bus contingencies, as shown in Fig.7. Consequently, the observations, which have a semi-equal membership of multiple clusters, cannot be assigned to the cluster that has a maximum membership with a small margin; instead, the observation will be assigned to the more severe cluster to maintain the security and integrity of the electrical network.
Table 2. A comparison of the FCM and KM algorithm.
|
Algorithm |
No. of Samples |
Elapsed Time (sec) |
Memory usage (avg.) |
Processor usage (avg.) |
|
KM |
35,154 (1%) |
8.1050 |
96 % |
75 % |
|
FCM |
1,757,700 (50%) |
8.5650 |
80 % |
44 % |
151 Line
151 R Power
ISIVoltage
151 A Power
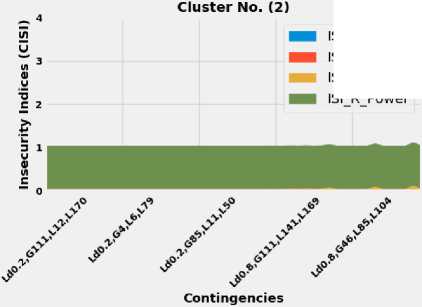
Fig.9. The clustering results of contingencies based on KM and FCM algorithms, Cluster No. (2)
Alternatively, considering the inherent behavior of both algorithms, Table 2 shows a comparison between KM and FCM algorithms. A closer inspection of the table shows the superiority of the FCM model compared with the KM model. The FCM model, as shown in Table 2, has assimilated more observations with less consumption of resources than the KM model. Taking into account decision-making support, Table 3 shows a sample of the most deceptive results of the KM model for the power system’s static security assessment. The KM model, as shown in Table 3, tracks the shortest distance from each sample to the cluster centers regardless to how close the observations are to other cluster centers, which is the typical behavior of any hard-clustering technique. Thus, the observation usually assigned to the closest cluster. Shortest distance can also be defined, using fuzzy terminology, as the maximum degree of membership for specific observations in all clusters. However, defining the state of the system based on the maximum degree in a specific cluster and neglecting other notable memberships in other clusters is somewhat incorrect if the security and integrity of the network have been considered. For instance, the contingency number 5, which includes the tripping of the generator at bus 4 and outages of lines number 8 and 55 at 100 % of the base load, has been grouped with cluster No. (0) with a tiny margin compared to other clusters. Cluster No. (0) has been characterized
Table 3. A sample of the FCM and KM algorithm results for the IEEE 118-bus test system.
|
No. |
Contingency |
FCM |
K-M |
||
|
0 |
1 |
2 |
|||
|
1 |
Ld1, G4, L0, L8 |
0.3312 |
0.3110 |
0.3579 |
2 |
|
2 |
Ld1, G4, L3, L8 |
0.3012 |
0.3808 |
0.3180 |
1 |
|
3 |
Ld1, G4, L6, L8 |
0.3290 |
0.3149 |
0.3560 |
2 |
|
4 |
Ld1, G4, L8, L38 |
0.3724 |
0.3057 |
0.3219 |
0 |
|
5 |
Ld1, G4, L8, L55 |
0.3564 |
0.3260 |
0.3176 |
0 |
|
6 |
Ld1, G4, L8, L64 |
0.3465 |
0.3522 |
0.3012 |
1 |
|
7 |
Ld1, G4, L8, L69 |
0.3848 |
0.3064 |
0.3088 |
0 |
|
8 |
Ld1, G4, L8, L75 |
0.3659 |
0.3120 |
0.3221 |
0 |
|
9 |
Ld1, G4, L8, L76 |
0.3353 |
0.3484 |
0.3163 |
1 |
|
10 |
Ld1, G4, L8, L78 |
0.3633 |
0.3265 |
0.3101 |
0 |
|
11 |
Ld1, G4, L8, L86 |
0.3100 |
0.3085 |
0.3815 |
2 |
|
12 |
Ld1, G4, L8, L94 |
0.3430 |
0.3412 |
0.3158 |
0 |
|
13 |
Ld1, G4, L8, L111 |
0.3627 |
0.3254 |
0.3119 |
0 |
|
14 |
Ld1, G4, L8, L116 |
0.3255 |
0.3204 |
0.3541 |
2 |
|
15 |
Ld1, G4, L8, L117 |
0.3502 |
0.3184 |
0.3314 |
0 |
|
16 |
Ld1, G4, L8, L127 |
0.3102 |
0.3752 |
0.3146 |
1 |
|
17 |
Ld1, G4, L8, L132 |
0.3467 |
0.3193 |
0.3340 |
0 |
|
18 |
Ld1, G4, L8, L144 |
0.3784 |
0.3010 |
0.3206 |
0 |
|
19 |
Ld1, G4, L8, L146 |
0.3754 |
0.3062 |
0.3185 |
0 |
|
20 |
Ld1, G4, L8, L164 |
0.3225 |
0.3106 |
0.3669 |
2 |
|
21 |
Ld1, G4, L8, L170 |
0.3066 |
0.3305 |
0.3629 |
2 |
|
22 |
Ld1, G4, L8, L180 |
0.3486 |
0.3204 |
0.3310 |
0 |
|
23 |
Ld1, G10, L71, L96 |
0.3730 |
0.3151 |
0.3119 |
0 |
|
24 |
Ld1, G12, L1, L8 |
0.3556 |
0.3331 |
0.3113 |
0 |
|
25 |
Ld1, G12, L4, L8 |
0.3275 |
0.3720 |
0.3005 |
1 |
|
26 |
Ld1, G12, L5, L8 |
0.3362 |
0.3498 |
0.3140 |
1 |
|
27 |
Ld1, G89, L108, L126 |
0.3253 |
0.3096 |
0.3651 |
2 |
|
28 |
Ld1, G89, L126, L148 |
0.3051 |
0.3517 |
0.3433 |
1 |
-
VI. Conclusion
This study set out to compare the behavior of two unsupervised clustering techniques for power system static security assessment. These techniques include the KM and Fuzzy C-Means (FCM). Silhouette analysis and Fuzzy Partition Coefficient (FPC) have been used to identify a plausible number of clusters, which is a common issue attached to unsupervised techniques.
Besides, to enhance the overall performance of the adopted unsupervised clustering algorithm, Principal Component Analysis (PCA) has been used to extract the dominant features and reduce the size of the input matrix. Both techniques have been tested by using the IEEE 118-bus test system. The results show that the KM algorithm is susceptible to the observation scale and the number of samples which could have an adverse impact on the clustering performance. In this work, the sensitivity of the algorithm to the number of observations has been alleviated by taking a well-representative sample based on a statistical measure. However, by optimizing the size of observations, the KM algorithm was found robust and always converging. Compared with the KM model, the FCM model is immune to observations size. The elapsed time taken by the FCM algorithm for clustering of 50 % of IEEE 118-bus contingencies was taken by KM algorithm to separate only 1 % of total contingencies.
In a nutshell, KM algorithm is a powerful clustering technique to start exploring data at hand. However, the FCM algorithm is superior and should be considered if decision-making becomes an urgent necessity.
References Conceptual analysis of different clustering techniques for static security investigation
- Z. Guorui, S. Kai, H. Chen, R. Carroll, and L. Yilu, "Application of synchrophasor measurements for improving operator situational awareness," in IEEE Power Energy Soc, Gen. Meeting, 2011, pp. 1-8.
- X. Wei, S. Gao, T. Huang, E. Bompard, R. Pi, and T. Wang, "Complex Network Based Cascading Faults Graph for the Analysis of Transmission Network Vulnerability," IEEE Trans. Power Syst., 2018.
- G. Ejebe and B. Wollenberg, "Automatic contingency selection," IEEE Trans. Power App. Syst., no. 1, pp. 97-109, 1979.
- D. Chatterjee, J. Webb, Q. Gao, M. Y. Vaiman, M. M. Vaiman, and M. Povolotskiy, "N-1-1 AC contingency analysis as a part of NERC compliance studies at midwest ISO," in IEEE PES T&D 2010, pp. 1-7.
- Y. Duan and B. Zhang, "Security risk assessment using fast probabilistic power flow considering static power-frequency characteristics of power systems," Int. J. Electr. Power Energy Syst., vol. 60, pp. 53-58, 2014.
- D. S. Javan, H. Rajabi Mashhadi, S. A. Toussi, and M. Rouhani, "On-line voltage and power flow contingencies ranking using enhanced radial basis function neural network and kernel principal component analysis," Electric Power Components and Systems, vol. 40, no. 5, pp. 534-555, 2012.
- Y. Sun and X. Tang, "Cascading failure analysis of power flow on wind power based on complex network theory," Journal of Modern Power Systems and Clean Energy, vol. 2, no. 4, pp. 411-421, 2014.
- J. Yan, Y. Tang, H. He, and Y. Sun, "Cascading failure analysis with DC power flow model and transient stability analysis," IEEE Trans. Power Syst., vol. 30, no. 1, pp. 285-297, 2015.
- A. M. L. da Silva, J. L. Jardim, L. R. de Lima, and Z. S. Machado, "A method for ranking critical nodes in power networks including load uncertainties," IEEE Trans. Power Syst., vol. 31, no. 2, pp. 1341-1349, 2016.
- S. P. Nangrani and S. S. Bhat, "Power system security assessment using ranking based on combined MW-chaotic performance index," in TENCON 2015 - 2015 IEEE Region 10 Conference, 2015, pp. 1-6.
- P. Paenyoorat, "The application of genetic algorithms to identify the worst credible states in a bulk power system," Ph.D. Ph.D. , University of Missouri/Rolla, 2006.
- Vaiman et al., "Risk Assessment of Cascading Outages: Methodologies and Challenges," IEEE Trans. Power Syst., vol. 27, no. 2, pp. 631-641, 2012.
- J. V. Canto dos Santos, I. F. Costa, and T. Nogueira, "New genetic algorithms for contingencies selection in the static security analysis of electric power systems," Expert Syst. with Applications, vol. 42, no. 6, pp. 2849-2856, 2015.
- J. M. Arroyo and F. J. Fernández, "Application of a genetic algorithm to n-K power system security assessment," Int. J. Electr. Power Energy Syst., vol. 49, pp. 114-121, 2013.
- R. Sunitha, S. K. Kumar, and A. T. Mathew, "Online static security assessment module using artificial neural networks," IEEE Trans. Power Syst., vol. 28, no. 4, pp. 4328-4335, 2013.
- T. S. Sidhu and L. Cui, "Contingency screening for steady-state security analysis by using FFT and artificial neural networks," IEEE Trans. Power Syst., vol. 15, no. 1, pp. 421-426, 2000.
- R. Sunitha, R. K. Sreerama, and A. T. Mathew, "A Composite Security Index for On-line Steady-state Security Evaluation," Electr. Power Compon. Syst., vol. 39, no. 1, pp. 1-14, 2011.
- J. Li and S. Huang, "A vulnerability model for power system dynamic security assessment," Int. J. Elect. Power Energy Syst., vol. 62, pp. 59-65, 2014.
- R. Baldick et al., "Vulnerability assessment for cascading failures in electric power systems," in IEEE/PES Power Syst. Conf. Expo., 2009, pp. 1-9.
- C. Pang and M. Kezunovic, "Static security analysis based on weighted vulnerability index," in IEEE Power Energy Soc, Gen. Meeting, 2011, pp. 1-6.
- S. Hongbiao and M. Kezunovic, "Static Security Analysis based on Vulnerability Index (VI) and Network Contribution Factor (NCF) Method," in IEEE/PES Trans. Distrib. Conf. Expo. Asia and Pacific, 2005, pp. 1-7.
- Y. Xingbin and C. Singh, "A practical approach for integrated power system vulnerability analysis with protection failures," IEEE Trans. Power Syst., vol. 19, no. 4, pp. 1811-1820, 2004.
- A. M. A. Haidar, A. Mohamed, and F. Milano, "A computational intelligence-based suite for vulnerability assessment of electrical power systems," Simulation Modelling Practice and Theory, vol. 18, no. 5, pp. 533-546, 2010.
- N. Bhatt et al., "Assessing vulnerability to cascading outages," in IEEE/PES Power Syst. Conf. Expo., 2009, pp. 1-9.
- G. Ejebe, G. Irisarri, S. Mokhtari, O. Obadina, P. Ristanovic, and J. Tong, "Methods for contingency screening and ranking for voltage stability analysis of power systems," in Power Industry Computer Application Conf., 1995, pp. 249-255: IEEE.
- E. F. D. Cruz, A. N. Mabalot, R. C. Marzo, M. C. Pacis, and J. H. S. Tolentino, "Algorithm development for power system contingency screening and ranking using voltage-reactive power performance index," in IEEE Region 10 Conference (TENCON), 2016, pp. 2232-2235: IEEE.
- S. Grillo, S. Massucco, A. Pitto, and F. Silvestro, "Indices for fast contingency ranking in large electric power systems," in IEEE Mediterranean Electrotechnical Conf. (MELECON), 2010, pp. 660-666: IEEE.
- M. Pandit, L. Srivastava, and J. Sharma, "Cascade fuzzy neural network based voltage contingency screening and ranking," Electr. Power Syst. Research, vol. 67, no. 2, pp. 143-152, 2003.
- C. F. Agreira, C. M. Ferreira, J. D. Pinto, and F. M. Barbosa, "The performance indices to contingencies screening," in Int. Conf. Prob. Methods Applied to Power Systems, PMAPS 2006, pp. 1-8: IEEE.
- M. Pandit, L. Srivastava, and J. Sharma, "Fast voltage contingency selection using fuzzy parallel self-organizing hierarchical neural network," IEEE Trans. Power Syst., vol. 18, no. 2, pp. 657-664, 2003.
- K. Hyungchul and S. Chanan, "Steady state and dynamic security assessment in composite power systems," in Proceedings of the 2003 Int. Symposium on Circuits and Systems, ISCAS '03. , 2003, vol. 3, pp. III-320-III-323 vol.3.
- L. Li and Z.-H. Zhu, "On-line static security assessment of power system based on a new half-Against-half multi-class support vector Machine," in Int. Syst. Applications (ISA), 2011, pp. 1-5: IEEE.
- D. Niebur and A. J. Germond, "Power system static security assessment using the Kohonen neural network classifier," IEEE Trans. Power Syst., vol. 7, no. 2, pp. 865-872, 1992.
- S. Kalyani and K. Swarup, "Supervised fuzzy C-means clustering technique for security assessment and classification in power systems," Int. J. Engineering Science Technol., vol. 2, no. 3, pp. 175-185, 2010.
- S. Kalyani and K. S. Swarup, "Particle swarm optimization based K-means clustering approach for security assessment in power systems," Expert Syst. with Applications, vol. 38, no. 9, pp. 10839-10846, 2011/09/01/ 2011.
- M. A. Matos, N. D. Hatziargriou, and J. A. P. Lopes, "Multicontingency steady state security evaluation using fuzzy clustering techniques," IEEE Trans. Power Syst., vol. 15, no. 1, pp. 177-183, 2000.
- D. Seyed Javan, H. Rajabi Mashhadi, and M. Rouhani, "A fast static security assessment method based on radial basis function neural networks using enhanced clustering," Int. J. Electr. Power Energy Syst., vol. 44, no. 1, pp. 988-996, 2013/01/01/ 2013.
- S. Hassan and P. Rastgoufard, "Detection of power system operation violations via fuzzy set theory," Electr. Power Syst. Research, vol. 38, no. 2, pp. 83-90, 1996.
- T. Jain, L. Srivastava, S. N. Singh, and A. Jain, "Parallel radial basis function neural network based fast voltage estimation for contingency analysis," in 2004 IEEE International Conference on Electric Utility Deregulation, Restructuring and Power Technologies. Proceedings, 2004, vol. 2, pp. 780-784 Vol.2.
- G. Joya, F. García-Lagos, and F. Sandoval, "Contingency evaluation and monitorization using artificial neural networks," Neural Computing and Applications, vol. 19, no. 1, pp. 139-150, 2010/02/01 2010.
- A. Mohamed and G. B. Jasmon, "A New Clustering Technique for Power System Voltage Stability Analysis," Electric Machines & Power Systems, vol. 23, no. 4, pp. 389-403, 1995.
- K. R. Sudha, Y. Butchi Raju, and A. Chandra Sekhar, "Fuzzy C-Means clustering for robust decentralized load frequency control of interconnected power system with Generation Rate Constraint," Int. J. Electr. Power Energy Syst., vol. 37, no. 1, pp. 58-66, 2012.
- O. Ozgonenel, D. Thomas, T. Yalcin, and I. N. Bertizlioglu, "Detection of blackouts by using K-means clustering in a power system," in Developments in Power Systems Protection, 2012. DPSP 2012. 11th International Conference on, 2012, pp. 1-6: IET.
- N. Balu et al., "On-line power system security analysis," in Proceedings of the IEEE, USA, CA, 1992, vol. 80, no. 2, pp. 262-282.
- C. I. F. Agreira, C. M. M. Ferreira, J. A. D. Pinto, and F. P. M. Barbosa, "Contingency screening and ranking algorithm using two different sets of security performance indices," in IEEE Bologna Power Tech Conf. Proceedings, 2003, vol. 4, p. 5 pp. Vol.4.
- H. D. Chiang, J. Tong, and Y. Tada, "On-line transient stability screening of 14,000-bus models using TEPCO-BCU: Evaluations and methods," in IEEE PES Gen. Meeting, 2010, pp. 1-8.
- C. Long, J. Hu, M. Dong, D. You, and G. Wang, "Quick and effective multiple contingency screening algorithm based on long-tailed distribution," IET Gener. Transm. Distrib., vol. 10, no. 1, pp. 257-262, 2016.
- T. Srinivas, K. R. Reddy, and V. Devi, "Composite criteria based network contingency ranking using fuzzy logic approach," in Advance Computing Conference, 2009. IACC 2009. IEEE International, 2009, pp. 654-657: IEEE.
- T. S. Sidhu and L. Cui, "Contingency screening for steady-state security analysis by using FFT and artificial neural networks," IEEE Trans. Power Syst. vol. 15, no. 1, pp. 421-426, 2000.
- J. Hazra and A. K. Sinha, "Identification of Catastrophic Failures in Power System Using Pattern Recognition and Fuzzy Estimation," IEEE Trans. Power Syst., vol. 24, no. 1, pp. 378-387, 2009.
- H. E. A. Talaat, H. A. Ibrahim, and B. A. Hemade, "Synchrophasor measurements-based on-line power system steady-state security indices-- part I: Methodology," in Eighteenth Int. Middle East Power Syst. Conf. (MEPCON), 2016, pp. 699-704.
- H. A. Ibrahim, B. A. Hemade, and H. E. A. Talaat, "Generated Power-Based Composite Security Index for Evaluation of Cascading Outages," presented at the Nineteenth Int. Middle East Power Systems Conf. (MEPCON), Egypt, 19-21 Dec. 2017, 2017.
- M. B. Christopher, Pattern Recognition and Machine Learning. Springer-Verlag New York, 2016.
- S. Shalev-Shwartz and S. Ben-David, Understanding machine learning: From theory to algorithms. Cambridge university press, 2014.
- M. El Agha and W. M. Ashour, "Efficient and fast initialization algorithm for k-means clustering," Int. J. Intelligent Syst. Applications, vol. 4, no. 1, p. 21, 2012.
- T. J. Ross, Fuzzy logic with engineering applications. John Wiley & Sons, 2005.
- J. Harris, Fuzzy logic applications in engineering science. Springer Science & Business Media, 2005.
- S. Ghosh and S. K. Dubey, "Comparative analysis of k-means and fuzzy c-means algorithms," International Journal of Advanced Computer Science and Applications, vol. 4, no. 4, 2013.
- J. C. Bezdek, R. Ehrlich, and W. Full, "FCM: The fuzzy c-means clustering algorithm," Computers & Geosciences, vol. 10, no. 2-3, pp. 191-203, 1984.
- K.-L. Wu and M.-S. Yang, "A cluster validity index for fuzzy clustering," Pattern Recognition Letters, vol. 26, no. 9, pp. 1275-1291, 2005.
- C. A. Jensen, M. A. El-Sharkawi, and R. J. Marks, "Power system security assessment using neural networks: feature selection using Fisher discrimination," IEEE Trans. Power Syst., vol. 16, no. 4, pp. 757-763, 2001.
- S. S. Halilčević, F. Gubina, and A. F. Gubina, "The uniform fuzzy index of power system security," Inter Transactions on Electrical Energy Systems, vol. 20, no. 6, pp. 785-799, 2010.
