Construction complex of the region: current state and innovative potential

Author: Gubanova Elena Sergeyevna, Vorontsova Tatyana Vladimirovna
Journal: Economic and Social Changes: Facts, Trends, Forecast @volnc-esc-en
Section: Branch-wise economy
Article in issue: 5 (23) т.5, 2012.
Free access
Construction industry has traditionally established itself as a leading choice; it is designed to reproduce fixed assets, carry on renovation, modernization, technical re-equipment of material goods production and solving social issues on the modern technical basis. Despite the profound crisis of the industry associated with the transition to a market economic model such as a high degree of fixed capital assets depreciation, the low investment activity of construction companies, a high materials output ratio, etc., the growth potential of construction industry is sufficient. It is possible to solve these problems by promoting innovation activity of construction companies, aimed at reducing the cost of finished products, shortening of construction time and enterprises' competitive recovery.
Construction complex, construction materials producing industry, vologda oblast, innovation activity
Short address: https://sciup.org/147223399
IDR: 147223399 | UDC: 338.45:69.003(470.12)
Text of the scientific article Construction complex of the region: current state and innovative potential
Nowadays, the sustainable development of socio-economic systems is largely dependent of the effective use of innovations (technological, social, administrative, etc.). Moreover, it should be noted that individual levels of such systems should become a motive power of innovation development, as they are designed to create the necessary conditions for innovation activity in other parts of the system in order to overcome the fragmentariness of the innovation processes.
All this is fully applicable to the construction complex that always plays a key role in solving social and economic problems of Russia and its regions.
Hence, it is clear that there is an increase of innovation processes in the construction industry, which is characterized not only by a certain inertia and conservatism, but by a number of features that differentiate it from other sectors: they are the type of final products, specific working conditions, the length of product life cycle, pricing that is tightly bound to the place of product development, nonstationarity and heterogeneity of production, organization and management system, a variety of high risks.
All these things have a significant impact on the implementation of innovations in other spheres.
Firstly, innovations in the construction industry are the part of innovations in the economy, because buildings can be considered the same innovations as produced cars, equipment, new TV models, etc. And it is difficult to anticipate the innovations in other economical sectors without construction innovations.
Secondly, construction facilities in different industries are upgraded innovations. For example, such an innovation in the field of “transportation” as a monorail consists of a flyover and monorail, i.e. the products of construction sector, as well as a carriage, i.e. machine-building products.
Thirdly, the implementation of new technologies for launching new products and improving their quality in most industries requires the construction of new production facilities. It should be noted that high technology development requires ultrapure production facilities which are the innovations in construction and which are necessary to implement innovations in electronic, aviation, aerospace, biomedical, pharmaceutical and other industries.
Fourthly, the introduction of innovations in construction, which is associated with the use of up-to-date designs, materials and technologies, results in improving the living conditions of citizens. Thus, the use of radiation-efficient wall constructions and materials improves housing comfort, as well as it helps to reduce the number of cancer diseases among the population [3].
Fifthly, the construction of innovative buildings and social facilities (schools, hospitals, clinics, sanatoriums, recreation centres, kindergartens, stadiums, etc.) improves the quality of investment in human capital and upgrade the standard of population’s living.
All the facts that were mentioned above allow us to understand not only the importance of innovative changes in the construction industry for the economy, but their complexity in terms of implementation and management. Therefore, firstly, it is necessary to evaluate the potential of construction industry in the region that can be used by the sectoral enterprises to brisk up innovation processes.
It must be emphasized that the period of market reforms has worsened the economic situation in the vast majority of domestic construction companies. The graph data (fig. 1) clearly show that the dynamics of volume of construction and installation operations in the Vologda Oblast and Russia is synchronous in nature. It allows us to draw a conclusion about the unprecedented fall in construction volume over the period from the early 1990s until 2000 in the Vologda Oblast and in the whole country. This indicator had been growing only since the 2000s, and it lasted until 2007. There was another recession with the beginning of a new crisis in 2008. The 1990 indicators have not been achieved by today.
Reduced volume of work performed has resulted in the decrease in the number of employees in the industry (by 28 thousand people over 10 years). In the following decade, despite the revival activity of construction
Figure 1. Dynamics of volume of construction and installation operations, % to 1990
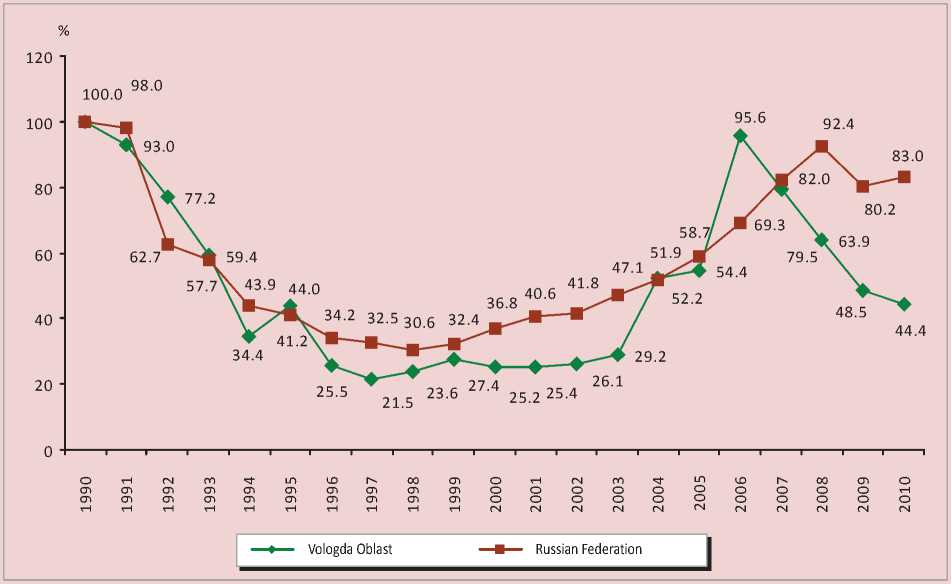
Table 1. The main indicators of the construction complex in the Vologda Oblast
One reason for this was the privatization of regional construction enterprises and organizations, which began at a quickened pace in 1992 and resulted in the significant changes in complex’s management. Territorial building associations ceased to act as the main control organizations and most of them were abolished.
A lot of trusts were liquidated, and their subdivisions were transformed into independent non-state organizations [6]. A lack of qualified personnel and organizational changes led to a decrease in the quality of construction work and non-compliance with construction time. The construction complex of the region had entered a phase of stagnation by the mid-1990s: the share of construction value added in the gross regional product volume decreased from 8.1% in 1995 to 5.9% in 2003.
However, the number of building companies of different forms of property increased during the economic reforms that indicated the increase in competition in the regional construction market (tab. 2) .
With the general increase in the number of organizations, the number of small businesses with the staff less than 100 people increased: their share in the total number of building organizations extended from 60.9% in 1991 to 96.6% in 2010. It should be noted that today the majority of construction organizations are privately owned (98.3% in 2010), accordingly, the share of private sector in the total construction contract work amounts to 90%.
Table 3, showing the dynamics of fixed assets in construction as a major factor of production of the industry, convinces us that it is one of the greatest challenges of the complex.
The depreciation of fixed assets and the share of fully depreciated fixed assets are increasing, which result in the negative impact not only on the construction business but on the regional economy on the whole. The economic potential of business assets reproduction is characterized clearly by renewal and retirement indicators. Construction assets renewal rates are slow. In the most favorable for the construction industry period from 2005 to 2008, the coefficient of renewal increased to 23.3% from 15.6% in 2005. Due to the economic crisis that resulted in the customers’ insolvency, construction companies had to send more funds to meet their current needs, so the coefficient of renewal reduced to 6.4%. Such a situation in funding was a result of low investment activity in construction. Thus, the share of building investment in the total investment declined from 21.3% in 1991 to 0.7% in 2010.
Table 2. The number of building companies in the Vologda Oblast
|
Indicators |
cd CD |
ОО CD CD |
UD CD CD |
g |
oo |
g |
о |
g |
о |
CD |
a |
|
Total number of building companies, un. |
786 |
1027 |
1098 |
1108 |
1039 |
876 |
809 |
798 |
865 |
921 |
930 |
|
Including (in % to the total number): - sate and municipal |
45.1 |
8.3 |
2.6 |
1.0 |
0.9 |
1.0 |
1.2 |
1.3 |
0.9 |
0.8 |
0.6 |
|
- privately owned |
10.6 |
73.1 |
90.4 |
92.1 |
96.6 |
97.1 |
97.5 |
97.5 |
98.2 |
98.4 |
98.3 |
|
- mixed patterns of ownership |
44.3 |
18.6 |
6.9 |
6.9 |
2.5 |
1.8 |
1.2 |
1.3 |
0.9 |
0.9 |
1.1 |
|
The share of building organizations with the number of employees up to 100 pers.,% |
60.9 |
68.8 |
87.2 |
94.4 |
95.1 |
94.9 |
93.3 |
93.4 |
94.6 |
96.2 |
96.6 |
Table 3. Indicators of capital assets state and flows in the construction complex
|
Indicators |
CD |
OO CD CD |
UD CD CD |
g |
OO |
g |
о |
g |
о |
CD |
a |
|
Fixed assets, bln. rub. |
1.0 |
32.8 |
1625.0 |
2038.0 |
1895.0 |
2856.6 |
4368.0 |
5317.9 |
4193.8 |
4434.0 |
4774.0 |
|
Structure of fixed assets by type, in% |
100 |
100 |
100 |
100 |
100 |
100 |
100 |
100 |
100 |
100 |
100 |
|
- buildings, facilities |
39.0 |
30.5 |
56.2 |
51.9 |
46.1 |
43.1 |
46.7 |
51.5 |
47.1 |
48 |
44.1 |
|
- machinery and equipment |
44.0 |
40.2 |
30.4 |
34.4 |
37.1 |
39.5 |
38.6 |
34.9 |
31.9 |
31.9 |
36.6 |
|
- transport |
16.0 |
27.6 |
12.5 |
12.2 |
14.5 |
15.6 |
12.5 |
12.3 |
19.6 |
18.5 |
17.6 |
|
- other |
1.0 |
1.7 |
0.9 |
0.5 |
2.3 |
1.8 |
2.2 |
1.3 |
1.4 |
1.6 |
1.7 |
|
Deterioration of fixed assets,% |
n/a |
33.8 |
43.9 |
46.9 |
33.1 |
33.1 |
32.5 |
35.1 |
29.7 |
35.0 |
44.1 |
|
Coefficient of renewal, % |
6.2 |
23.2 |
4.7 |
3.6 |
4.7 |
15.6 |
12.2 |
13.9 |
23.3 |
8.4 |
6.7 |
|
Retirement rate, % |
2.0 |
12.5 |
6.1 |
7.6 |
13.5 |
5.6 |
11.3 |
5.1 |
12.7 |
8.4 |
8.9 |
|
* Before 1995 – bln. rub. |
|||||||||||
It is important to note that the volume of production and other economic indicators of the construction industry significantly depend on the size of active capital assets directly involved in production. The growth trend in active capital assets due to the increase in the share of machinery and equipment and the excess of passive part is certainly positive in recent years. However, active capital assets are the most depreciated ones. Table 4 shows that there was an increase in the share of equipment with expired terms of office during the period under our study. Such a state of fixed assets is not able to provide efficient and competitive operation of construction companies in the region.
The objective necessity of rapid updating and restructuring of fixed assets in the construction sector is caused by the necessity [2]:
– to raise competitive capacity of most construction organizations in the region and their ability to take part in tenders in other regions;
– to implement new innovative technologies in construction, providing the high quality of facilities under construction and reducing construction time. This requires equipping organizations with specialized machinery and tools, technical innovations in the mechanization means of production and labour.
The main indicators of construction efficiency are the cost of installation and construction works and profit of building companies per one ruble of construction spread. Figure 2 shows two trends – cost escalation and earnings dilution.
Throughout the period under our study there were the changes in the cost structure of contract installation and construction works (fig. 3) .
There was a decrease in the share of material expenses in the cost of installation and construction works from 50% to 47% in the first half of the 1990s, which can be explained by directive targets to reduce the cost of work (up to 1992), reduction in the share of new construction, decrease in the building volume of public facilities that are constructed with the use of expensive finish materials; increase in the share of overhead expenses; using accumulated inventory accounted in the cost of lower prices, etc.
Since 2000, materials expenses escalation in the cost of installation and construction works is caused by the increase in the construction of apartment houses that have improved layout and “European-style finishing decoration”, excessive growth of prices for building materials over the rising cost of construction and installation works, increase in shipping costs of building materials and constructions, reduction in the value of depreciation charges due to the ageing of equipment and machinery, etc. Reducing the share of material expenses in 2009 – 2010 is connected with the increase in the share of labour and other costs.
Table 4. Availability and condition of the main building machines in construction organizations
|
Indicators |
Availability of construction machinery, pieces |
Share of cars beyond their service life, % |
||||||||||||
|
cd CD |
Ю CD CD |
g |
g |
co |
CD |
o |
cd CD |
LD CD CD |
g |
g |
co |
CD |
a |
|
|
Excavators |
1172 |
850 |
358 |
249 |
197 |
168 |
120 |
14.6 |
20.8 |
44.4 |
47.8 |
54.3 |
47.6 |
32.5 |
|
Cranes: - tower |
231 |
194 |
80 |
20 |
19 |
21 |
17 |
33.5 |
38.7 |
63.8 |
59.2 |
62.2 |
60.9 |
63.2 |
|
- rubber-tired |
153 |
114 |
46 |
13 |
5 |
6 |
4 |
24.2 |
53.5 |
67.4 |
69.9 |
60.0 |
66.7 |
100.0 |
|
- crawler-mounted |
263 |
235 |
117 |
92 |
50 |
60 |
65 |
17.4 |
50.6 |
73.1 |
87.0 |
82.0 |
70.0 |
58.5 |
|
Bulldozers |
1325 |
810 |
328 |
302 |
259 |
239 |
118 |
13.0 |
18.6 |
54.0 |
62.6 |
67.2 |
62.8 |
51.7 |
|
Tractors |
784 |
822 |
374 |
273 |
202 |
164 |
71 |
n/a |
12.4 |
40.9 |
57.1 |
55.9 |
61.6 |
32.4 |
Figure 2. Changing the cost per one ruble of installation and construction works and building companies’ profitability in the Vologda Oblast
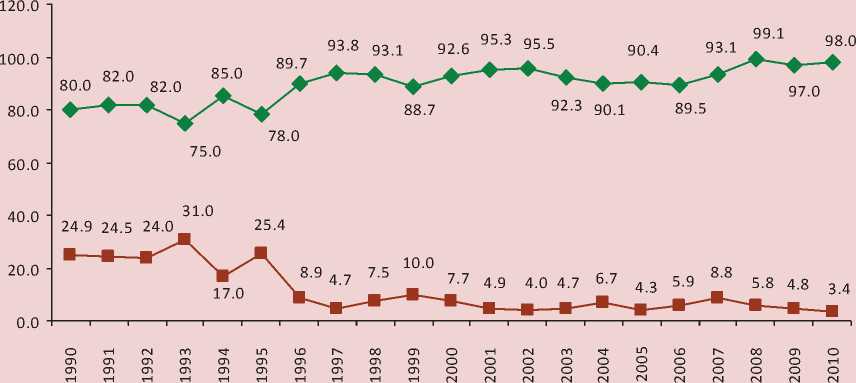
♦ Costs per one ruble of work performed by building companies, cop.
— ■ — Product profitability, %
Figure 3. Cost structure of installation and construction works in the Vologda Oblasts, %
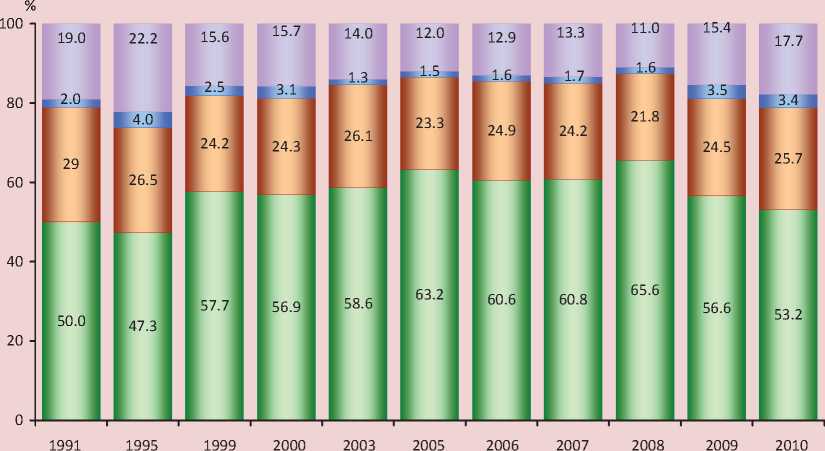
□ Material costs □ Labour costs
□ Depreciation of fixed assets □ Other costs
The share of labour costs in the cost of installation and construction works has not changed, and it ranges from 22 to 29%. Therefore, it is necessary to pay special attention to the problems of reducing material costs.
The indicators that characterize the efficiency of material resources in the construction complex of the Vologda Oblast are presented in table 5 .
Dynamics of changes in the materials output ratio is determined by the interaction of various factors, the effect of which may be implemented in opposite directions. The growth of construction materials output ratio in 1995 – 2010 was caused by the use of high-quality and durable building structures and details with a high degree of prefabrication, higher technical and operating characteristics, as well as by exceeding the growth rates of prices for building materials and building structures over the growth in the cost of installation and construction works, increase in transport tariffs, rise in prices for fuel, etc.
Since construction is one of the raw material intensive productions, reducing a materials output ratio is an important factor in increasing its efficiency. This will give the opportunity to cut the cost of construction and installation works and increase production profitability. The following ways can actively contribute to reducing the consumption of materials by the construction complex: implementing innovative technologies and structures in construction, improving building designs and constructions, excessing the growth rates of installation and construction works over increasing material costs, etc.
An important part of the construction complex is the industry of building materials, which in the Vologda Oblast is largely provided with raw materials containing own timber and non-metallic minerals (sand, gravel, clay, limestone). Production is oriented to manufacturing of precast concrete products and structures, small-sized wall materials, wooden and plastic windows and doors, woodbased slabs, plywood, millwork products and mouldings (tab. 6). Over last two decades the production of the main kinds of construction products was significantly reduced in 2010 in comparison with 1990: bricks – almost by 10 times, precast concrete products and structures – by 7.5 times, non-metallic materials – by 5.3 times respectively. This can be explained largely by the decline in construction companies’ demand for building materials, as well as by solvent debalance of financial and credit organizations that have lowered the amount of credit for the key builders due to the crisis. All facts mentioned above allow us to draw a conclusion that there is no enough capacity to produce competitive, import-substituting and innovative products to provide the construction sector with modern high-quality materials.
Despite the deepest crisis phenomena in the construction sector associated with the transition to the market economy, there is a significant growth potential in the construction industry:
– sufficient number of construction companies, which indicates a competition increase in the industry;
– mineral and resource base is enough to produce a wide range of materials, products and structures;
– sufficient volume of contract work that increases due to the expansion of consumer market and adoption of regional programmes on the development of house building.
However, there are some problems in the regional construction complex along with the positive aspects, overcoming of which can make the development of the industry more dynamic.
Table 5. Indicators of using material resources in the construction in the Vologda Oblast
|
Indicators |
1990 |
1995 |
2000 |
2003 |
2005 |
2006 |
2007 |
2008 |
2009 |
2010 |
|
Volume of construction and installation operations, bln. rub. at comparable 2010 prices |
61.9 |
26.5 |
15.2 |
17.5 |
32.7 |
57.5 |
47.8 |
38.4 |
29.2 |
26.7 |
|
Material costs, bln. rub. |
2406.3 |
9776.7 |
7994.3 |
9487.7 |
18703.0 |
31195.5 |
27055.2 |
24982.2 |
16034.5 |
13917.2 |
|
Materials output ratio, rub. |
0.40 |
0.37 |
0.53 |
0.54 |
0.57 |
0.54 |
0.57 |
0.65 |
0.55 |
0.52 |
|
Material efficiency, rub./rub. |
2.50 |
2.71 |
1.90 |
1.85 |
1.75 |
1.84 |
1.77 |
1.54 |
1.82 |
1,92 |
Table 6. The main kinds of building materials industry’s products in the Vologda Oblast
|
Indicators |
1990 |
1995 |
2000 |
2003 |
2005 |
2006 |
2007 |
2008 |
2009 |
2010 |
|
Construction brick, mln. piec. of conv. brick |
359 |
144 |
80.9 |
98.5 |
100.4 |
99 |
131.3 |
104.6 |
40.3 |
35.3 |
|
Precast concrete products and structures, thsd. м3 |
936 |
246 |
153.3 |
181 |
224.3 |
263.5 |
318 |
281.2 |
111.2 |
124.9 |
|
Construction non-metallic materials, mln. м3 |
11.3 |
3.1 |
1.3 |
1.4 |
2.3 |
2.1 |
2.4 |
2.4 |
2.3 |
2.1 |
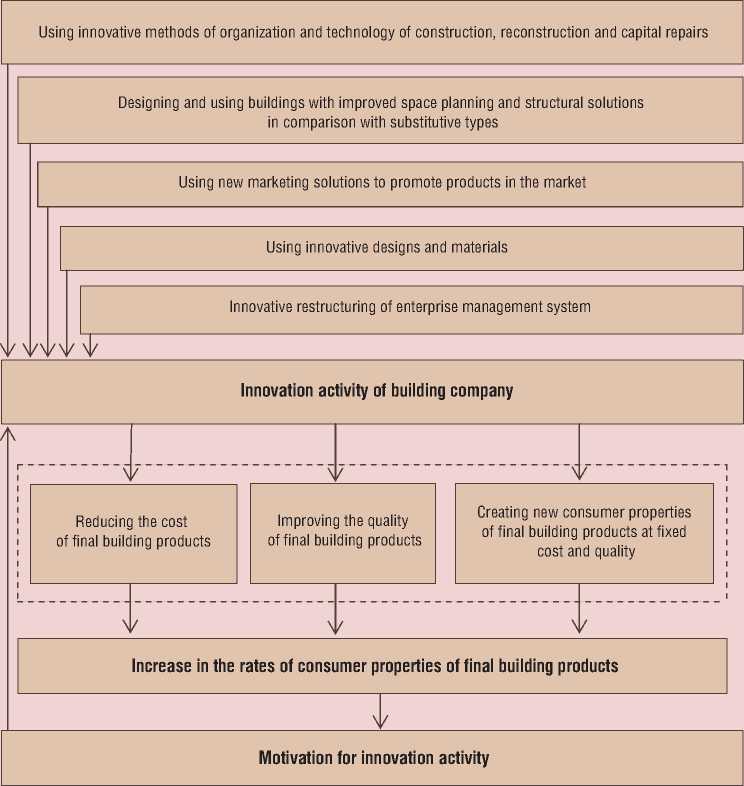
Figure 4. Incentives and direction of innovation process in construction
They include a high degree of plant and equipment depreciation, low investment activity of enterprises, high materials output ratio of finished products and, as a result, its low profitability.
Solving these problems is possible by promoting innovation activity of building companies, aimed at reducing the cost of final products, reducing construction time, increasing the competitiveness of industries through more efficient resource-saving (fig. 4) .
The figure shows that the incentives for construction companies’ innovative activity include the growth of quality and cost reduction as the factors that quantitatively change in assessing consumer properties of final building products, as well as establishing the new consumer properties of products at constant cost and quality as a factor that changes a rate of consumer characteristics of final construction products.
The incentive for implementing innovative products in construction is market competition that forces to cut down production costs and decrease the prices for products. The enterprises, which pioneered competitive innovation, have the opportunity to reduce production costs and, consequently, the cost of sales. As a result, they can strengthen the competition with the organizations offering the similar products. Thus, enterprises and organizations’ innovation activity contributes to their survival.
References Construction complex of the region: current state and innovative potential
- Abbasov G.A. Improving the management of investments in construction. Journal of Economic Integration. 2012. No. 2. P. 7-11.
- Aganbegyan A. Housing construction as a driver of socio-economic development of the country. Problems of Economics. 2012. No. 5. P. 59-70.
- Buresh O.V., Zelentsov D.G. Statistical analysis of seasonal dynamics indices of construction development. Journal of Economic Integration. -2011. No. 9. P. 51-57.
- Vorontsova T.V., Sorokina I.V. The use of innovation in construction by improving the pricing system. Bulletin of the Cherepovets State University. 2012. No. 3 (40). P. 25-29.
- Denisov G.A., Kamenetskiy M.I.The organization of innovation activity in the construction industry. Problems of forecasting. 2003. No. 3. P. 50-63.
- Kamenetskiy M.I. Construction sector and national economy: current trends, topical issues of perspective development. Problems of forecasting. 2011. No. 1 (124). P. 79-91.
- Kotlyarova S.N. Innovation barriers and developmental prospects for industrial markets in the case of the construction industry. Economy of the region. 2010. No. 3. P. 250-254.
- Manakov L.F., Faltinskiy R.A. Crisis in the investment and construction industry: sources, threats, new opportunities. Russia's economic recovery. 2009. No. 1 (19). P. 58-70.
- Statistical Yearbook of the Vologda Oblast. 1995-2001: Stat. Col. The Vologda Oblast Committee of State Statistics. Vologda, 2002. 294 p.
- Construction activity: Stat. Col. In: Territorial agency of the Federal State Statistics in the Vologda Oblast. Vologda, 2011. 90 p.
- Construction complex of the region: Stat. Col. In: Territorial agency of the Federal State Statistics in the Vologda Oblast. Vologda, 2004. 49 p.
- Federal State Statistics Service. Available at: http://www.gks.ru
