Convolution Based Technique for Indic Script Identification from Handwritten Document Images

Author: Sk Md Obaidullah, Nibaran Das, Kaushik Roy
Journal: International Journal of Image, Graphics and Signal Processing(IJIGSP) @ijigsp
Article in issue: 5 vol.7, 2015.
Free access
Determination of script type of document image is a complex real life problem for a multi-script country like India, where 23 official languages (including English) are present and 13 different scripts are used to write them. Including English and Roman those count become 23 and 13 respectively. The problem becomes more challenging when handwritten documents are considered. In this paper an approach for identifying the script type of handwritten document images written by any one of the Bangla, Devnagari, Roman and Urdu script is proposed. Two convolution based techniques, namely Gabor filter and Morphological reconstruction are combined and a feature vector of 20 dimensions is constructed. Due to unavailability of a standard data set, a corpus of 157 document images with an almost equal ratio of four types of script is prepared. During classification the dataset is divided into 2:1 ratio. An average identification accuracy rate of 94.4% is obtained on the test set. The average Bi-script and Tri-script identification accuracy rate was found to be 98.2% and 97.5% respectively. Statistical performance analysis is done using different well known classifiers.
Handwritten Script Identification, Convolution, 2D Gabor Filter, Morphological Filters, Statistical Performance Analysis
Short address: https://sciup.org/15013872
IDR: 15013872
Text of the scientific article Convolution Based Technique for Indic Script Identification from Handwritten Document Images
Published Online April 2015 in MECS DOI: 10.5815/ijigsp.2015.05.06
The dream of making a ‘paperless world’ would become a reality if an overwhelming volume of physical documents can be converted into its digital form. Document image processing researchers are working towards this goal by developing several numbers of techniques for automatic processing of document images. The initial step for developing such auto processing system is a representation of the document files into digital form. Increasing efforts and suitable discussions from the researchers are observed in literature [1, 2] for implementation of digital document image to alphanumeric text conversion system. Popularly such system is known as Optical Character Recognizer or in short OCR. The history of character recognition was originated as early as 1870 when the retina scanner system was invented by Carey [2], which was a photocell based image transmission system. After the invention of the digital computer, scientists realized the necessity of OCR as a document processing system during late 1960. As per record the first commercialized OCR was developed by IBM to read special font of IBM machines [2]. The field is maturing day by day by encapsulating smart capabilities in the system like, ability to handle complex documents which may contain text, graphics, mathematical symbols, historical documents with degraded quality and noise, color images etc. Ready to use commercial systems are coming as output of applied research in this field which includes reading aids for blinds’, automatic postal document sorter etc. Many algorithms are proposed in literature with very high accuracy rate and lower computational complexity. But the prerequisite for those algorithms are knowledge of the particular script by which the language is written. It is worth to mention here, in India 23 official languages are present (including English) [3] and 13 scripts are there to write those languages. Apart from this Roman script is very popular in India which is used to write English and Santali languages. In our daily life we come across various multi-script documents viz-a-viz postal documents, filled up pre-printed application forms, railway reservation forms etc. All the script identification systems can be classified into two broad categories. The first category is referred as Inter-document script identification problem, where as the latter one falls under the category of Intra-document script identification problem. But as mentioned earlier in both the cases script identification is must before feeding the document image to language specific OCR. The whole problem become more and more complex when the input document category changed from printed to handwritten one. This is because of versatility of writing style, variations in interline, inter-word spacing, character sizes for different users across the globe. That is why script identification from handwritten document is still an open challenge for the document image processing researchers. In this paper an attempt has made to identify any one of the four popular handwritten scripts namely Bangla, Devnagari, Roman and Urdu from unknown document images. Two convolution based techniques, namely Gabor filter and Morphological reconstruction are combined for feature extraction. Gabor filters are generally employed as a texture analysis tool in many applications. They provide encouraging results for printed document analysis [4]. But due to the varying nature of handwritten document for same script or same graphemes Gabor based feature will not be capable enough to capture the entire variability. Due to these observations morphological filters with user defined kernels are included in addition with Gabor filter as combined feature extraction tool.
The paper is organized as follows: In section II, previous works on handwritten script identification are mentioned. Section III provides a glimpse of Indian languages and scripts. Proposed methodology is discussed in section IV. Experimental details are discussed in section V. Finally conclusions are given is section 6 and references are available in the last section.
-
II. Releted Work
In the literature few works are reported on handwritten script identification problem. Among the pieces of work on Indic scripts, L. Zhou et al. [5] identified Bangla and English as scripts using connected component profile based features. The work was performed at line, word and character level. V. Singhal et al. [6] identified Roman, Devanagari, Bangla and Telugu scripts from the line level handwritten document images using rotation invariant texture features based on multi-channel Gabor filtering and Gray level co-occurrence matrix. Hochberg et al. [7] identified six Indian and non Indian scripts namely Arabic, Chinese, Cyrillic, Devanagari, Japanese and Latin using some features like horizontal and vertical centroids, sphericity, aspect ratio, white holes etc. In another work Roy et al. [8] identified six popular Indian scripts namely Bangla, Devanagari, Malayalam, Urdu, Oriya and Roman using component based features, fractal dimension based features, circularity based features etc. Using fractal based features Moussa et al. [9] identified Arabic and Latin scripts from line level handwritten document. M. Hangarge et al. [10] identified Roman, Devanagari and Urdu script using a texture based algorithm. The work was done at the block level. In a recent work Hangarge et al. [11] proposed a word level script identification technique considering Roman, Devnagari and four south Indian scripts namely Kannada, Telugu, Tamil and
Malayalam. Their primary investigation was capturing diagonal edge based shape information by applying 1D and 2D DCT, which they have reported as directional DCT based features.
A script can be described as a set of graphemes which are used to write a single language or a class of languages. Single language using a single script is very common and in this situation script and language identification has the same meaning. Examples of such scripts are Oriya, Tamil, Telegu, Urdu, Gujarati, Kannada etc. In comparison with this, Devnagari, Bangla, Roman etc. scripts are there which are used by more than one language. As, for example, Devnagari script is used by languages like Bodo, Konkani, Marathi, Maithili, Nepali, Sanskrit, Sindhi, Hindi etc., Roman script is used by English and Santali languages, Bangla script is used to write Bangla, Assamese and Manipuri languages.
In table 1 different Indic languages and scripts are shown with their belonging family and population distribution.
Table 1. Indic languages and scripts [1]
|
Sl . N o. |
Language Name |
Belonging Family |
Script Used |
Population (M) |
|
1 |
Hindi |
Indo-European |
Devnagari |
182 |
|
2 |
Marathi |
68.1 |
||
|
3 |
Konkani |
7.6 |
||
|
4 |
Sanskrit |
0.03 |
||
|
5 |
Sindhi |
21.4 |
||
|
6 |
Nepali |
13.9 |
||
|
7 |
Maithili |
34.7 |
||
|
8 |
Bodo |
Sino-Tibetan |
0.5 |
|
|
9 |
Bangla |
Indo-European |
Bangla |
181 |
|
10 |
Assamese |
16.8 |
||
|
11 |
Manipuri |
Sino-Tibetan |
13.7 |
|
|
12 |
Telugu |
Dravidian |
Telugu |
69.8 |
|
13 |
Tamil |
Tamil |
65.7 |
|
|
14 |
Urdu |
Indo-European |
Urdu |
60.6 |
|
15 |
Gujarati |
Gujarati |
46.5 |
|
|
16 |
Malayalam |
Dravidian |
Malayalam |
35.9 |
|
17 |
Oriya |
Indo-European |
Oriya |
31.7 |
|
18 |
Kashmiri |
Kashmiri |
5.6 |
|
|
19 |
Dogri |
Dogri |
3.8 |
|
|
20 |
Kannada |
Dravidian |
Kannada |
3.63 |
|
21 |
Punjabi |
Indo-European |
Gurumukhi |
1.05 |
|
22 |
Santali |
Austro-Asiatic |
Roman |
6.2 |
The present work is focused on four popular Indic scripts namely Bangla, Devnagari, Roman and Urdu. It is observed that Bangla and Devanagari scripts have a dominant feature called ‘matra’ or ‘shirorekha’ which lies on the top of the characters and join them forming a complete word. This headline based feature helps to differentiate them from other scripts very easily. Characters in Devnagari script are more circular nature than Bangla. Urdu script contains 28 small components which can be used as a distinguishing feature.
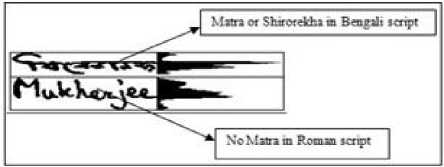
Fig. 1. ‘Matra’ or ‘Shirorekha’ in Bangla script [12]
Number of right diagonal lines present in Urdu script is more than other three scripts. Aspect ratio of Urdu characters is lowest among the four. Horizontal and vertical directional lines within the characters are more in Roman script.
in the case of printed document images [4, 30]. In the context of handwritten document, texture pattern varies abruptly from writer to writer and also from time to time. That is why only Gabor filter based texture feature will not be capable enough to capture the entire variability of handwritten document images. Observing this fact, we have combined Morphological features in addition with Gabor filter based features to identify scripts from handwritten document images. In a very recent work we have also employed these features along with some structural features to develop an application for machine printed and handwritten text separation. Following section provides a discussion about these two types of features.
• Gabor Filter Bank
-
IV. Proposed Approach
-
A. Preprocessing
Document digitization is done using an HP flatbed scanner at 300 dpi. All the images are initially loaded at gray scale with 256 levels. Image binarization is done using two stage based algorithm which is a combination of local and global technique. At first stage prebinarization is done by applying local window based algorithm in order to get an idea of different ROI (Region of Interest). After that RLSA (Run Length Smoothing Algorithm) is applied to the pre-binarized image, to overcome the limitations of the local binarization method used earlier. By applying RLSA hollow/stray regions generated due to fixed window size in local algorithm are smoothened. RLSA applied in both horizontal and vertical direction and then the XOR operation is done on the two results to generate different homogeneous blocks. Finally, using component labeling, each component is selected and mapped them in the original gray scale image to get respective zones of the original image. Final binary image (0, 1) is obtained using histogram based global binarization algorithm on these regions of the original image [3, 8, 12, 31].
The feature extraction process is carried out followed by the preprocessing step. During feature extraction 20 dimensional feature vector is constructed by combining two convolution based techniques, namely Gabor filter and Morphological reconstruction. Following section describes about feature extraction techniques.
-
B. Feature Extraction
One of the most important tasks for any identification work is feature extraction. Selection of ‘good’ features leads to better accuracy rate. Here ‘good’ features mean those set of features which increase inter-class variance and decrease intra-class variance. These feature set must also be computationally easier. For the present work, two convolution based techniques, namely Gabor filter and Morphological reconstruction are combined [29]. Gabor filters are proven successful to capture different textures
Gabor filter is a popular band pass filter which is used widely in application like texture analysis [13, 30]. The impulse response of Gabor filter is a sinusoid multiplied by a Gaussian kernel. Gabor filter bank is formed by modulating a complex sinusoid by a Gaussian function with different frequencies and orientations. If the Fourier transform of a Gabor filter's impulse response is calculated then this is equivalent if convolution of the Fourier transform of the harmonic function and the Fourier transform of the Gaussian function is computed separately. In orthogonal direction Gabor filter has a real and an imaginary component. These two components can be combined into a complex number or can be used individually for extracting features from image component. Disadvantage of Gabor filter can be in terms of its computational cost as large bank of filters need to be created for most of the pattern recognition applications. Dannis Gabor [14], proposed one dimensional Gabor filter which is the multiplication of a Gaussian kernel with cosine/sine (even/odd) function. Equations 1 and 2 shows the equations of 1D Gabor filter.
1 - x ge(x) = .---—e 2^ cos(2nfx) (1)
V 2 n^
1 - go(x) = rz— e 2ст sin(2nf) (2)
V 2пст
Complex version of Gabor filter can be formed which is shown using equation 1c
g ( x ) = g e ( X ) + g o ( x )
V 2.n^
V 2 пст
x 2
2 ст ^ 2
e
x 2
2 ст ст 2
(cos ( 2 n_ fx ) + i sin ( 2 n_ fx ) )
e
ii ( 2 n fx )
Daugman [15, 16], shows a representation of two dimensional Gabor filter by extending it in both x and y direction. Equations 2a and 2b shows the cosine and sine wave representation of 2D Gabor filter. Whereas (3)
shows a complete Gabor filter representation g (x, y, f, ϕ) where f is the frequency and ϕ is the orientation.
xy ge(x,y) = 2^0- e 2 "x "y cos(2nfxx + 2nfyoy)
xy go (x, y) = , 1----e 2 "x "y sink2nfx X + 2nf y)
2 Л" "
xy
- ( x 2 + У 2 )
g (x, y, f ,ф) = e "2 e 2nfi(x cos ф+y sin ф)
The frequency and orientation representation of Gabor filter is similar to those with the human visual system. That is why image processing and analysis with this filter is considered to be similar to perception in the human visual system. Different important features prevailing in an image can be computed by calculating Gabor filter with varying frequencies and orientations. Different applications in the area of pattern recognition and classification widely use features based on Gabor filter [17]. The response of Gabor filter to an image is determined by the 2-D convolution operation. In our application the filter will be convolve with the input image signal resulting a Gabor space. If I(x,y) is an image and G(x, y, f, ϕ) is the response of a Gabor filter with frequency f and orientation ϕ to an image on the (x,y) spatial coordinate of the image plane [19].
G ( x , y , f , ф ) = JJ I ( p , q ) g ( x - p , y - q , f, ф )dpdq ^
Following Fig. 2, 3 shows the properties of Gabor filter in one dimension and two dimensions. The response of the multiplication of Sinusoid and Gaussian kernel will generate a localized response over the sinusoid. This spatial localization property is used for texture analysis to discriminate different scripts.
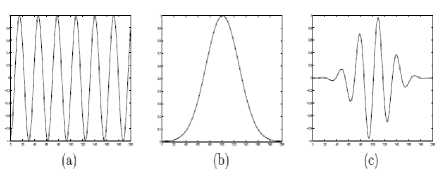
Fig. 2. 1-D Gabor filter, (a) a Sinusoid (b) a Gaussian kernel (c) corresponding Gabor filter [18]
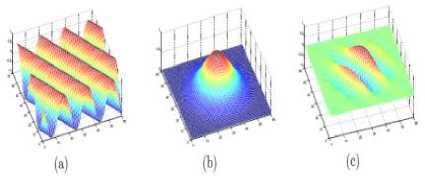
Fig. 3. 2-D Gabor filter, (a) a Sinusoid (b) a Gaussian kernel (c) corresponding Gabor filter [18]
In the proposed method, 8-dimensional feature vector is constructed to form a Gabor filter bank. Response of the filter with frequency 0.25 and orientation of 60º, 90º, 120º and 150º are calculated. These values are set experimentally. Then the standard deviation of the real part and imaginary part are considered as feature values. A sample feature vector computed using a frequency of 0.25 and orientation of 60º is shown below:
Bangla: [0.8558, 0.6771, 0.8538, 0.6468, 0.864, 0.6921, 0.8629, 0.7526]
Devnagari: [1.0004, 0.7774, 1.0003, 0.743, 1.0003, 0.791, 1.0003, 0.8575]
Roman: [0.8852, 0.705, 0.8401, 0.6409, 0.8107, 0.6566, 0.8087, 0.7063]
Urdu: [0.9611, 0.7598, 0.9313, 0.7071, 0.9121, 0.7392, 0.9169, 0.8009]
• Morphological Reconstruction
Morphological reconstruction based features are used along with Gabor filter based features for the present work. This improves overall performance of the system compared to if only Gabor filter is used. The basic morphological transformations are called dilation and erosion. In general, dilation is an operation which expands a region and erosion operation reduces that region. Also, dilation will tend to smooth concavities and erosion will tend to smooth away protrusions. Dilation and erosion are basically convolution of some image with some predefined structuring element or kernel [19, 29]. The operation erosion reassigns the present pixel value with the minimum pixel value computed in the defined pixel set as shown in Fig. 5. Whereas dilation is the reverse process compared to erosion replacing the current pixel with the maximum value computed. This is shown in Fig. 4.
The image dilation operation can be mathematically represented by the following equation:
dilate ( x, y ) = max (x’, y’ ε kernel) src ( x + x’, y + y’ ), where ‘src’ is the source image (8)
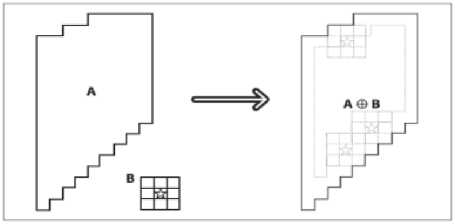
f ig . 4. m orphological dilation [ 19, 29 ]
The image erosion operation can be mathematically represented by the following equation:
erode ( x, y ) = min (x’, y’ ε kernel) src ( x + x’, y + y’ ), where
‘src’ is the source image.
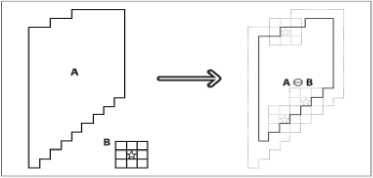
f ig . 5. m orphological erosion [ 19, 29 ]
We have created four different structuring elements (Horizontal, Vertical and Right and Left Angular) observing the directional stroke properties of the scripts considered. This helps in discriminating one script from another by identifying the presence of different directional strokes like horizontal, vertical, slanting lines or some curve with arbitrary orientation within the script. For example, Urdu scripts contain more diagonal strokes, Bangla/Devnagari contains upper horizontal line known as ‘matra’ or ‘shirorekha’, presence of vertical strokes are more prevalent in Roman script. Hence using horizontal structuring element the difference between these script types can be solely evaluated. Different structuring elements constructed for the present work is shown below:
|
0 |
0 |
0 |
0 |
0 |
0 |
0 |
0 |
0 |
0 |
0 |
|
1 |
1 |
1 |
1 |
1 |
1 |
1 |
1 |
1 |
1 |
1 |
|
0 |
0 |
0 |
0 |
0 |
0 |
0 |
0 |
0 |
0 |
0 |
Horizontal structuring element of dimension 3x11
|
0 |
1 |
0 |
|
0 |
1 |
0 |
|
0 |
1 |
0 |
|
0 |
1 |
0 |
|
0 |
1 |
0 |
|
0 |
1 |
0 |
|
0 |
1 |
0 |
|
0 |
1 |
0 |
|
0 |
1 |
0 |
|
0 |
1 |
0 |
|
0 |
1 |
0 |
Vertical structuring element of dimension 11x3
|
1 |
0 |
0 |
0 |
0 |
0 |
0 |
0 |
0 |
0 |
0 |
|
0 |
1 |
0 |
0 |
0 |
0 |
0 |
0 |
0 |
0 |
0 |
|
0 |
0 |
1 |
0 |
0 |
0 |
0 |
0 |
0 |
0 |
0 |
|
0 |
0 |
0 |
1 |
0 |
0 |
0 |
0 |
0 |
0 |
0 |
|
0 |
0 |
0 |
0 |
1 |
0 |
0 |
0 |
0 |
0 |
0 |
|
0 |
0 |
0 |
0 |
0 |
1 |
0 |
0 |
0 |
0 |
0 |
|
0 |
0 |
0 |
0 |
0 |
0 |
1 |
0 |
0 |
0 |
0 |
|
0 |
0 |
0 |
0 |
0 |
0 |
0 |
1 |
0 |
0 |
0 |
|
0 |
0 |
0 |
0 |
0 |
0 |
0 |
0 |
1 |
0 |
0 |
|
0 |
0 |
0 |
0 |
0 |
0 |
0 |
0 |
0 |
1 |
0 |
|
0 |
0 |
0 |
0 |
0 |
0 |
0 |
0 |
0 |
0 |
1 |
Left diagonal structuring element of dimension 11x11
|
0 |
0 |
0 |
0 |
0 |
0 |
0 |
0 |
0 |
0 |
1 |
|
0 |
0 |
0 |
0 |
0 |
0 |
0 |
0 |
0 |
1 |
0 |
|
0 |
0 |
0 |
0 |
0 |
0 |
0 |
0 |
1 |
0 |
0 |
|
0 |
0 |
0 |
0 |
0 |
0 |
0 |
1 |
0 |
0 |
0 |
|
0 |
0 |
0 |
0 |
0 |
0 |
1 |
0 |
0 |
0 |
0 |
|
0 |
0 |
0 |
0 |
0 |
1 |
0 |
0 |
0 |
0 |
0 |
|
0 |
0 |
0 |
0 |
1 |
0 |
0 |
0 |
0 |
0 |
0 |
|
0 |
0 |
0 |
1 |
0 |
0 |
0 |
0 |
0 |
0 |
0 |
|
0 |
0 |
1 |
0 |
0 |
0 |
0 |
0 |
0 |
0 |
0 |
|
0 |
1 |
0 |
0 |
0 |
0 |
0 |
0 |
0 |
0 |
0 |
|
1 |
0 |
0 |
0 |
0 |
0 |
0 |
0 |
0 |
0 |
0 |
Right diagonal structuring element of dimension 11x11
Grayscale script images are taken as input at the document level and are binarized using the method mentioned in the preprocessing section 4.1. The binarized image is resized with an image size which is fixed empirically. The resized image is dilated using the default kernel of OpenCV [19].The dilated image is then eroded four times using four different structural elements (horizontal, vertical, right and left angular).The ratio of those eroded images with the dilated one gives four feature values and calculation of the average and standard deviation of the eroded images give another eight feature values resulting a 12 dimensional morphological feature bank.
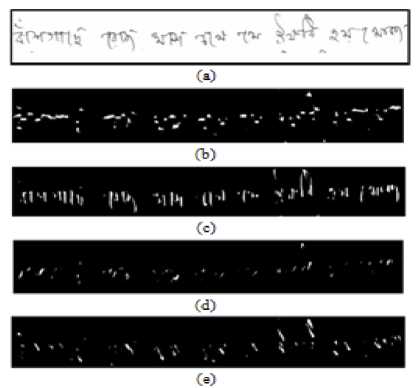
Fig. 6. (a) Sample image of Bangla script and (b-e) the images after using morphological dilation operation on that
A sample feature vector computed using morphological reconstruction is shown below:
Bangla: [0.6087, 0.155, 0.2754, 0.022, 0.324, 0.5381, 0.4066, 0.5656, 0.1931, 0.336, 0.3591, 0.4913]
Devnagari: [0.4056, 0.1092, 0.1809, 0.0202, 0.5945, 0.9899, 0.4968, 0.6117, 0.513, 0.5829, 0.4592, 0.5356]
Roman: [0.5885, 0.1334, 0.0615, 0.0451, 0.4165, 0.7802, 1.0065, 0.4421, 0.2311, 0.3099, 0.7784, 0.3864]
Urdu: [0.6689, 0.112, 0.1516, 0.0502, 0.4076, 1.1667, 0.7584, 0.6074, 0.2633, 0.9367, 0.9304, 0.4681]
-
V. Experimentation
Experimentation was done using Intel OpenCV [19] which is an open source library containing many useful classes. This library can be embedded with an existing C++ interface with some simple configuration.
-
A. Data Collection
One of the most imperative tasks is the data collection. There is a problem of readiness of standard database in this field of research. Benchmark database of official handwritten scripts is not available till date. Data are collected from different people with varying age, professions and locations to incorporate versatility in the database. Total 157 handwritten document images with nearly equal distribution are collected and used for experimentation. By dividing the collected samples in 2:1 ratio, training and test sets are formed. Fig. 7 shows script images from our collected database.
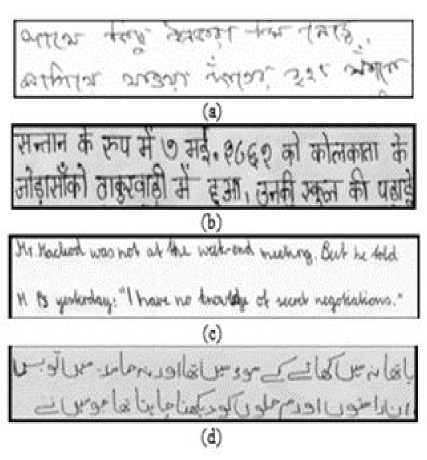
Fig. 7. Sample images of (a) Bangla (b) Devanagari (c) Roman (d) Urdu script documents from the present database
-
B. Classification and Experimental Result
The feature extraction is followed by classification which comprises of two stages namely, training and testing. For present work MLP classifier is mainly used.
-
• Multi Layer Perceptron (MLP)
MLP uses back propagation algorithm to classify instances. It is a layered feed forward network which can be represented by a DAG (Directed Acyclic Graph). Each node of an MLP is termed as an artificial neuron. The weights/labels given in each directed arc represents the strength/capacity of synaptic connection between two neurons and the direction of the signal flow. In MLP there is an input and output layer. The number of neurons in input layer is same as the number of feature selected for the particular pattern recognition problem. Whereas the number of output layer is same as the number of target classes. The neurons in hidden and output layers compute the sigmoidal function on the sum of the products of inputs and weights of the corresponding connections to each neuron. Training process of an MLP involves tuning the strengths of its synaptic connections such that the MLP can respond properly to every input values taken from the training set. The total number of hidden layers and the number of neurons present in each hidden layer should be determined during training process [1, 8, 31].
For the present work, as the feature set is twenty dimensional and the number of scripts are four, so the number of neurons in input layer and output layer are twenty and four respectively. The number of neurons for the hidden layer is chosen automatically (the default value) by the MLP classifier of the Weka tool [20]. The whole data set is divided into training and test set in 2:1
ratio. Average accuracy rate found using MLP is 94.4% on the test data without any rejection.
Table 2. Confusion matrix on the test set considering four scripts using MLP classifier
|
Script |
Classified As |
|||
|
Bangla |
Devanagari |
Roman |
Urdu |
|
|
Bangla |
6 |
0 |
0 |
0 |
|
Devanagari |
0 |
16 |
0 |
1 |
|
Roman |
2 |
0 |
14 |
0 |
|
Urdu |
0 |
0 |
0 |
14 |
Average percentage accuracy rate: 94.4%
Table 3. Average Bi-Script accuracy rate (%) using MLP classifier
|
Script Combination |
Average Accuracy Rate (%) |
|
Bangla, Devnagari |
100 |
|
Bangla, Roman |
100 |
|
Bangla, Urdu |
100 |
|
Devnagari, Roman |
96.2 |
|
Devnagari, Urdu |
96.2 |
|
Roman, Urdu |
96.3 |
|
µ |
98.2 |
Table 4. Average Tri-Script accuracy rate (%) using MLP classifier
|
Script Combination |
Average Accuracy Rate (%) |
|
Bangla, Devnagari, Roman |
95 |
|
Bangla, Devnagari, Urdu |
100 |
|
Devnagari, Roman, Urdu |
97.5 |
|
µ |
97.5 |
Table 5. Comparative study with few of the existing methods (dataset dependent)
|
Algorithm |
Scripts Considered |
Avg. Acc. Rate (%) |
|
J. Hochberg et al. 1997 |
Arabic, Chinese, Cyrillic, Devanagari, Roman, Japanese |
88 |
|
M. Hangarge and B. V. Dhandra 2010 |
Roman, Devanagari, Urdu |
88.6 |
|
M. Hangarge et al. 2013 |
Roman, Devnagari, Kannada, Telugu, Tamil, Malayalam |
85.77 |
|
K. Roy et al. 2011 |
Bangla, Devanagari, Malayalam, Urdu, Oriya and Roman |
89.48 |
|
Proposed Method |
Bangla, Devanagari, Roman, Urdu |
94.4 |
|
Average Tri-script |
97.5 |
|
|
Average Bi-script |
98.2 |
C. Statistical Performance Analysis
Statistical performance analysis using different well known classifiers is done in the present work. Beside MLP we have tested the performance of Bayesnet, LibLINEAR, FURIA, Logistic Model Tree and RBFNetwork classifiers [20]. Some standard and relevant parameters namely Average Accuracy Rate, Kappa Statistics, Mean Absolute Error, Relative Absolute Error, TP Rate, FP Rate, Precision, Recall, F-Measure are computed for this performance analysis. Their weighted average values are shown in table 6. Following section provides brief discussions parameters considered:
Kappa Statistics: Measures the agreement of prediction with the true class. It can be defined as KS = (P(A) – P(E))/(1 – P(E)), where P(A) is the percentage agreement and P(E) is the chance agreement. Complete agreement is referred by the value KS = 1 and KS = 0 indicates chance agreement.
Mean Absolute Error: It is measured as the average of the difference output or predicted result and target or actual result in all the test cases. It is measured by the following formula:
1 n
= ∑ I ti - oi I n i = 1 (10)
here t i is the target result and o i is the output result.
Relative Absolute Error: It is the absolute error made relative to what the error would have been if the prediction simply had been the average of the target values. It is measured by the following formula:
n t -o ii
RAE = i = 1
n
∑ti -t i=1 (11)
here t i is the target result and o i is the output result.
TP Rate: True positive rate is defined as the proportion of the test samples among all which were classified correctly to a target class at which they should belong.
FP Rate: It is opposite to TP rate. False positive rate is proportion of the test samples which belongs to a particular class but misclassified to a different class.
Precision: It is defined as proportion of the test samples which truly have classified to a particular class among all those which were classified to that class. So, Precision = TP Number / (TP Number + FP Number) . In table 1, weighted average precision is ((6/6) + (16/17) + (14/16) + (14/14))/4 = 0.954.
Recall: Recall can be defined as Recall = TP Number / (TP Number + FN Number). Here FN Number is the false negative number.
F-Measure: It is a combined measure for precision and recall. It is defined as F-Measure = 2 * Precision * Recall / (Precision + Recall).
Brief description about the classifiers used for the present work is provided:
-
• Bayesnet
Popular Bayesian classifier uses Bayes Network learning using different search algorithms and quality parameters [21]. The base class of this classifier provides data structures (conditional probability distributions, network structure etc.) and facilities common to Bayes Network learning algorithms like K2 and B. Experimentally BayesNet gives an average accuracy rate of 86.8%.
-
• LibLINEAR
LibLINEAR is a good linear classifier based on functional model for data with large number of instances or features. We have used the L2-Loss Support Vector Machine (dual) as the SVM Type parameter of the LIBLINEAR both the Bias and Cost parameters are 1.0. The EPS (the tolerance of the termination criterion) is 0.01. For more details see [22]. Average accuracy found by LibLINEAR is 83.1%.
-
• FURIA
Fuzzy Unordered Rule Induction Algorithm (FURIA) is a fuzzy-rule-based classifier, used to obtain fuzzy rules. FURIA has recently been developed as an extension of the well-known RIPPER algorithm. Instead of conventional rules and rule lists it learns fuzzy rules and unordered rule sets. Furthermore it uses an efficient rule stretching scheme to deal with uncovered examples [23]. Average accuracy found by FURIA is 83.1.
-
• Logistic Model Tree
Classifier for building 'logistic model trees', which are classification trees with logistic regression functions at the leaves. The algorithm can deal with binary and multiclass target variables, numeric and nominal attributes and missing values. For more detail refer [24, 25]. The average identification rate is found to be 90.6%.
-
• RBFNetwork
In Radial basis function (RBF) networks for hidden layer processing elements the static Gaussian function has been used as the nonlinearity. The function works in a small centered region of the input space [26]. The implementation of the network depends on the centers of the Gaussian functions [27, 28]. The main functionality depends on how the Gaussian centres are derived and they act as weights of input to hidden layer. The widths of the Gaussians are calculated depending on the centres of their neighbors. The faster convergence criterion is one of the advantages of this network. This is because it only updates weights from hidden to output layer. Average accuracy rate found by this classifier is 86.8%.
Table 6. Statistical performance analysis on the test samples, weighted average of the measuring parameters are shown here
|
Classifier |
AAR (%) |
KS |
MAE |
RAE (%) |
TP Rate |
FP Rate |
Precision |
Recall |
F -Measure |
|
MLP |
94.4 |
0.9226 |
0.0439 |
11.46 |
0.943 |
0.012 |
0.954 |
0.943 |
0.945 |
|
LMT |
90.6 |
0.8710 |
0.0386 |
10.10 |
0.906 |
0.029 |
0.918 |
0.906 |
0.907 |
|
BayesNet |
86.8 |
0.8208 |
0.0619 |
16.17 |
0.868 |
0.036 |
0.894 |
0.868 |
0.869 |
|
RBFNetwork |
86.8 |
0.8169 |
0.0854 |
22.32 |
0.868 |
0.042 |
0.877 |
0.868 |
0.869 |
|
LibLINEAR |
83.1 |
0.7720 |
0.0849 |
22.19 |
0.830 |
0.041 |
0.877 |
0.830 |
0.834 |
|
FURIA |
83.1 |
0.7683 |
0.0928 |
24.27 |
0.830 |
0.058 |
0.852 |
0.830 |
0.830 |
Parameter Considered: AAR: Average Accuracy Rate, KS: Kappa Statistics, MAE: Mean Absolute Error, RAE: Relative Absolute Error, TP Rate, FP Rate, Precision, Recall, F-Measure
-
VI. Conclusion
In the present work, a Gabor filter based script identification technique combined with Morphological reconstruction from offline handwritten documents of Bangla, Devanagari, Roman and Urdu scripts has been developed. Experimental result shows an average recognition accuracy of 94.4% on test set using MLP classifier. Average tri-script and bi-script accuracy rate was found to be 97.5% and 98.2% respectively. The result is comparable with existing methods available in the literature. Statistical performance analysis with different well known classifiers is done. Performances are measured using different parameters namely Average Accuracy Rate, Kappa Statistics, Mean Absolute Error, Relative Absolute Error, TP Rate, FP Rate, Precision, Recall, F-Measure. There is a problem of adequacy of standard database in this kind of research. Printed scripts can be available from different sources like books, papers from different libraries, news papers in different regional languages etc., but the collection of handwritten script database for different scripts is a real challenge. Future plans of authors consist of building a standard handwritten database for official Indic scripts and development of benchmark result on that. Scopes can be further extended to work on real life upcoming script identification problems like character level script identification from artistic words, script identification from scene images, video based script identification etc.
Acknowledgement
The first author of the paper is very much thankful to Hon’ble Vice Chancellor of Aliah University for extending his encouragement and support for carrying out the work besides regular academic and administrative duties.
References Convolution Based Technique for Indic Script Identification from Handwritten Document Images
- http://shodhganga.inflibnet.ac.in/bitstream/10603/4166/10/10_chapter%202.pdf, accessed 1st October 2014.
- Mantas J., "An overview of Character Recognition Methodologies", Pattern Recognition, vol. 19, pp. 425-430, 1986.
- S. M. Obaidullah, S. K. Das, K. Roy, "A System for Handwritten Script Identification From Indian Document", in Journal of Pattern Recognition Research, vol. 8, no. 1, 2013, pp. 1-12.
- D. Ghosh, T. Dube, A. P. Shivaprasad, "Script Recognition- A Review", IEEE Transactions on Pattern Analysis and Machine Intelligence, pp. 2142-2161, 2010.
- L. Zhou, Y. Lu , C. L. Tan, "Bangla/English Script Identification Based on Analysis of Connected Component Profiles", Lecture Notes in Computer Science, Volume 3872/2006, 24354, 2006, DOI: 10.1007/11669487_22.
- V. Singhal, N. Navin, D. Ghosh, "Script-based Classification of Hand-written Text Document in a Multilingual Environment", Research Issues in Data Engineering, pp.47, 2003.
- J. Hochberg, P. Kelly, T. Thomas, L. Kerns, "Automatic Script Identification from Document Images Using Cluster-based Templates", IEEE Trans. on Pattern Analysis & Machine Intelligence, vol. 19, no. 2, pp. 176-181, 1997.
- K. Roy, S. K. Das, S. M. Obaidullah, "Script Identification from Handwritten Document", In Proceedings of The third National Conference on Computer Vision, Pattern Recognition, Image Processing and Graphics (NCVPRIPG), Hubli, Karnataka, pp. 66-69, 2011.
- S. B. Moussa, A. Zahour, A. Benabdelhafid, A.M. Alimi, "Fractal-Based System for Arabic/Latin, Printed/Handwritten Script Identification", In Proceedings of International Conference on Pattern Recognition, pp. 1-4, 2008.
- M. Hangarge, B. V. Dhandra, "Offline handwritten script identification in document images", International Journal of Computer Application, 4(6), pp. 6-10, 2010.
- M. Hangarge, K. C. Santosh, R. Pardeshi, "Directional Discrete Cosine Transform for Handwritten Script Identification", In Proceedings of 12th International Conference on Document Analysis and Recognition, pp. 344-348, 2013.
- K. Roy, U. Pal, A. Banerjee, "A system for word-wise handwritten script identification for Indian postal automation", IEEE INDICON, pp. 266-271, 2004.
- I. Fogel, D. Sagi, "Gabor filters as texture discriminator", Biological Cybernetics, 61 (2), 1989.
- D. Gabor, "Theory of Communication", Journal of the Institute of Electrical Engineers, 93, pp. 429-457, 1946.
- J. Daugman, "Two-dimensional analysis of cortical receptive field profiles", Vision Research, 20, pp. 846–856, 1980.
- J. Daugman, "Uncertainty relation for resolution in space, spatial frequency, and orientation optimized by two-dimensional visual cortical filters", Journal of the Optical Society of America-A, 2(7), pp. 1160–1169, 1985.
- M. Haghighat, S. Zonouz, M. A. Mottaleb, "Identification Using Encrypted Biometrics", Computer Analysis of Images and Patterns, LNCS 8048, pp. 440-448, 2013.
- V. Shiv Naga Prasad, Justin Domke, "Gabor filter visualization", Technical Report, University of Maryland, 2005.
- A. Kaehler, G. R. Bradski, "Learning OpenCV", O'reilly Media, 2008.
- M. Hall, E. Frank, G. Holmes, B. Pfahringer, P. Reutemann and I. H. Witten, "The WEKA Data Mining Software: An Update", SIGKDD Explorations, Vol. 11, pp. 10-18, 2009.
- N Friedman, D Geiger, M Goldszmidt, "Bayesian network classifiers", Machine learning 29 (2-3), 131-163, 1997.
- R. E. Fan, K. W. Chang, C. J. Hsieh, X. R. Wang, C. J.Lin, "LIBLINEAR: A library for large linear classification", Journal of Machine Learning Research, vol. 9, pp. 1871-1874, 2008.
- J. Hühn, E. Hüllermeier, P. U. Marburg, "FURIA: An Algorithm for Unordered Fuzzy Rule Induction", Data Mining and Knowledge Discovery, Vol. 19, pp. 293-319, 2009.
- N. Landwehr, M. Hall, E. Frank, "Logistic Model Trees", Machine Learning, Vol. 95, pp. 161-205, 2005.
- M. Sumner, E. Frank, M. Hall, "Speeding up Logistic Model Tree Induction", 9th European Conference on Principles and Practice of Knowledge Discovery in Databases, pp. 675-683, 2005.
- M. D. Buhmann, "Radial Basis Functions: Theory and Implementations", 12th Cambridge Monographs on Applied and Computational Mathematics, Cambridge University Press, Cambridge, 2003.
- S. V. Chakravarthy, J. Ghosh, "Scale-Based Clustering using Radial Basis Function Network", IEEE Trans. on Neural Networks, vol. 7, pp. 1250-1261, 1996.
- A. J. Howell, H. Buxton, "RBF Network Methods for Face Detection and Attentional Frames", Neural Processing Letters, Vol. 15, pp.197-211, 2002.
- S. M. Obaidullah, N. Das, K. Roy, "Gabor Filter Based Technique for Offline Script Identification from Handwritten Document Images", at Proceedings of International Conference on Devices, Circuits and Communications, Mesra, Ranchi, 2014.
- A. B. Khalifa, L. Rzouga, N. E. B. Amara, "Wavelet, Gabor Filters and Co-occurrence Matrix for Palmprint Verification", IJIGSP, vol.5, no.8, pp.1-8, 2013.DOI: 10.5815/ijigsp.2013.08.01.
- S. M. Obaidullah, A. Mondal, N. Das, and K. Roy, "Script Identification from Printed Indian Document Images and Performance Evaluation Using Different Classifiers," Applied Computational Intelligence and Soft Computing, vol. 2014, Article ID 896128, 12 pages, 2014. doi:10.1155/2014/896128.
