Data Mining Methods for Detecting the Most Significant Factors Affecting Students’ Performance

Author: Mohammed Abdullah Al-Hagery, Maryam Abdullah Alzaid, Tahani Soud Alharbi, Moody Abdulrahman Alhanaya
Journal: International Journal of Information Technology and Computer Science @ijitcs
Article in issue: 5 Vol. 12, 2020.
Free access
The field of using Data Mining (DM) techniques in educational environments is typically identified as Educational Data Mining (EDM). EDM is rapidly becoming an important field of research due to its ability to extract valuable knowledge from various educational datasets. During the past decade, an increasing interest has arisen within many practical studies to study and analyze educational data especially students’ performance. The performance of students plays a vital role in higher education institutions. In keeping with this, there is a clear need to investigate factors influencing students’ performance. This study was carried out to identify the factors affecting students’ academic performance. K-means and X-means clustering techniques were applied to analyze the data to find the relationship of the students' performance with these factors. The study finding includes a set of the most influencing personal and social factors on the students’ performance such as parents’ occupation, parents’ qualification, and income rate. Furthermore, it is contributing to improving the education quality, as well as, it motivates educational institutions to benefit and discover the unseen patterns of knowledge in their students' accumulated data.
Clustering, Quality of Learning, Educational Data Mining, Clustering Algorithms, Students' Performance
Short address: https://sciup.org/15017463
IDR: 15017463 | DOI: 10.5815/ijitcs.2020.05.01
Text of the scientific article Data Mining Methods for Detecting the Most Significant Factors Affecting Students’ Performance
Published Online October 2020 in MECS DOI: 10.5815/ijitcs.2020.05.01
EDM extracts knowledge from the educational data that could potentially have a greater influence on educational research and practice [1]. In addition, EDM discovers the educational data to better understand the educational issues using the fundamental nature of DM techniques. During the last decade, researchers in this field were interested in extracting useful and valuable knowledge especially that related to students’ performance [2]. The motivation behind this interest is attributed to help educational institutions to take decisions and improve educational strategies [3]. In addition to helping students to enhance their academic performance and to overcome their difficulties in learning.
Measuring the student's performance is a major problem since it hinges on various factors like personal, psychological, social, and other environmental variables. This challenge can be solved by identifying the most significant factors affecting student academic performance, which is a required topic in the EDM domain. Several types of researches [4] were conducted to predict student performance using data mining techniques such as clustering and classification. Some of these studies depended on students' behavior and activities [5], while other researchers used academic marks [6, 7, 8] or Psychological features [9], which were also have been used to predict student's performance. Some of these factors are maybe not enough to analyze student behavior or the data used is sensitive and no one allowed having access to, which may be considered as limitations for these studies. Social and personal factors unlike psychological and academic results factors are insensitive, available and can be studied to determine student performance. Moreover, social and personal factors greatly influence student performance such as hours spent on a weekly basis with friends, father's and mother’s qualifications and family income EDM techniques have the potential that helps to spot out the most effective factors, which work with student performance [10, 11]. It offers a valuable way to look into the hidden and interesting relationships in the education system of students [12, 13]. The aim of this study is to extract the impact of personal and social factors of higher education students on their academic performance by applying DM techniques. These factors, in turn, help educational institutions raise their educational quality technique, contribute to enhance teaching strategies, support decision-makers for their decision evaluation. This research may help to reduce the student failing ratio by taking into account the most important factor that affects a student's performance.DM provides many effective techniques that could be used to achieve the objectives of this study [3]. Each technique or method has its merits and demerits. Clustering is the most effective DM technique used to analyze the dataset by partitioning it into homogeneous groups. Clustering can be useful to solve some of the complex problems such that managing the large capacity of databases, data that have many attributes and different types of attributes [14]. Hence, this paper uses multiple clustering methods to analyze the relationship of the students' performance with the related affecting factors. The K-means and X-means algorithms are applied to segregate the data into k clusters based on their similarity characteristics. K represents the number of clusters and is calculated by the analyst to derive an effective grouping of data.
The rest of the paper is structured into four sections. Section 2 is devoted to the literature review. Section 3 contains the methodology in detailed steps for implementing the processes of DM. In Section 4, the final results are discussed. Finally, Section 5 presents the conclusions.
2. Literature Review
A multitude of researches concerning not only the varied factors that influence the performance of students like personal, social, psychological and other environmental variables but also the techniques that have been used for the performance prediction is available in the literature. A number of selected studies are mentioned below for reference.
Tismy et al. [13] collected data like group action, class test, seminar and assignment marks from the students' previous data to predict the performance at the beginning of the semester. They employed the classification to predict the students' division on the premise of prepared information. They used Naïve theorem and web-based application as a proposed system made to use the Navïe Bayesian mining technique to extract useful information. Navïe Bayesian algorithm provides more accuracy over other methods like regression, decision tree, and neural networks. Durairaj and Vijitha [15] reported that they developed a trusted model using DM techniques, which mines required information to predict student's performance in educational environments. The presented education system was proposed as a strategic management tool. Student details have been taken as vital information for analysis. The K-means test was used to choose the best cluster centre, which is to be treated as the centroid. A model with five clusters was produced by the clustering method. Navïe Bayes algorithm was also applied to analyze data. In the research, the parameters used to evaluate the performance of the classifiers were TP rate, FP rate, and Precision, Recall F-Measure, and ROC area. Ahmed and Elaraby [5] applied one of the classification methods that are decision tree on student's database obtained from the Information System department of an educational institution to predict the student's performance based on previously recorded students' behaviour and activities. Their results showed that the study was able to predict- to a certain extent- the students' final grades in the selected course program. Abu Saa [8] conducted research on a group of 270 students enrolled in different colleges in Ajman University of Science and Technology in the United Arab Emirates. The researcher used multiple classification techniques (four decision tree algorithms and Navïe Bayes algorithm) for predicting the students' grade at the end of the semester. Aher and Lobo [16] collected two datasets for final year students from one college to predict student's final mark in the early phase of a particular course. The DM techniques were applied (classification and clustering) using WEKA DM software. Kong et al. [9] introduced a method of DM, which combines the concepts of contrast sets mining with association rules. They provided quantitative analysis for the similarity and difference of association rules obtained from the academic records datasets of multiple grades. Association rules were identified by generating positive association rules from frequent itemsets. Two indicators have been selected (support and confidence) and negative association rules were generated. The analysis method combining contrast set mining and association rules were applied to pre-processed data. Mhetre and Nagar [17] proposed a classification-based predictive model to classify students: slow, average and fast based on the student's overall performance. Four classifiers were performed in the classification stage: Naïve Bayes, J48, ZeroR, and Random Tree to choose the most accurate one. Learners were classified based on various combinations of students' details such as GBA and assignments marks to get results that are based on the overall performance of the student. Experiments and results proved that Random Tree is potentially effective and an efficient classifier algorithm.
Naik et al. [32] compared implementation of a hybrid approach of Enhanced k-strange points clustering algorithm and Naïve Bayes classification algorithm with the existing hybrid approach, which is K-means clustering algorithm and decision tree. Multiple linear regression was used to predict student performance only. The existing approach proved that its results were better for the given data. Mueen et al. [33] applied DM techniques to predict students' performance based on their academic record and discussion on forums. In their work, the data of students was collected from two courses at the undergraduate level. They applied the ranking algorithm to select appropriate features. Then, a number of three various DM classification methods (Naïve Bayes, Neural Network and Decision Tree) were employed on students’ dataset. It was observed that Navïe Bayes classifier perform better than the other two classifiers for the prediction by achieving an overall accuracy of 86%.
In our research, we concentrated to discover the influencing factors that have a noticeable impact on the academic performance of students. The studied factors included students' social and personal factors. Contrary to previous studies, the focused factors in this research were comprehensive, insensitive and measurable which lead to achieving the goal of this study.
3. Methodology
Students' academic performance analysis requires various parameters to be taken into consideration. Our study aims to analyze the academic performance of the students by studying the social and personal factors that influence student’s performance. This study was conducted on a different group of students enrolled in Qassim University, Saudi
Arabia. The data of these students are analyzed using clustering DM techniques.
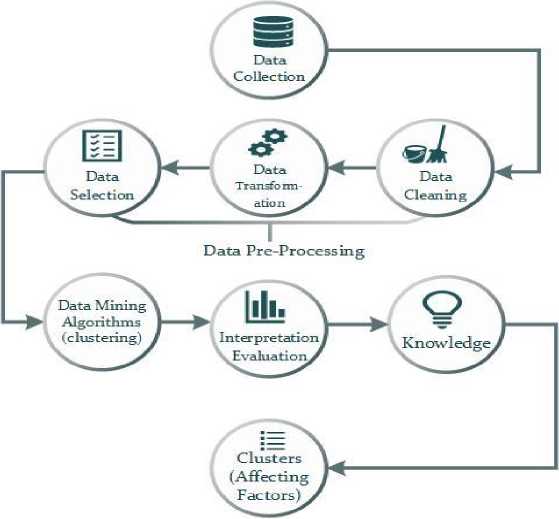
Fig.1. Students' academic performance analysis processes
Fig.1. shows the involved steps of the methodology, which consists of eight parts, each, part describing one of the stages so that the outputs of each stage are the inputs for the next stage, starting from obtaining the data until generating the results and evaluating them.
-
3.1. Data collection
-
3.2. Data Preprocessing
The student-related dataset was collected through an online questionnaire using Google Forms. It was published to Qassim University students anonymously and without any bias. The initial size of the dataset is 1,143 records. Table 1. lists the attributes of the data and their possible values.
Table 1. The Attributes of the Data and their Possible Values
|
No. |
Attribute |
Possible Values |
|
1 |
Gender |
Male, Female |
|
2 |
Family Size |
Small, medium, Big |
|
3 |
Average Income of Family (INCOME) |
Low, medium, High |
|
4 |
Parents marital status (PARSTATUS) |
Married, Divorced, Widowed |
|
5 |
Father’s education ( FQUAL) |
No Education, General Education, Graduate, Post Graduate |
|
6 |
Mother’s education (MQUAL) |
No Education, General Education, Graduate, Post Graduate |
|
7 |
Father’s Occupation (FOCS) |
Service, Retired, Business, N/A |
|
8 |
Mother’s Occupation ( MOCS) |
Service, Retired, Housewife, Others |
|
9 |
Number of friends (FRIENDS) |
One, Average (2-5), High (> 5), None |
|
10 |
Number of hours spent with friends per week ( WEEKHOUR) |
Limited (1-2 hours), Average (3-10 hours), High (>10 hours), None |
|
11 |
High school percentage (HSP) |
A=(90% to 100%), B=(80% to 89.9%), C= (70% to 79.9%), D=(60% to 69.9%) |
|
12 |
Teaching Language |
English, Arabic |
|
13 |
Transport |
Private car, Sharing car, University bus |
|
14 |
Academic year (Status) |
Freshman, Sophomore, Junior, Senior |
|
15 |
GPA |
Excellent, Good, Pass |
After the data were collected, the data cleaning process was done to handle missing or incomplete data. The cleaned data was normalized, where the nominal values of attributes were transformed into a numeric type.
All attributes were selected except Status, Teaching language, and Gender. These were ignored, as they are irrelevant for student performance analysis. In order to make the obtained dataset is clear and understood. The data is explored in a statistical manner. This is a fundamental step in DM since it eases understanding the data before transfer into implementing DM techniques. Table 2 shows the summary statistics of the dataset.
Table 2. The Summary Statistics of the Dataset
|
No. |
Attribute |
High |
Low |
|
1 |
Gender |
Female = 1016 |
Male =127 |
|
2 |
Family Size |
Big family = 727 |
Small Family=50 |
|
3 |
Average Income of Family |
High = 666 |
Low = 131 |
|
4 |
Parents marital status |
Married =581 |
Divorced =45 |
|
5 |
Father’s education |
General Education = 438 |
Post Graduate = 106 |
|
6 |
Mother’s education |
General Education = 410 |
Post Graduate = 26 |
|
7 |
Father’s Occupation |
Retired =517 |
N\A=52 |
|
8 |
Mother’s Occupation |
Housewife =726 |
Others =43 |
|
9 |
Number of friends |
High =630 |
One=67 |
|
10 |
Number of hours spent with friends per week |
Limited=424 |
High=80 |
|
11 |
High school percentage |
A= 642 |
D =22 |
|
12 |
Teaching Language |
Arabic=781 |
English=362 |
|
13 |
Transport |
Private car=678 |
University bus =145 |
|
14 |
Academic year (Status) |
Senior = 378 |
Freshman =245 |
|
15 |
GPA |
Good = 593 |
Pass= 120 |
-
3.3. Experimental Setup
-
A. Tools Used and Techniques
The Rapid Miner tool as a data science framework was used. It provides interesting visualization for resulting models. The work area has several easy tools for supporting build, execute, evaluate and visualize the models. Clustering is considered as unsupervised learning and a DM technique that involves the grouping of data points into a specific group: a collection of data objects in the same cluster, which is similar to each other but dissimilar to objects in other clusters. In this paper, we applied K-means and X-means clustering algorithms in our dataset to analyze the academic performance of students by grouping student data based on their attributes.
-
• K-means Clustering: K-means is a commonly used clustering algorithm. It works by segregate n existing objects into k partitions (k ≤ n) to represent as a cluster so that object values in each cluster are more similar to one another than objects in different clusters. In K-means clustering, every cluster is represented by its centroid, which is calculated as the mean value of the data in that cluster [34]. The basic K-means algorithm is consisting of the following steps:
Step 1: Identify the number of clusters k.
Step 2: Select k data points randomly from the data set as initial centroids.
Step 3: Assign each instance to the group that has the nearest centroid (based on minimum distance).
Step 4: Recalculate the centroid of each cluster.
Step 5: Repeat until the center does not change.
-
• X-means Clustering: X-means clustering is a modification of K-means clustering that deals with cluster allocations by repetitively attempting partition and trying to keep the optimal resultant segments. The steps of using the X-means clustering are same as the steps of K-means Clustering.
-
B. Data Clustering
In our dataset, the instances can be grouped when there exists a robust relationship between the attributes.
The significant issue that faces the clustering process is determining the value of k that is the number of centres in each group of data. In other words, k represents the number of data groups. Thus, the accuracy and performance of the clustering technique depended on the value of k [35]. In this paper, the Elbow algorithm was used for defining the optimal value of k.
-
a. Elbow Algorithm
Elbow is a heuristic method designed to help to determine the optimal number of clusters (k) for K-means algorithms. It predicts the value of the best (k) depends on the percentage of the diversion, which explained as a method of the number of clusters. This percentage planned with k. At a specific point, the bordering gain will be decreasing radically. This decreasing will be illustrated as an angle in the graph. At this point, the value of k is selected as the best.
The idea of implementing the Elbow is to initiate a loop with k = 2 and is incremented by one in each loop. In each loop, the number of clusters and the cost that gains are calculated. While increasing the value of k, the cost will be decreased dramatically at a point. This point considers producing the optimal value of k. The Elbow Algorithm details included [36]. We conducted the experiments for the above Elbow algorithm for K-means in our dataset using R studio. Fig.2 shows that the optimal value of k related to the Elbow algorithm is 3 after trying k = 2 to k–max = 10.
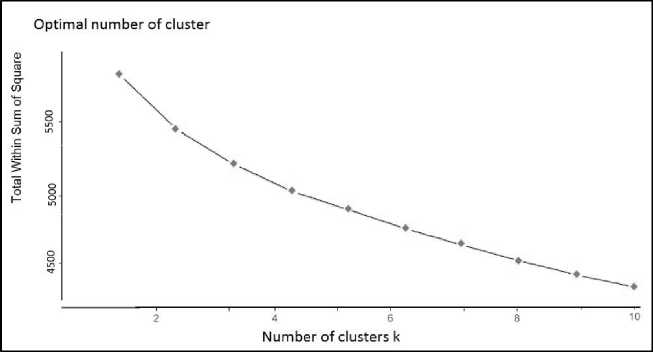
Fig.2. Elbow graph for student performance dataset
b. K-Means and X-Means Clustering
4. Results Analysis and Discussion
The two clustering experiments conducted were K-means with a number of clusters set to three as an optimal number of k related to Elbow Algorithm and X-means, as shown in Fig.3. These algorithms were performed on the student’s data, which consist of social and personal information.
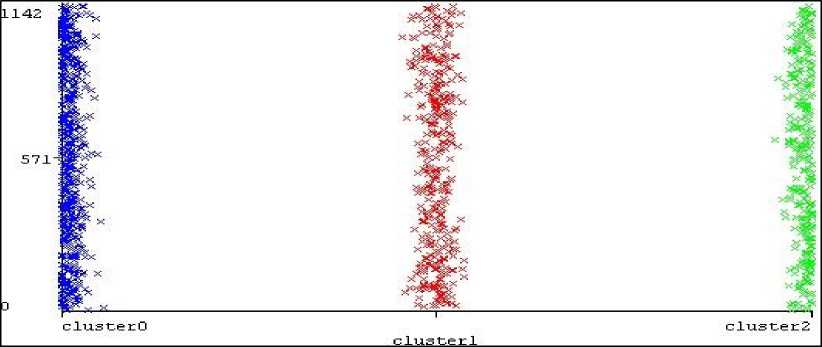
Fig.3. K-means clusters
The two algorithms were able to isolate the data instances into three clusters based on the relation between these attributes as described in Fig.3.
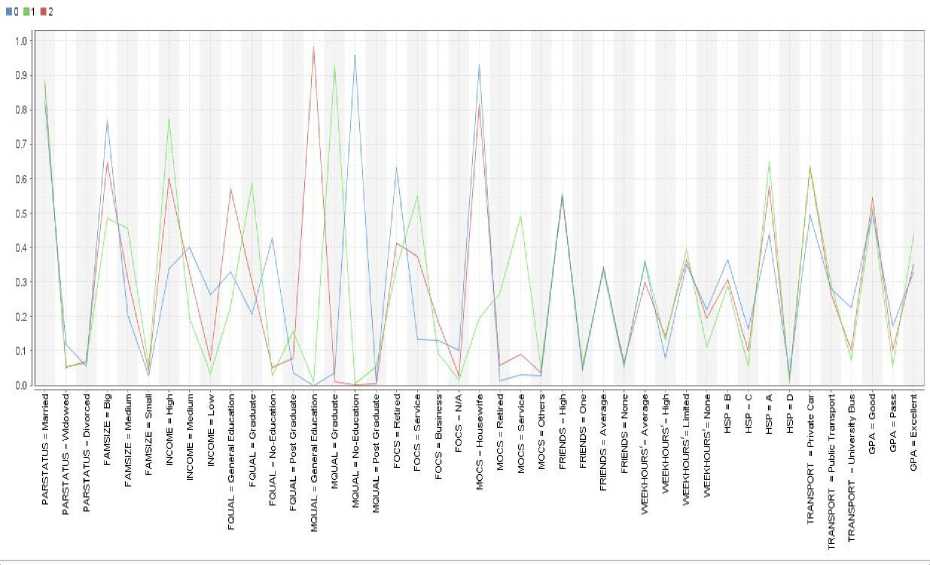
Fig.4. K-means visualization results
After applying the K-means algorithm with a number of clusters set to three as an optimal number of K-related to Elbow algorithm. Fig. 4. shows the result of K-means with the attribute values associated with each cluster. Table 3 illustrates the result of the overall performance of the K-means algorithm and the performance of each cluster after applying average within-cluster distance measure. The contents of Tables 3, 4, 5 are representing the outputs of applying the K-means algorithm on the dataset.
Table 3. Performance of K-means
|
Performance Vector |
|
|
Average within centroid distance |
0.138 |
|
Average within centroid distance_cluster_0 |
0.144 |
|
Average within centroid distance_cluster_1 |
0.135 |
|
Average within centroid distance_cluster_2 |
0.137 |
The result of applying the K-means algorithm on student’s dataset showed that cluster 2 obtained 413 instances whereas cluster 0 and cluster 1 were 335 and 395 respectively. The number of instances with attribute values of attribute GPA in each cluster with their percentages are detailed in Table 4. The overall percentage for each attribute value in each cluster is evaluated by applying the deterministic model in equation (1).
Р = ^ х 100 (1)
Where P is the percentage results, N is the number of instances with the selected attributes value, and S is the size of the cluster. As shown in Table 4 the highest number of students with the “Pass” performance was in cluster 0 with 57. Cluster 1 obtained the highest number of students with the “Excellent” performance among other clusters which is 177 while, and most students with “Good” performance were in cluster 2 which was 225.
The result of applying the K-means algorithm also showed that the attribute values with the highest number of instances in the three clusters for each attribute as detailed in Table 5. The same table illustrates the percentage of the attribute value frequency for all attributes based on the size of the cluster. In addition, it presents the total percentage of each attribute value that was calculated by applying equation (1).
Table 4. Distribution of students’ performance by K-means algorithm
|
Number of clusters |
Size of cluster |
Excellent performance |
Good performance |
Pass performance |
|
Cluster 2 |
413 |
146 35.3% |
225 54.4% |
42 10.16% |
|
Cluster 0 |
335 |
111 33.13% |
167 49.8% |
57 17% |
|
Cluster1 |
395 |
177 44.81% |
201 50.8% |
21 5.3% |
From Table 5, it can be seen that the majority of students that fall under cluster 0 obtained the value of attributes of HSP = “A”, Transport = “private car”, MOCS = “Housewife”, FOCS= “Retired”, FQUAL = “No education”, MQUAL = “No education”, INCOME = “Medium”, FAMSIZE = “Big”, PARSTATUS = “Married”, WEEKHOURS = “Average” and FRIENDS = “High”. Most students in cluster 1 came with attributes values of HSP = “A”,
Table 5. K-means cluster data analysis
|
Number of clusters |
K-means Cluster Analysis |
||||||||||
|
HSP |
TRANSP ORT |
MOCS |
FOCS |
FQUAL |
MQUAL |
Inco me |
Famil y Size |
PARST ATUS |
WEEKH OURS |
FRIEN DS |
|
|
Cluster 0 |
A 43.8% |
Private car 49.55% |
Housewife 93.13% |
Retired 63.2% |
No education 42.68% |
No education 95.82% |
Medi um 40% |
Big 77% |
Married 82.6% |
Average 36.7% |
High 55.5% |
|
Cluster 1 |
A 65.5% |
Private car 66.54% |
Service 51.2% |
Service 54.93 % |
Graduated 78.3% |
Graduate d 90.37% |
High 77.21 % |
Big 48.60% |
Married 88.3% |
Limited 39.4% |
High 55.4% |
|
Cluster 2 |
A 57.62% |
Private car 63.1% |
Housewife 81.59% |
Retired 41.16 % |
General education 57.14% |
General education 98.3% |
High 60% |
Big 64.6% |
Married 87.8% |
Limited 36.5% |
High 54.4% |
Transport = “private car”, MOCS = “service”, FOCS = “service”, FQUAL = “graduate”, MQUAL = “graduate”, INCOME = “high”, FAMSIZE = “Big”, PARSTATUS = “Married”, WEEKHOURS = “Limited” and FRIENDS = “High”. The value of attributes in cluster 2 were HSP = “A”, Transport = “private car”, MOCS = “Housewife”, FOCS = “Retired”, FQUAL= “General education”, MQUAL = “General education”, INCOME = “high”, FAMSIZE = “Big”, PARSTATUS = “Married”, WEEKHOURS = “Limited” and FRIENDS = “High”.
It can be easily observed that HSP attribute with "A", Transport attribute with "private car", Family Size with "Big", PARSTATUS with "married" and friends with "high" have an unnoticeable effect on all clusters. The percentage of the attribute value of "Married" and "High" from PARSTATUS and Friends respectively, it almost similar in all clusters.
It was approximately 80% of PARSTATUS and 55% of friends. Whereas the attribute values of "A", "private car" and "Big" from HSP, transport and Family Size respectively had various percentage values. They were between 43.8% and 65.5% in HSP, between 49% and 66% in TRANSPORT and between 48 % and 77 % in Family Size. On the other hand, all clusters have influenced by the attributes of MOCS, FOCS, FQUAL, MQUAL, Income, and WEEKHOURS. The attribute value of "Housewife" from MOCS had an influence on cluster 0 and cluster 2 whereas "service" attribute value affected on cluster 1. From FOCS the attribute value of "Retired" has affected cluster 0 and cluster 2 while cluster 1 was affected by "Service" value. FQUAL and MQUAL have the same influence on all clusters with an attribute value of "no education" in cluster 0, "graduated" in cluster1 and "General Education" in cluster2. In addition, Cluster 0 was affected by "Medium" from the attribute of income whereas cluster 1 and cluster 2 have influenced by "high" value. Finally, the attribute value of "average" from WEEK HOURS has influenced cluster 0 while cluster 1 and cluster 2 were affected by the attribute value of "Limited".
Table 6. Performance of X-means
|
Performance Vector |
|
|
Average within centroid distance |
0.138 |
|
Average within centroid distance_cluster_0 |
0.136 |
|
Average within centroid distance_cluster_1 |
0.143 |
|
Average within centroid distance_cluster_2 |
0.136 |
Fig 5. illustrates the X-means visualization result with the value of attributes in the three obtained clusters. Table 6 illustrates the overall performance of the X-means algorithm and the performance of each cluster by applying Average within cluster distance measure. After applying the X-means algorithm on student’s dataset, the result showed that cluster 0 obtained 425 instances whereas cluster 1 and cluster 2 were 335 and 383 respectively.
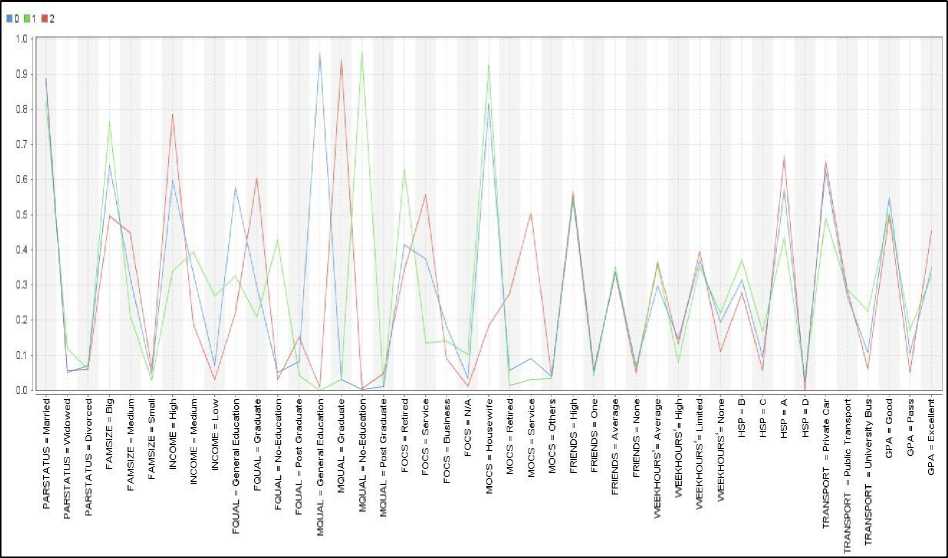
Fig.5. X-means visualization results
The number of instances with attribute values of attribute GPA in each cluster with their percentages are detailed in Table 7. The overall percentage for each attribute value in each cluster is evaluated by applying the deterministic model in equation (1). As shown in Table 7. The highest number of students with the “Pass” performance was in cluster 1 with 57. Cluster 2 obtained the highest number of students with the “Excellent” performance among other clusters which is 173 while, and most students with “Good” performance were in cluster 0 which was 233.
Table 7. Distributions of student’s performance by the X-means algorithm
|
Number of clusters |
Size of cluster |
Excellent performance |
Good performance |
Pass performance |
|
Cluster 0 |
425 |
148 34.82% |
233 54.8% |
44 10.3% |
|
Cluster 1 |
335 |
109 32.53% |
169 50.44% |
57 22.38% |
|
Cluster 2 |
383 |
173 45.16% |
191 49.8% |
19 4.9% |
The result of applying the X-means algorithm also showed that the attribute values with the highest number of instances in the three clusters for each attribute as detailed in Table 8. The same table illustrates the percentage of the attribute value frequency for all attributes based on the size of the cluster. In addition, it presents the total percentage of each attribute value that was calculated by applying equation (1).
Table 8. X-means cluster data analysis
|
Number of clusters |
X-means Cluster Analysis |
||||||||||
|
HSP |
TRANSP ORT |
MOCS |
FOCS |
FQUAL |
MQUAL |
Income |
Family Size |
PAR STATUS |
WEEK HOURS |
FRIE NDS |
|
|
Cluster 0 |
A 56.94 % |
Private care 62.35% |
Housewife 81.41% |
Retired 41.41% |
General education 57.64% |
General education 95.76% |
High 59.52 % |
Big 63.76 % |
Married 88% |
Limited 36.7% |
High 43.2% |
|
Cluster 1 |
A 43.2% |
Private care 48.9% |
Housewife 92.53% |
Retired 59.49% |
No education 42.68% |
No education 95.82% |
Mediu m 39.4% |
Big 76.41 % |
Married 82.08% |
Average 35.5% |
High 64.4% |
|
Cluster 2 |
A 66.57 % |
Private care 65% |
Service 50.39% |
Service 55.61% |
Graduate d 60.31% |
Graduate d 93.99% |
High 78.32 % |
Big 49.60 % |
Married 88.7% |
Limited 39.4% |
High 60.05 % |
From Table 8. It can be seen that most of students in cluster 0 came with attributes values of HSP = “A”, Transport = “private car”, MOCS = “Housewife”, FOCS = “Retired”, FQUAL = “General education”, MQUAL = “General education”, INCOME = “High”, FAMSIZE = “Big”, PARSTATUS = “Married”, WEEKHOURS = “Limited” and FRIENDS = “High”. The majority of students that fall under cluster 1 obtained the values of attributes of HSP = “A”, Transport = “private car”, MOCS = “Housewife”, FOCS = “Retired”, FQUAL = “No education”, MQUAL = “No education” INCOME = “Medium”, FAMSIZE = “Big”, PARSTATUS = “Married”, WEEKHOURS = “Average” and FRIENDS = “High”. The values of attributes in cluster 2 were HSP = “A”, Transport = “private car”, MOCS = “Service”, FOCS = “Service”, FQUAL= “Graduated”, MQUAL = “Graduated”, INCOME = “high”, FAMSIZE = “Big”, PARSTATUS = “Married”, WEEKHOURS = “Limited” and FRIENDS = “High”. It can be simply seen that HSP attribute with "A", Transport attribute with "private car", Family Size is "Big", PARSTATUS with "married" and friends with "high" have not obvious effect on all clusters. The percentage of the attribute value of "Married" from PARSTATUS was almost similar in all clusters. It was around 80% of PARSTATUS. Whereas the attribute values of "A", "private car", "Big" and “High” from HSP, transport, Family Size and FRIENDS respectively had different percentage values. They were between 43.2% to 66% in HSP, between 48% to 65% in TRANSPORT, between 49 % and 76 % in Family Size and between 43.2 % to 64% in FRIENDS. Differently, all clusters have affected by the attributes of MOCS, FOCS, FQUAL, MQUAL, Income, and WEEKHOURS. The attribute value of "service" from MOCS had an influence on cluster 2 whereas "Housewife" attribute value affected on cluster 0 and cluster 1.
From FOCS the attribute value of "Retired" has affected cluster 0 and cluster 1 while cluster 2 was affected by "Service" value. FQUAL and MQUAL had the same effect on all clusters on the attribute values. The attribute value of "General Education" had an effect on cluster 0, "graduated" in cluster 2 and "no education" in cluster 1. Moreover, Cluster 1 was affected by the value of "Medium" from the attribute of income while cluster 0 and cluster 2 have influenced by the value of "high". Lastly, the attribute value of "average" from WEEKHOURS has influenced cluster 1 while cluster 0 and cluster 2 were affected by the attribute value of "Limited".
5. Conclusions
Extraction of high-level knowledge from educational datasets became an uncomplicated process due to DM techniques. In this study, data based on some selected input variables were collected through questionnaire method. After that, some of the most affecting factors on student performance were identified. Then K-means and X-means algorithms with a number of clusters set to three as determined by the Elbow method were applied to analyze the performance of students.
The results of this paper indicated that both algorithms show the same significant relation between student grade point average (GPA) with other attributes. To confirm the validity of the obtained results, two clustering algorithms were used which gave an equal performance value of 0.138. This refers to the potential efficiency of both algorithms; the use of either one of them will yield the same result. The research finding s after applying the two algorithms fo rebmun eht dna etar emocni ,snoitacifilauq ’reveal that parents’ occupation, parents hours spent with friends per week play a significant role in the student’s performance. On the other hand, it concluded that high school percentage, family size, transport types, parents’ status, and the number of friends are not influential factors.
As a result, having the information generated through the experiment, it seems to us that data mining gives a potential for education to predict and analyze student performance, in turn, developing education strategies and serving the community. The advance of this work is achieved by relying on non-sensitive, measurable factors that have a direct impact on student performance. The obtained results are more accurate due to applying two algorithms that provided the same factors. For future work, we intend to expand the experiments to collect additional features like motivational efforts taken by the teachers toward students to get more accurate results and improve the students learning outcomes.
References Data Mining Methods for Detecting the Most Significant Factors Affecting Students’ Performance
- A. Dutt, “Clustering Algorithms Applied in Educational Data Mining,” Int. J. Inf. Electron. Eng., 2015.
- A. Dutt, M. A. Ismail, and T. Herawan, “A Systematic Review on Educational Data Mining,” IEEE Access, vol. 5. Institute of Electrical and Electronics Engineers Inc., pp. 15991–16005, 2017.
- G. Javidi, L. Rajabion, and E. Sheybani, “Educational Data Mining and Learning Analytics: Overview of Benefits and Challenges,” in Proceedings - 2017 International Conference on Computational Science and Computational Intelligence, CSCI 2017, 2018, pp. 1102–1107.
- A. Abu Saa, M. Al-Emran, and K. Shaalan, “Factors Affecting Students’ Performance in Higher Education: A Systematic Review of Predictive Data Mining Techniques,” Technol. Knowl. Learn., 2019.
- A. Badr El Din Ahmed and I. Sayed Elaraby, “Data Mining: A prediction for Student’s Performance Using Classification Method,” World J. Comput. Appl. Technol., vol. 2, no. 2, pp. 43–47, 2014.
- J. J. Manoharan, S. H. Ganesh, M. L. P. Felciah, and A. K. S. Banu, “Discovering students’ academic performance based on GPA using K-means clustering algorithm,” in Proceedings - 2014 World Congress on Computing and Communication Technologies, WCCCT 2014, pp. 200–202.
- R. Asif, A. Merceron, S. A. Ali, and N. G. Haider, “Analyzing undergraduate students’ performance using educational data mining,” Comput. Educ., vol. 113, pp. 177–194, Oct. 2017.
- D. Aggarwal and D. Sharma “Application of Clustering for Student Result Analysis", vol. 7, Apr. 2019.
- J. Kong, J. Han, J. Ding, H. Xia, and X. Han, “Analysis of students’ learning and psychological features by contrast frequent patterns mining on academic performance,” Neural Computing and Applications, Springer London, 2018.
- M. Durairaj and C. Vijitha, “Educational Data mining for Prediction of Student Performance Using Clustering Algorithms,” 2014.
- A. M. Dahie, A. Abdi, M. (Alleges, A. Abshir, and W. (Suldan, “Factors Affecting Student Academic Performance: Case Study from the University of Somalia in Mogadishu-Somalia,” IOSR J. Humanit. Soc. Sci. (IOSR-JHSS, vol. 23, no. 3, pp. 73–80, 2018.
- A. Abu, “Educational Data Mining & Students’ Performance Prediction,” Int. J. Adv. Comput. Sci. Appl., vol. 7, no. 5, 2016.
- M. Ilic, P. Spalevic, M. Veinovic, and W. Saed Alatresh, “Students’ success prediction using Weka tool,” 2016.
- S. Syahira, A. Tarmizi, S. Mutalib, N. Hamimah, A. Hamid, and S. A. Rahman, “Modern Education and Computer Science,” Mod. Educ. Comput. Sci., vol. 8, pp. 1–14, 2019.
- V. Mhetre and M. Nagar, “Classification based data mining algorithms to predict slow, average and fast learners in educational system using WEKA,” in Proceedings of the International Conference on Computing Methodologies and Communication, ICCMC 2017, 2018.
- K. Govindasamy and T. Velmurugan, “Analysis of Student Academic Performance Using Clustering Techniques.” (2018).
- S. Kadiyala and C. Srinivas Potluri, “Analyzing the Student’s Academic Performance by using Clustering Methods in Data Mining,” 2014
- O. Tokunbo Olufemi, A. Adekunle Adediran, and W. Oyediran, “factors affecting students’ academic performance in colleges of education in southwest, nigeria,” 2018.
- A. R. Chordiya and S. B. Bagal, "Comparative Research of Clustering Algorithms for Prediction of Academic Performance of Students." Int. J. Eng. Res. Technol 4.1 (2015): 243-246.
- F. J. Kaunang and R. Rotikan, "Students' Academic Performance Prediction using Data Mining," 2018 Third International Conference on Informatics and Computing (ICIC), Palembang, Indonesia, 2018, pp. 1-5, doi: 10.1109/IAC.2018.8780547.
- K. Sya’iyah, H. Yuliansyah, and I. Arfiani, “Clustering Student Data Based On K-Means Algorithms,” Int. J. Sci. Technol. Res., vol. 8, p. 8, 2019.
- T. Devasia, T. P. Vinushree, and V. Hegde,” Prediction of students performance using Educational Data Mining,” in Proceedings of 2016 International Conference on Data Mining and Advanced Computing, SAPIENCE 2016, 2016.
- Confluence Veranstaltung 6. 2016 Noida et al., Proceedings of the 2016 6th International Conference Cloud System and Big Data Engineering (Confluence) 14 -15 January 2016, Amity University, Uttar Pradesh, Noida, India. IEEE, 2016.
- S. J. S. Alawi, I. N. M. Shaharanee, and J. M. Jamil, “Profiling Oman education data using data mining approach,” in AIP Conference Proceedings, 2017, vol. 1891.
- M. Durairaj and C. Vijitha,“Educational Data mining for Prediction of Student Performance Using Clustering Algorithms.” (2014).
- S. Y. Chen and X. Liu, “The contribution of data mining to information science,” J. Inf. Sci., vol. 30, no. 6, pp. 550–558, 2004.
- A. Aghababyan, N. Lewkow, and R. S. Baker, (2018) Enhancing the Clustering of Student Performance Using the Variation in Confidence. In: Nkambou R., Azevedo R., Vassileva J. (eds) Intelligent Tutoring Systems. ITS 2018. Lecture Notes in Computer Science, vol 10858. Springer, Cham. https://doi.org/10.1007/978-3-319-91464-0_27
- R. S. Yadav, “Application of hybrid clustering methods for student performance evaluation,” Int. J. Inf. Technol., Apr. 2018.
- A. M. de Morais, J. M. F. R. Araújo and E. B. Costa, “Monitoring Student Performance Using Data Clustering and Predictive Modelling,” FIE : 2014 IEEE Frontiers in Education Conference : proceedings : 22-25 October 2014.
- P. V. R. Periyasamy, and V. Sugasini, “Analysis of Student Result Using Clustering Techniques.” (2014).
- M. Tabrez Nafis and S. Taha Owais, “Students Academic Performance Using Partitioning Clustering Algorithms,” Int. J. Adv. Res. Comput. Sci., vol. 8, no. 5.
- P. Naik, R. Shaikh, O. Diukar, S. Dessai, and P. S. B. Project Guide], “Predicting Student Performance Based On Clustering and Classification,” IOSR J. Comput. Eng., vol. 19, no. 03, pp. 49–52, Jun. 2017.
- A. Mueen, B. Zafar, and U. Manzoor, “Modeling and Predicting Students’ Academic Performance Using Data Mining Techniques,” Int. J. Mod. Educ. Comput. Sci., vol. 8, no. 11, pp. 36–42, Nov. 2016.
- S. Lailiyah, E. Yulsilviana, and R. Andrea, “Clustering analysis of learning style on anggana high school student,” TELKOMNIKA (Telecommunication Comput. Electron. Control., vol. 17, no. 3, p. 1409, Jun. 2019.
- N.Valarmathy and S.Krishnaveni “Performance Evaluation and Comparison of Clustering Algorithms used in Educational Data Mining.” vol. 7, Apr. 2019.
- P. Bholowalia and A. Kumar, “EBK-Means: A Clustering Technique based on Elbow Method and K-Means in WSN,” 2014.
