Determination of representativity for Bangla vowel perceptual space
Автор: Md. Mahbub Hasan, Sathi Rani Mitra
Журнал: International Journal of Information Technology and Computer Science @ijitcs
Статья в выпуске: 3 Vol. 10, 2018 года.
Бесплатный доступ
In this article, representativity between two multidimensional acoustical spaces of vowel has been formulated based on the geometric mean of correlation of average directional vector, variance-covariance matrices, and Mahalanobis distance. Generally, the multidimensional spaces formed by different combinations of acoustical features of vowel are considered as the vowel perceptual spaces. Therefore, ten bangla vowel-sounds (/অ/ [/a/], /আ/ [/ã/], / ই/ [/i/] , /ঈ/ [/ĩ/], /উ/ [/u/], / ঊ/ /ũ/, /এ/ [/e/], /ঐ/ [/ai/] , /ও/ [/o/] and /ঔ/ [/au/]) are collected from each native Bengali speaker to build the perceptual space of the speaker using the acoustical features of vowels. Similarly, total nine perceptual spaces are constructed from nine speakers and these are utilized to evaluate representativity. Using the proposed method, representativities of differently constructed perceptual spaces have been evaluated and compared numerically. Furthermore, dominating and representative acoustical features are also identified from the principal components of the perceptual spaces.
Representativity, Average directional vector, Formant frequency, Variance-covariance matrices, Mahalanobis distance, Eigen-value and Eigenvector
Короткий адрес: https://sciup.org/15016246
IDR: 15016246 | DOI: 10.5815/ijitcs.2018.03.07
Текст научной статьи Determination of representativity for Bangla vowel perceptual space
Published Online March 2018 in MECS
Vowel sound is produced from glottal pulse modulated by quasi-stationary vocal-tract and dynamic modulation of vocal-tract around its quasi-stationary shape extends the acoustic features from vowel to generate consonantal sounds [1, 2]. In consequence of dynamic modulation, information is injected to the speech. As the vowels are supporting the information content consonants, vowels are considered as the crankshaft of language. For these reasons, a lot of researches have been conducted on vowel perception and these have given rise to new conceptions of perception as mapping of acoustic features with auditory cortex [3, 4]. In auditory cortex, receptive fields are defined as cortical circuits involving small clusters of neurons ordered topographically according to the tuning characteristics of cochlea and the clustered neurons as well as cortical circuit becoming active with specific acoustic features. But, the acoustical features of vowels consist not only specific linguistic information but also perturbed acoustical features which are generated during vowel production due to the differences of vocaltract size, shape and physical conditions of speakers [5, 6]. Moreover, the environmental noises also contaminate the acoustical features of vowels. Despite these perturbed acoustical features, human auditory system can recognize the vowel perfectly as human auditory system has an elegant neural network to accurately detect the right acoustical features from the perturbed acoustical features [7, 8]. Due to the excellent recognition features of human auditory system, researchers are trying to design human auditory inspired robust speech recognition system [9, 10]. But, the invariant or representative acoustical features which activate the specific cortical circuit are still unknown [11]. Beside auditory model of vowel perception, vowel recognition for different languages are still improving by different non-auditory based techniques [12, 13, 14, 15]. Among these techniques, determination of representative acoustical features of vowels and using these in perception purpose is a better technique as it can identify the key acoustical features of perception [15, 16, 17, 18]. So, in both auditory and non-auditory models based speech perception, the representative acoustical features of vowel are important and a number of researches have already been conducted for searching the representative acoustical features for vowel perception [14, 19, 20, 21, 22, 23].
According to the article [19], fundamental frequency (f ) and first three formant frequencies (F1,F2,F3) contain sufficient information for vowel perception. In another report, Walden and his group proposed fundamental frequency (f ), age, and voice-quality based vowel perceptual space to evaluate the similarity of male and female voices [20]. Beside the above mentioned acoustical features, jitter and shimmer are also considered as perceptual space members with fundamental (f ) and formant frequencies (F) by Kreiman et. al. in [21]. As formant dispersions or transitions affect on vowel perception process, these are also included in perceptual space in reports [22, 23]. In 2013, Lopez et. al. reported twelve-dimensional acoustic vector (V = jitter, shimmer, f0,Fi(1 < i < 5), D(F5 — F1),D(F4 —F3),D(F5—F3),D(F5 —F4)) for speech similarity determination [14]. Here, “D” refers dispersion of formant frequencies and the vector is frequently called “multidimensional acoustical vector”. So, the above mentioned vowel perceptual spaces are formed by different combinations of acoustical features and representativities of these should be evaluated numerically with an appropriate method to identify the prominent acoustical features. However, representativity is well described with the direction of data sets, variancecovariance matrices and the distance between data sets centroids in article [24]. So, determination of representativity of vowel perceptual space considering these three factors will be an interesting report in psychoacoustic research community. In this articles, we will determine and compare the representativities of different Bangla vowel perceptual spaces as Bangla is the seventh spoken language in the world with 215 million speakers [25].
The rest of the article is organized as follows: in section II, related works have been discussed. The representativity of vowel perceptual spaces have been modeled with principal components and shown in section III. Bangla vowel-sounds collection process is described in section IV. Representativity of Bangla vowel perceptual space is evaluated numerically in Section V. Finally, in section VI, important points are summarized.
-
II. Related Works
For evaluating representativity of vowel perceptual space, synthesized vowels are presented to listeners and their categorized response are utilized to develop formant based likelihood function which is considered as a representative scale [16]. Comparing to synthesized vowels, representative model of natural vowels are more complicated as these consist of perturbed acoustical features and noises. Based on the natural vowels, representativities of first and second formant based perceptual spaces have been reported for English, German, Dutch, French, and Spanish languages in the articles [15, 16, 17, 18] and these reports mainly used probability density function as a performance evaluating scale. Probability density function or likelihood function is a member of representivity of multidimensional data sets, but except these, other members such as direction of data sets, variance-covariance matrices and the distance between data sets centroids are better representativity measuring scales. Although these three factors can describe representativity more accurately, but to the best of our knowledge, the representativity of perceptual space considering these has not been reported yet.
-
III. Mathematical Model of Perceptual Space Representativity
Vowel perceptual vectors are the multidimensional variables which represent vowels in recognizable form and matrix formed by tabulating these vectors defines vowel perceptual space. For the rest of the article, V is used to represent vowel perception space which mainly contains linguistic information vexed by perturbed acoustical features. For eliminating these perturbed features representativity is used as it indicates the linguistic information of vowel. Among three representativity measuring scales, correlation of average directional vector (ADV) has been formulated as
P =| d1Td2 | d12d22
where, P is the correlation coefficient of ADV, d and d are ADVs which are defined as a weighted sum of the eigenvectors and the weights are the associated eigenvalues as
q d = ∑uiλi i=0
where µ , λ and q are eigenvector, eigen-value and the number of principal components (PCs) are considered respectively. However, the mathematical relation of the eigen-value and eigenvector can be written as Ru = λ u ; where R is the covariance matrix which is defined as R = E [ VTV ] and T and E refers transpose and expected operators. Like the correlation of ADV, comparison of variance-covariance matrices is the second scale of representativity which is defined in article [24] as
C = exp(
- M 2( n - 1))
where
M =[1 - 2 q 2+3 q -1 3 ]( n - 1)[ln| S 1- 1 S | + ln| S 2- 1 S |]
6( q + 1) 2( n - 1)
S + S
S = is pooled variance - covariance matrix
S , S are variance - covariance matrices for two perceptual spaces n is the number of acoustical features in perceptual spaces
Centroids-similarity evalutating statistics, Mahalanobis distance has been included as third representativity measuring scale in this article and the mathematical definition of the scale, M is [24]
M = 1 - D ,if D 2 ≤ D 2
D c2rit crit
M =0,if D2 > Dc2rit where, D and D are Mahalanobis distance and critical Mahalanobis distance respectively. The Mahalanobis distance is calulated by the following:
D 2 =( V 1 - V 2 ) TS - 1 ( V 1 - V 2 )
where, V , V are mean column vectors of the two perceptual spaces. Another term in (4) is critical Mahalanobis distance which is defined as
2 D crit
4 Fqn ( n - 1) n 2 (2 n - q - 1)
where F is the F-distriution value for 95% samples with q and (2 n - q - 1) degree of freedom. Therefore, the representativity between two vowel perceptual spaces is formulated by the geometric mean of the statistics P , C and M as
R = 3 PCM (7)
-
IV. Bangla Vowel Sound Collection
Ten Bangla vowel-sounds (/ অ / [/a/], / আ / [/ã/], / ই / [/i/], / W / [ZiZ], Z ^ Z [/u/], / ^ / /и/, / 4 / [/e/], Z ^ Z [/ai/] , N [/o/] and / ঔ / [/au/]) are utilized to form Bangla vowel perceptual space. Vowel-sounds are collected from nine male students (age 22-27 years) of Khulna University of Engineering & Technology (KUET), Khulna, Bangladesh and all are native Bengali speakers. Subjects were given as much time as need to prepare themselves to utter vowels. Ten vowel sounds were recorded from each speaker in noise-proof chamber located in Electrical and Electronic Engineering department, KUET. The experimental sound capturing process is shown in Fig. 1. Sensitive condenser type microphone, RODE NT2-A with Scarlett2i2 interface was used for recording the sounds at sampling rate 44100 Hz.
where, R is the representativity.
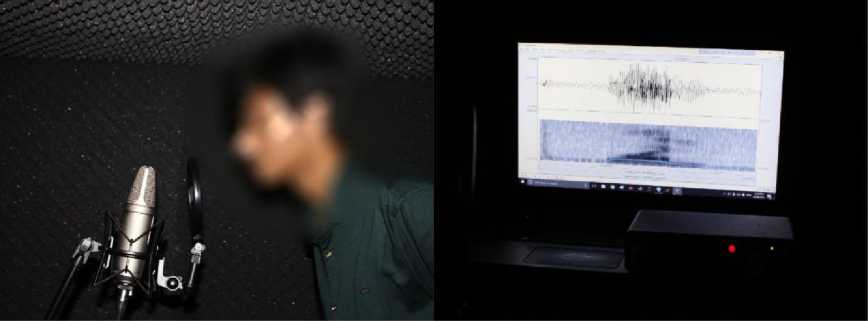
Fig.1. Experimental setup for Bangla vowel sound recording.
-
V. Experimental Observations of Consistency
0.025s. For each speaker, vowel perceptual spaces are formed using the mean value of the formant trajectories by the following two ways (model-I and -II):
Five formant trajectories of ten Bangla vowels are determined using Praat [26] script setting window length
For model-I
For model-II
Fig.2. Normalized eigen-value profiles for nine perceptual spaces.
|
F1w |
F2W |
F3^ |
F4 / , / |
F5 / ^ / |
||||
|
F1w |
F2 / W |
F3 / W |
F4 / ^ / |
F5 / ^ / |
||||
|
F1A / |
F2 / ^ / |
F3 / . / |
F4 / ^ / |
F5 / . / |
||||
|
F1 / W / |
F2 - |
F3 / # / |
F4 / # / |
F5 / # / |
||||
|
F1 / s / |
F2 |
F3 / ^ / |
F4 / ^ / |
F5 / ^ / |
||||
|
V = |
F1 / ^ / |
F2 / ^ / |
F3 / ^ / |
F4 / ^ / |
F5 / ^ / |
for |
model — I |
|
|
F1 / . / |
F2 / . / |
F3 / . / |
F4 / . / |
F5 / . / |
||||
|
F1 / ^ / |
F2 / . / |
F3 / . / |
F4 / ^ / |
F5 / . / |
||||
|
Fl |
F2 / . / |
F3 / . / |
FV / |
F5 / . / |
||||
|
F1 / ^ / |
F2 / ^ / |
F3 / ^ / |
F4 / ^ / |
F5 / ^ / |
||||
|
and for model — II |
(8) |
|||||||
|
F0^ |
F1 / , / |
F2 / , / |
F3 / ^ / |
F(F1) / , / |
S(F2) / , / |
|||
|
F0 / W |
F1 / ^ Z |
F2 / ^ / |
F3 /^-/ |
S(F1) / W |
S(F2) / W |
|||
|
F0 / . / |
21 ^ |
F2 / ^ / |
F3 / . / |
S(F1)^ / |
D(F2)^^ |
|||
|
F0 / # / |
21 ^ |
F2 / W / |
F3 / # / |
F(F1) / # / |
S(F2) / # / |
|||
|
F0 / ^ / |
21 |
F2 / ^ / |
F3 / ^ / |
S(F1) / ^ / |
S(F2) / ^ / |
|||
|
V = |
F0 / ^ / |
F1 / ^ / |
F2 / ^ / |
F3 / ^ / |
S(F1) / ^ / |
S(F2) / ^ / |
||
|
F0 / . / |
F1 / . / |
F2 / . / |
F3 / . / |
S(F1) / . / |
D(F2) / . / |
|||
|
F0 / ^ / |
F1 / ^ / |
F2 / . / |
F3 / ^ / |
S(F1) / ^ / |
S(F2) / ^ / |
|||
|
F0 / « / |
F1 / . / |
F2/ ^ / |
F3/ ^ / |
S(F1) / . / |
D(F2) / . / |
|||
|
F0 / » / |
F1 / » / |
F2 / ^ / |
F3 / ^ / |
S(F1) / ^ / |
S(F2) / ^ / |
|||
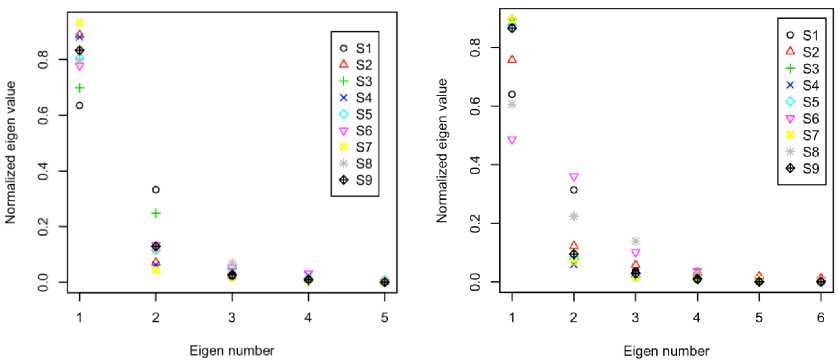
From the perceptual spaces defined in (8), eigen-values and eigenvectors of PCs are evaluated using "prcomp" function of statistical software R [27]. Also normalized eigen-values, µ of perceptual spaces for nine speakers are calculated as µi = λi/∑ λi and are shown in Fig. 2
for both models. Here, "S" refers the speaker and the number indicates speaker identity. Eigenvalue refers the amount of information occupied by the associate eigenvector or PC. Within the perceptual space, first PC contains maximum amount of infromation and the amount decrease gradually with increasing the order of PCs. The invariant part of nine perceptual spaces is multidimensional linguistic information which is perturbated by non-linguistic factors. For this reason, eigenvalue distributions are almost same and sometime indistinguishable. From Fig. 2, it is found that normalized first and second eigen-value ranges are 0.9334-0.6351 and 0.3326-0.04273 for model-I and 0.8970-0.4863 and 0.3603-0.0583 for model-II. So, comparing to model-I, linguistic information of model-II is distributed in more directions. Considering all nine perceptual spaces, average eigen-value profiles are also evaluated and tabulated in Table 1.
According to Table 1, first PC of model-I consists of 80.58% of average eigen-value of the vowel perceptual space and the first PC is sufficient to represent the perceptual space as the eigen-value limit is 80.00% for representing the multidimensional space [28]. For model-II, first PC is not sufficient to represent the perceptual space which consists of 76.81% of eigen-value; first two
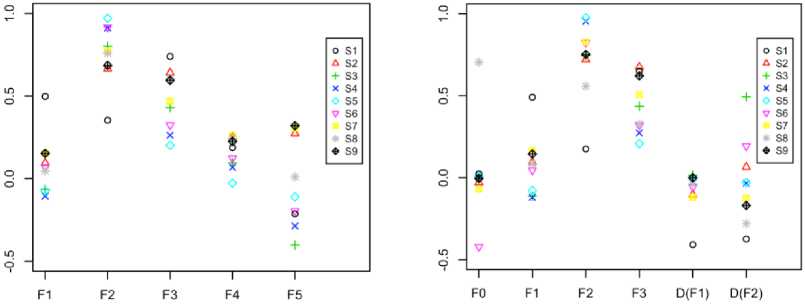
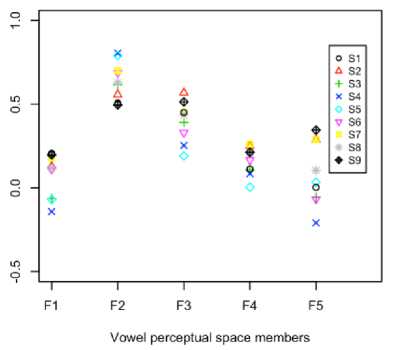
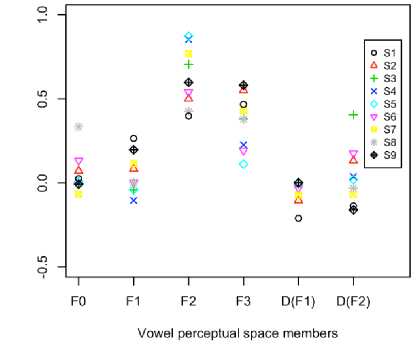
PCs are required to represent and their eigen-value summation is 92.24%. In addition to first eigen-values, first eigenvectors are also necessary as these reveal the contributions of perceptual space members in dominating first PCs. Then, first eigenvectors of nine perceptual spaces are also shown in Fig. 3 with respect to perceptual space members for both models. Like the eigenvalue distributions shown in Fig. 2, first eigenvector profiles are also overlap one another as the main component of the nine perceptual spaces is same linguistic information. Herein, the contributions of F 2 and F 3 are comparatively higher than others and the variances of F 2 and F 3 are 0.03415 and 0.03417 respectively for model-I and 0.05826 and 0.03066 for model-II. So, more consistency of the dominating perceptual member, F 2 is found in model-I comparing with -II. On the other hand, inconsistent contributions are found in F 5 and D ( F 2) . However, the contributions of F 0, F 1, F 4 and D ( F 1) are not significant in vowel perceptual space.
Table 1. Average normalized eigen-value profiles for both models.
|
Eigen number |
Normalized Eigen-value |
|
|
For model-I |
For model-II |
|
|
1 |
0.8058 |
0.7681 |
|
2 |
0.1392 |
0.1564 |
|
3 |
0.0379 |
0.0507 |
|
4 |
0.0136 |
0.0177 |
|
5 |
0.0033 |
.0043 |
|
6 |
—- |
.0025 |
Vowel perceptual space members
For model-II
Vowel perceptual space members
For model-I
Fig.3. First eigenvectors of nine vowel perceptual spaces.
Beside the first PC, the contributions of perceptual space members of second PCs are also evaluated and dispersive nature is found with respect to first PCs. Using first and second PCs, the ADVs are calculated according to (2) and shown in Fig. 4 which shows the dispersive members are present in model-II. In Fig. 4, it is also found that the contributions of F 2 and F 3 are prominent comparing with others. Furthermore, the dispersions of perceptual space members of first PC, second PC, and ADV are shown in Table 2 and the variance of first PC is always lower than the second PC. As the first PC contains of more invariant lingusitic information with respect to second PC, the variances of first PC members are lower than second PC. The average variances of perceptual space members in first PC, second PC and ADV are 0.0372, 0.1492, and 0.0176 respectively for model-I and 0.04883, 0.16508 and
0.0205 for model-II. From the above numerical comparisons, it is found that model-I is more consistent than model-II.
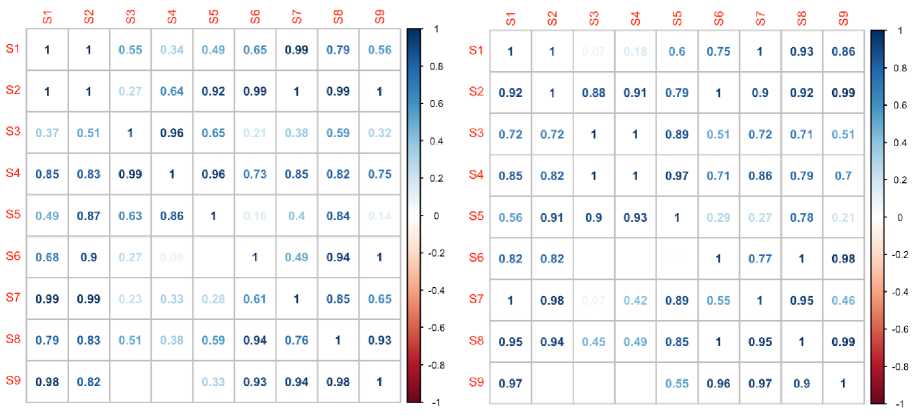
Correlation coefficients defined in (1), P are calculated and shown in Fig. 5 for both models. Among these coefficients, minimum and average values are 0.5800 and 0.8704 (without considering the diagonal elements) respectively for model-I; therefore, the average angular deviation is 29.07° (arccos(0. 8704) = 29.07°). For model-II, the minimum and average correlation coefficients are 0.6160 and 0.8317 respectively; hence, the average angular deviation is 33.72° which is higher than model-I. From the average angular deviations comparison, model-I has better representativity.
For model-I
For model-II
Fig.4. Contributions of ADVs for nine perceptual spaces.
Variance-covariance comparison scale, C and Mahalanobis distance based scale M of representativity are also evaluated using (3 and 4) and shown in Fig. 6 and Fig. 7. Here, C(i, j) indicates the linguistic information of first two PCs of perceptual space i shared by its counterparts in perceptual space j and this sharing is not commutative. Other scale, M(i, j) measures the closeness of linguistic information centroid of perceptual space i to j and similarly, the closeness scale is also non-commutative. For these reasons, representative scale C and M are not symmetric (i.e. M(i,j) ≠M(j,i) and C(i,j) ≠C(j,i) ) like first scale, P .
Heter, the minimum and average value of C are 0.330 and 0.7733 respectively for model-I and 0.400 and 0.8041 for model-II. Another scale, M have minimium and average values are 0.00 and 0.6570 respectively for model-I and 0.00 and 0.7049 for model-II. The scaled value of zero indicates that the distance between two centroids of perceptual spaces is greater than the critical distance defined in (6). The variations of speakers vocaltract size, shape and physical structure may be responsible for the large distance. Based on the scales C and M , model-II is superior than -I and the situation is opposite when the scale P is considered. Using these three representativity measuring scales, (P,C,M) the representativities are determined according to (7) and the values are 0.7618 and 0.7782 for model-I and -II respectively. So, model-I (V = F1,F2,F3,F4,F5) and -II (V =F0, F1, F2, F3, D(F1), D(F2)) have approximately same type of representativity.
Table 2. Variances of first PC, second PC and ADV members for both models.
|
Model-I |
Model-II |
||||||
|
Member |
Variance |
Member |
Variance |
||||
|
1st PC |
2nd PC |
ADV |
1st PC |
2nd PC |
AVD |
||
|
F1 |
0.0332 |
0.2452 |
0.0169 |
F0 |
0.0841 |
0.1763 |
0.0140 |
|
F2 |
0.0341 |
0.2567 |
0.0126 |
F1 |
0.0355 |
0.1828 |
0.0146 |
|
F3 |
0.0341 |
0.1231 |
0.0147 |
F2 |
0.0582 |
0.1772 |
0.0320 |
|
F4 |
0.0099 |
0.0263 |
0.0073 |
F3 |
0.0306 |
0.2162 |
0.0262 |
|
F5 |
0.0749 |
0.0945 |
0.0362 |
D(F1) |
0.0169 |
0.0243 |
0.0050 |
|
– |
– |
– |
– |
D(F2) |
0.0674 |
0.0674 |
0.0312 |
|
to |
to |
to |
to |
to |
to |
to |
to |
to |
to |
to |
to |
to |
to |
to |
to |
to |
||||||
|
S1 |
1 |
0.84 |
0.66 |
0.75 |
0.83 |
0.97 |
0.94 |
0.99 |
0.92 |
SI |
1 |
0.92 |
0.83 |
0.78 |
0.89 |
0.92 |
0.81 |
0.91 |
0.87 |
0.6 |
||
|
S2 |
0.84 |
1 |
0.95 |
0.95 |
0.94 |
0.86 |
0.95 |
0.77 |
0.9 |
■ 0.6 |
S2 |
0.92 |
1 |
0.87 |
0.83 |
0.9 |
0.84 |
0.65 |
0.73 |
0.63 |
||
|
S3 |
0.66 |
0.95 |
1 |
0.97 |
0.92 |
0.74 |
0.86 |
0.58 |
0.79 |
■ 0.4 |
S3 |
0.83 |
0.87 |
1 |
0.99 |
0.94 |
0.92 |
0.77 |
0.78 |
0.63 |
■ 0.4 |
|
|
S4 |
0.75 |
0.95 |
0.97 |
1 |
0.93 |
0.82 |
0.91 |
0.7 |
0.81 |
■ 0.2 |
S4 |
0.78 |
0.83 |
0.99 |
1 |
0.95 |
0.91 |
0.75 |
0.76 |
0.62 |
■ 0.2 |
|
|
S5 |
0.83 |
0.94 |
0.92 |
0.93 |
1 |
0.9 |
0.97 |
0.79 |
0.94 |
■ 0 |
S5 |
0.89 |
0.9 |
0.94 |
0.95 |
1 |
0.92 |
0.84 |
0.82 |
0.73 |
• 0 |
|
|
S6 |
0.97 |
0.86 |
0.74 |
0.82 |
0.9 |
1 |
0.97 |
0.97 |
0.93 |
■■0.2 |
S6 |
0.92 |
0.84 |
0.92 |
0.91 |
0.92 |
1 |
0.83 |
0.95 |
0.87 |
■ -0.2 |
|
|
57 |
0.94 |
0.95 |
0.86 |
0.91 |
0.97 |
0.97 |
1 |
0.91 |
0.96 |
■ -0.4 |
S7 |
0.81 |
0.65 |
0.77 |
0.75 |
0.84 |
0.83 |
1 |
0.87 |
0.8 |
• -0.4 |
|
|
S8 |
0.99 |
0.77 |
0.58 |
0.7 |
0.79 |
0.97 |
0.91 |
1 |
0.89 |
■ -0.6 |
88 |
0.91 |
0.73 |
0.78 |
0.76 |
0.82 |
0.95 |
0.87 |
1 |
0.92 |
• -0.6 |
|
|
■ -0.8 |
■ -0.8 |
|||||||||||||||||||||
|
59 |
0.92 |
0.9 |
0.79 |
0.81 |
0.94 |
0.93 |
0.96 |
0.89 |
1 |
S9 |
0.87 |
0.63 |
0.63 |
0.62 |
0.73 |
0.87 |
0.8 |
0.92 |
1 |
|||
|
For model-I |
For model-II |
|||||||||||||||||||||
|
Fig.5. Correlation coefficients of ADVs for |
nine |
perceptual spaces. |
||||||||||||||||||||
|
to |
и |
to |
to |
to |
||||||
|
S1 |
1 |
0.87 |
0.86 |
0.82 |
0.85 |
0.96 |
0.91 |
0.54 |
1 |
|
|
S2 |
0.67 |
1 |
0.99 |
1 |
0.57 |
0.79 |
0.56 |
0.96 |
0.73 |
, 0 6 |
|
S3 |
0.61 |
0.99 |
1 |
1 |
0.53 |
0.75 |
0.5 |
0.99 |
0.65 |
■ 0.4 |
|
S4 |
0.61 |
0.98 |
1 |
1 |
0.51 |
0.76 |
0.49 |
0.98 |
0.65 |
■ 0.2 |
|
S5 |
0.97 |
0.6 |
0.54 |
0.54 |
1 |
0.86 |
1 |
0.43 |
0.94 |
■ 0 |
|
56 |
0.95 |
0.97 |
0.95 |
0.92 |
0.73 |
1 |
0.78 |
0.67 |
0.94 |
■ -0.2 |
|
S7 |
0.93 |
0.63 |
0.6 |
0.59 |
1 |
0.83 |
1 |
0.93 |
■ -0.4 |
|
|
S8 |
0.54 |
0.78 |
0.79 |
0.83 |
0.33 |
0.66 |
0.38 |
1 |
0.52 |
■ -0.6 |
|
S9 |
0.95 |
0.95 |
0.96 |
0.98 |
0.75 |
0.99 |
0.81 |
0.69 |
1 |
|
to |
to |
to |
to |
to |
и |
||||||
|
S1 |
1 |
0.81 |
0.79 |
0.78 |
0.91 |
0.97 |
0.93 |
0.58 |
1 |
||
|
S2 |
0.7 |
1 |
0.99 |
1 |
0.56 |
0.78 |
0.52 |
0.98 |
0.72 |
, Q 6 |
|
|
S3 |
0.69 |
0.98 |
1 |
1 |
0.56 |
0.83 |
0.55 |
0.96 |
0.71 |
■ 0.4 |
|
|
S4 |
0.65 |
0.97 |
1 |
1 |
0.54 |
0.8 |
0.53 |
0.97 |
0.68 |
■ 0.2 |
|
|
S5 |
0.97 |
0.65 |
0.63 |
0.61 |
1 |
0.88 |
0.96 |
0.5 |
0.97 |
■ 0 |
|
|
S6 |
0.96 |
0.95 |
0.89 |
0.87 |
0.81 |
1 |
0.82 |
0.69 |
0.98 |
"0.2 |
|
|
S7 |
0.98 |
0.96 |
0.83 |
0.81 |
0.95 |
1 |
1 |
0.63 |
1 |
• -0.4 |
|
|
S8 |
0.55 |
0.82 |
0.89 |
0.91 |
0.4 |
0.68 |
0.44 |
1 |
0.59 |
■ -0.6 |
|
|
89 |
0.87 |
0.92 |
0.99 |
0.98 |
0.62 |
0.97 |
0.75 |
0.79 |
1 |
For model-I
For model-II
Fig.6. Variance-Covariance comparison based representativity for nine perceptual spaces.
-
VI. Conclusion
Representativity between two vowel perceptual spaces has been modeled using average directional vector, variance-covariance matrices and Mahalanobis distance mathematically. Using the proposed method, representativities have been evaluated numerically from the vowel perceptual spaces formed by two different ways: model-I is formed by only formant frequencies and model-II consists not only formant frequencies but also fundamental frequency and dispersion of formant frequencies. From these perceptual spaces, the average normalized first eigen-values of model-I and -II are 0.8058 and 0.7681 respectively and among the perceptual space members, F 2 and F 3 are dominating and their contributions are more significant. Beside these factors of perceptual spaces, the average correlation coefficient and
angular deviation of ADV are 0.8704 and 29.07 ° respectively for model-I and 0.8317 and 33.72 ° for model-II. Based on the ADV correlation, model-I is preferable than model-II. But, opposite results are found considering variance-covariance matrices and Mahalanobis distance. The average values of these two representativity measuring scales ( C , M ) for model-II are 0.8041 and 0.7049 and for model-I are 0.7733 and 0.6570. Using the geometric mean of these three scales ( P , C , M ) representativities for two models are calculated and the values are 0.7618 and 0.7782 for model-I and –II respectively. So, linguistic information representativities of both vowel perceptual models are approximately same.
For model-I
For model-II
Fig.7. Mahalanobis distance based representativity for nine perceptual spaces.
Список литературы Determination of representativity for Bangla vowel perceptual space
- S. E. G. Ohman, “Coarticulation in VCV utterances: spectrographic measurements,” Journal of Acoustical Society of America, vol. 39, no. 1, pp. 151-168, 1966.
- K. N. Stevens and A. S. House, “Perturbation of vowel Articulations by consonantal Context: An Acoustical Study,” Journal of Speech & Hearing Research, vol. 6, no. 2, pp. 111-128, 1963.
- M. Andermann, R. D. Patterson, C. Vogt, L. Winterstetter and A. Rupp, “Neuromagnetic correlates of voice pitch, vowel type, and speaker size in auditory cortex,” NeuroImage, vol. 158, pp.79-89, 2017.
- C. T. Engineer, K. C. Rahebi, E. P. Buell, M. K. Fink and M. P. Kilgard, “Speech training alters consonant and vowel responses in multiple auditory cortex fields,” Behavioural Brain Research, vol. 287, no.1, pp. 256-264, 2015.
- Saloni, R. K. Sharma, and A. K. Gupta, "Classification of High Blood Pressure Persons Vs Normal Blood Pressure Persons Using Voice Analysis", International Journal Image, Graphics and Signal Processing, vol.6, no.1, pp.47-52, 2014.
- G. Nijhawan, and M.K Soni, “A New Design Approach for Speaker Recognition Using MFCC and VAD,” International Journal Image, Graphics and Signal Processing, vol.5, no.9, pp.43-49, 2013.
- J. K. Bizley and Y. E. Cohen, “The what, where and how of auditory-object perception,” Nature Reviews Neuroscience, vol.14, no. 10, pp. 693-707, 2013.
- J. E. Peelle, J. Gross and M. H. Davis, “Phase-locked responses to speech in human auditory cortex are enhanced during comprehension,” Cerebral Cortex, vol. 23, no. 6, pp. 1378-1387, 2013.
- P. B. Schafer and D. Z. Jin, “Noise-Robust Speech Recognition Through Auditory Feature Detection and Spike Sequence Decoding,” Neural Computation, vol. 26, no.3, pp. 523-556, 2014.
- M. L. Jepsen, S. D. Ewert and T. Dau, “A computational model of human auditory signal processing and perception,” Journal of Acoustical Society of America, vol.124, no.1, pp.422-438, 2008
- K. M. Walker, J. K. Bizley, A. J. King and J. W. Schnupp, “Multiplexed and robust representations of sound features in auditory cortex,” Journal of Neuroscience, vol.31, no. 41, pp. 14565-14576, 2011.
- B. E. F. Lindblom and M. S. Kennedy, “On the role of formant transitions in vowel Recognition,” Journal of Acoustical Society of America, vol. 42, no. 4, pp.832-843, 1967.
- X. Wang and K. K. Paliwal, “Feature extraction and dimensionality reduction algorithms and their applications in vowel recognition,” Pattern Recognition, vol. 36, no. 10, pp. 2429-2439, 2003.
- S. Lopez, P. Riera, M. F. Assaneo, M. Eguia, M. Sigman and M. A. Trevisan, “Vocal caricatures reveal signatures of speaker identity,” Nature Scientific Reports 3, 3407,doi:10.1038/srep03407, 2013.
- R. Cotterell and J. Eisner, “Probabilistic Typology: Deep Generative Models of Vowel Inventories,” Proceedings of 55th Annual meeting of the association for computational linguistics, vol. 1, pp. 1182-1192, 2017.
- M. R. Molis, “Evaluating models of vowel perception,” Journal of Acoustical Society of America, vol.118, no.2, pp.1062-1071, 2005.
- L. Polka and O. S. Bohn, “Natural Referent Vowel (NRV) framework: An emerging view of early phonetic development,” Journal of Phonetics, vol. 39, no. 4, pp. 467-478, 2011.
- V. Hacquard , M. A. Walter and A. Marantz, “The effects of inventory on vowel perception in French and Spanish: An MEG study,” Brain and Language, vol. 100, no. 3, pp. 295-300, 2007.
- H. Matsumoto, S. Hiki, T. Sone and T. Nimura, “Multidimensional representation of personal quality of vowels and its acoustical correlates,” IEEE Transacrions on Audio and Electroacoustics, vol.AU-21, no.5, pp. 428-436, 1973.
- B. E. Walden, A. A. Montgomery, G. T. Gibeily, R. A. Prosek and D. M. Schwartz, “Correlates of psychological dimensions in talker similarity,” Journal of Speech and Hearing Research, vol.21, pp.265-275, 1978.
- J. Kreiman, B. R. Gerratt, K. Precoda and G. S. Berke, “Individual differences in voice quality perception,” Journal of Speech and Hearing Research, vol.35, pp.512-520, 1992.
- P. Divenyi, “Perception of complete and incomplete formant transitions in vowels,” Journal of Acoustical Society of America, vol.126, no.3, pp. 1427-1439, 2009.
- K. J. Reilly and K. E. Dougherty, “The role of vowel perceptual cues in compensatory responses to perturbations of speech auditory feedback,” Journal of Acoustical Society of America, vol.134, no. 2, pp.1314-1323, 2013.
- D. J. Rimbaud, D. L. Massart, C. A. Saby and C. Puel, “Determination of the representativity between two multidimensional data sets by a comparison of their structure,” Chemometrics and Intelligent Laboratory Systems, vol. 40, no. 2, pp.129-144, 1998.
- http://www.vistawide.com/languages/top_30_languages.htm
- P. Boersma and D. Weenink , Praat: doing phonetics by computer [Computer program]. Version 5.4.01, retrieved 9 November 2014 from http://www.praat.org/
- R Core Team, R: A language and environment for statistical computing, R Foundation for Statistical Computing, Vienna, Austria, 2013.( http://www.R-project.org/)
- O. Baumann and P. Belin, “Perceptual scaling of voice identity: common dimensions for different vowels and speakers,” Psychological Research, vol.74, no.1, pp.110-120, 2010.

