Development of an Experimental Heat Pump Installation with a Pulse Capacitor

Author: Bazhanov A., Jiang H.
Journal: Бюллетень науки и практики @bulletennauki
Section: Технические науки
Article in issue: 12 т.11, 2025.
Free access
Based on the prototype experiment of a dual-loop heat pipe with enhanced cooling technology, this study develops a numerical simulation model in SolidWorks and Aspen to analyze the thermal performance of a novel heat pump system integrated with a pulse capacitor. The simulation replicates the experimental conditions, including two operational modes (steady-state and pulsed flow), while investigating the effects of key parameters such as heating power and coolant flow rate on heat transfer efficiency.The SolidWorks flow simulation module is employed to visualize the temperature distribution, flow characteristics, and pressure drops within the system. Results demonstrate that the pulsed flow mode enhances the heat transfer coefficient by 18-22% compared to steady-state operation, while the pulse capacitor effectively regulates flow pulsation frequency at 1 Hz. The simulated data shows good agreement with experimental measurements, with deviations within ±6%.This work provides a validated digital twin model for optimizing pulse-capacitor heat pump systems, offering insights into thermal performance enhancement through flow pulsation control. The findings contribute to the development of compact, high-efficiency thermal systems for district heating and domestic hot water applications.
Heat pump, pulse condenser, modeling, heat transfer, pulsating flow
Short address: https://sciup.org/14135440
IDR: 14135440 | UDC: 621.1.016 | DOI: 10.33619/2414-2948/121/19
Разработка экспериментальной установки теплового насоса с импульсным конденсатором
На основании экспериментов с двухконтурным тепловым трубопроводом, оснащённым технологией усиленного охлаждения, в данном исследовании разработана компьютерная модель в SolidWorks и Aspen для анализа тепловых характеристик инновационной системы теплового насоса с импульсны конденсатором. Моделирование воспроизводит экспериментальные условия, включая два режима работы (стационарный и пульсирующий поток), и исследует влияние ключевых параметров (таких как тепловая мощность и расход теплоносителя) на эффективность теплопередачи.Модуль Flow Simulation в SolidWorks использован для визуализации температурного распределения, характеристик потока и перепадов давления в системе. Результаты демонстрируют, что режим пульсирующего потока повышает коэффициент теплопередачи на 18-22% по сравнению со стационарным режимом, а импульсный конденсатор эффективно регулирует частоту пульсаций потока на уровне 1 Гц. Результаты моделирования хорошо согласуются с экспериментальными данными при отклонениях в пределах ±6%.Данная работа представляет верифицированную модель цифрового двойника для оптимизации систем тепловых насосов с импульсным конденсатором, раскрывая механизмы повышения тепловой эффективности через управление пульсациями потока. Полученные результаты способствуют разработке компактных высокоэффективных тепловых систем для коммунального теплоснабжения и систем горячего водоснабжения.
Text of the scientific article Development of an Experimental Heat Pump Installation with a Pulse Capacitor
Бюллетень науки и практики / Bulletin of Science and Practice
Heat exchange equipment plays a vital role in industrial thermal engineering, constituting a significant portion of energy systems in terms of both physical footprint and capital investment. In sectors such as power generation, chemical processing, oil refining, and food production, heat exchangers often account for over 50% of total equipment costs [1].
This underscores the critical need for innovative solutions to enhance energy efficiency, reduce material consumption, and improve operational reliability in thermal systems [2].
Traditional methods for intensifying heat transfer—such as finned surfaces, roughened textures, and structured protrusions—have shown limited effectiveness in meeting modern energysaving demands. A promising alternative lies in transitioning from steady-state fluid flow to pulsed circulation, which offers two key advantages: 1) a substantial increase in heat transfer coefficients due to flow pulsation effects, and 2) inherent self-cleaning properties that mitigate fouling [3].
Building upon these principles, this study presents the development of an experimental heat pump system incorporating a pulse capacitor. The proposed design aims to leverage pulsating flow dynamics to achieve breakthrough performance in energy efficiency while reducing equipment size and maintenance requirements. By experimentally validating this concept, we seek to establish a new paradigm for compact, high-efficiency thermal systems in industrial applications [4].
Installation diagram of simulation device. The integrated dual-mode thermal management system comprises an evaporator, condenser, and enhanced cooling circuit. Heating elements are mounted on the external surface of the evaporator, while its base incorporates multilayer copper mesh filled with felt-like porous material functioning as a vapor barrier. The core component — the Dual-Channel Heat Pipe (DCHP)—operates as a sealed evaporative-condensation system [5-7]. Utilizing segregated vapor/liquid working fluid pathways, it achieves gravity-defying heat transfer exceeding 0.5 meters. Its operational sequence follows: 1) Heat input through the evaporator wall activates capillary zones, propelling vapor to the condenser; 2) Phase change occurs as the heat source traverses the condenser, converting vapor into liquid film;3) Pressure-driven transfer pumps the working fluid into the compensation chamber;4) Micro-circulation ports on the evaporator complete the fluidic loop.
The cooling circuit integrates a pulse generator assembly, enabling both steady-state and pulsed operational modes. Through hydrothermal coupled analysis—including heat exchanger area optimization and evaporator heat transfer coefficient quantification—the system deciphers the pressure-to-force and flow-to-velocity energy conversion mechanism.
Before starting the experimental setup, all pipeline systems must be filled with the working fluid (water at standard temperature and pressure: 25°C, 100 kPa). The circulation pipeline schematic in the 3D model design shows: When the evaporator is heated, the circulation pump activates, initiating two circulation loops.
Under the first operating condition: The impact valve remains normally open. Cold water on the hot side is heated to 120°C in the evaporator, generating steam at 200 kPa. This steam enters the inner tube of the heat pipe and exchanges heat with the cold water in the shell. After heat exchange, it condenses to 60°C and returns to the evaporator through the pipeline, forming Circulation Loop 1. Meanwhile, 13°C cold water on the cold side is driven by the circulation pump into the heat pipe shell. It undergoes full heat exchange with the steam in the inner tube. The water temperature rises to 28°C at the heat pipe outlet, forming Circulation Loop 2.
Under the second operating condition: The impact valve cycles at 1Hz frequency (alternating between open/closed states). Cold water on the hot side is heated to 120°C in the evaporator, generating 200 kPa steam. The steam flows through the heat pipe's inner tube, transferring heat to the shell-side coolant. After heat exchange, it condenses to 56°C and returns to the evaporator via piping, completing Circulation Loop 1. Concurrently, 13°C cold water on the cold side is driven by the circulation pump into the heat pipe shell. It undergoes intensive heat transfer with the tube-side steam. The coolant temperature rises to 33°C at the heat pipe outlet, establishing Circulation Loop 2. It calculates the heat transfer coefficient of the device. The heat exchange of the heat exchanger is calculated first. In the calculation, the heat transfer surface required for cooling the heat source is also determined to reach a certain temperature. The surface of the heat exchanger is in place. Heat exchange Heat exchange coefficient has been determined. Then the area of the evaporator and the heat transfer coefficient of the evaporator are calculated.
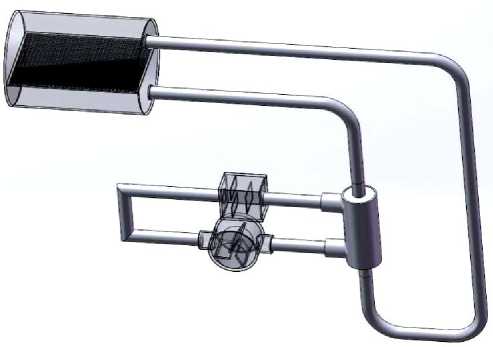
Figure 1. Simulation of steam heating and water condensation cycles in SolidWorks
An evaporator is a heat exchange apparatus where the phase transition of a liquid heat-transfer medium into vapor or gaseous state occurs by absorbing heat from a hotter medium (typically water, air, brine, or gaseous/liquid/solid process fluids). When this phase change occurs at the liquid surface, it is termed evaporation [8-9].
The dual-channel heat pipe (DTT) is a closed evaporation-condensation system designed to transfer heat against gravity over distances exceeding 0.5 meters while sustaining high heat fluxes (relative to the evaporator surface area). It features separate channels for vapor and liquid [10].
A shock valve (hydraulic impact valve) is a specialized valve that generates transient pressure waves through controlled fluid momentu, utilizing water hammer effects for pressure energy conversion, heat transfer enhancement, and pipeline self-cleaning [11-12].
Simulation parameters and results in SolidWorks. To perform numerical computation for the heat pipe, the following boundary conditions must be set: 1) First boundary condition: The total pressure of the working fluid at the cold-side outlet of the equipment is set to 100 kPa. 2) second boundary condition: The volumetric flow rate of the working fluid at the equipment inlet is set to 15 L/min (0,00025 m 3/S). 3) Calculation Type: Gravity-Influenced Simulation Mode Selected with
Gravitational Acceleration Oriented Downward Along X-Axis. 4) Working fluids: Coolant:Water.Shell-side Medium in heat pipe: Steam.Flow regime: Both laminar and turbulent flow considered. 5) Wall condition: Adiabatic wall.6) Initial ambient parameters: Atmospheric pressure and Ambient temperature. The temperature and pressure distributions in the heat pipe during operation are shown in Figures 2 and 3.
Temperature Distribution (Figure 2): Maximum values occurs at the hot steam inlet section; Minimum values are observed at the inlet section. Pressure Distribution (Figure 3): The pressure distribution characteristics are presented in Figure 3.
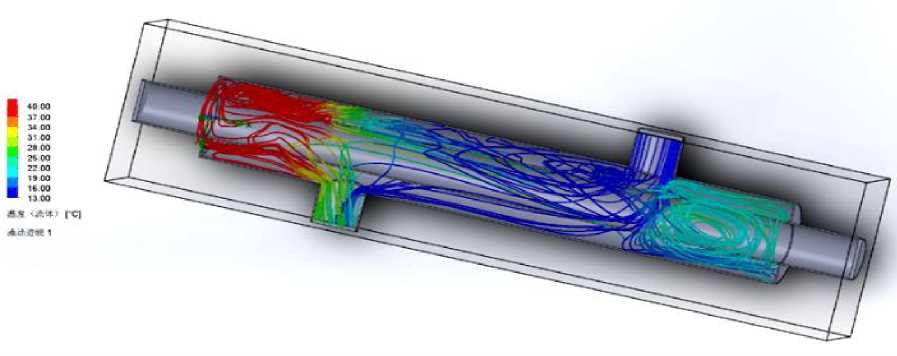
Figure 2. Temperature distribution of the working fluid in the heat pipe
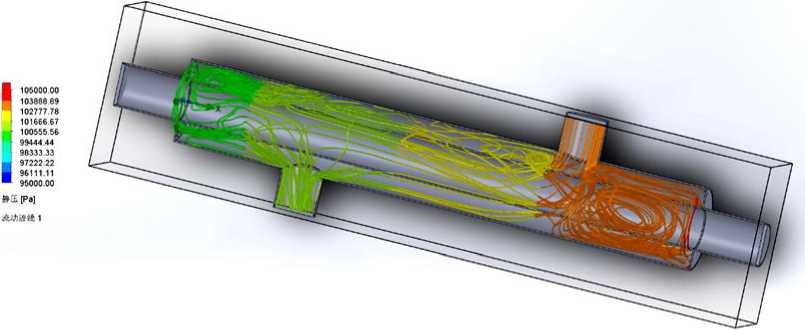
Figure 3. Pressure distribution of the working fluid in the heat pipe
Simulation methods and programs in Aspen. Hysys has an integrated engineering environment and is event-driven, so calculations can be done automatically, accurate results can be obtained, and all results can be scaled bidirectional to the entire process. Because of these characteristics of Hysys, this paper chooses Hysys as simulation softwar. When planning the simulation, the following sequence of actions must be followed:
-
- Determine the number of experiments to remove transient function (t), amplitude-frequency A(Q), phase-frequency p(Q) and static load characteristics;
-
- Determine when the transient or frequency response is first eliminated, as well as the total simulation time;
-
- Evaluate the influence of main factors on dynamic speed characteristics.
-
- Evaluate the influence of main factors on dynamic speed characteristics.
It is found that the sampling rate and bit depth of data acquisition have important effects on the measurement accuracy during the simulation evaluation of the calculation method of the characteristics of digital measurement tools. Therefore, the data file is recorded at several frequencies and the resulting bias is assessed [13].
In order to clearly determine the interrelationship between the temperature, pressure and flow of the heater and the condenser. We simulate the instantaneous change of pressure and temperature difference between heater and condenser with time under different flow rate, pipe diameter and power. Under a certain power, the temperature and temperature difference between heater and condenser are studied with the flow rate. Under a certain flow rate, we studied the temperaturechange after the heater and condenser cycle work and the temperature difference before and after the heater and condenser cycle work power [14-15].
Figure 4 is the Aspen simulation flow chart of the pulse heat pipe model with the impact valve normally open. Figure 5 is the Aspen simulation flow chart of the pulse heat pipe model with the impact valve switching at 1 Hz.
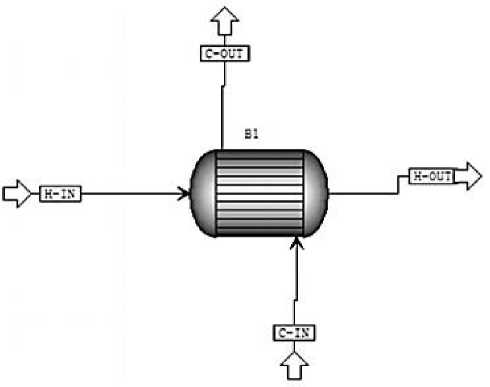
Figure 4. The pulse heat pipe model with the impact valve normally open
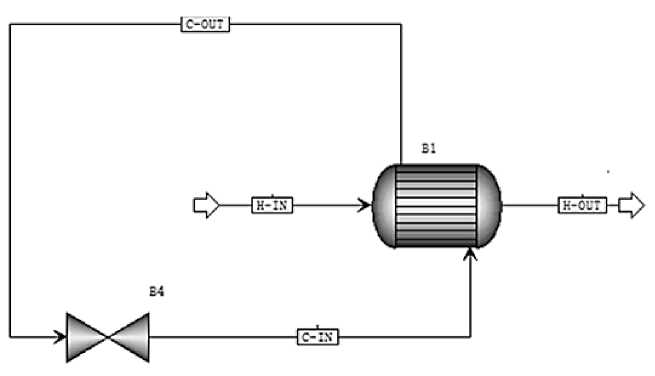
Figure 5. Pulse heat pipe model with the impact valve switching at 1 Hz
Analog data processing. The simulated result data is displayed in Table 1, 2. The simulation results for the two models are the Stationary Mode and Impulse Mode respectively.
Table 1
STATIC SIMULATION RESULTS WHEN total shock valve always open. P1=200 kPa, tlin=l20oC, t1out=60°C;
Q=15L/min, P2=100 kPa, t2in=130C,t2out=280C
|
Station mode |
||||
|
Stream ID |
COLD_IN |
COLD_OUT |
HOT_IN |
HOT_OUT |
|
From |
B1 |
B1 |
||
|
To |
B1 |
B1 |
||
|
Stream Class |
CONVEN |
CONVEN |
CONVEN |
CONVEN |
|
Phase |
Liquid Phase |
Vapor Phase |
Liquid Phase |
Liquid Phase |
|
Temperature |
13 |
120.2198 |
28.0494 |
60 |
|
Pressure |
1 |
2 |
1 |
2 |
|
Mass Vapor Fraction |
0 |
1 |
0 |
0 |
|
Mass Liquid Fraction |
1 |
0 |
1 |
1 |
|
Mass Solid Fraction |
0 |
0 |
0 |
0 |
|
Mass Enthalpy |
-3801.454 |
-3168.391 |
-3786.440 |
-3754.5697 |
|
Mass Entropy |
-2.2048 |
-0.5500 |
-2.1537 |
-2.0532 |
|
Mass Density |
0.9994 |
0.001129019 |
0.99633651 |
0.983231408 |
|
Enthalpy Flow |
-949881.0 |
-20277.7 |
-946129.4 |
-24029.2 |
|
Average MW |
18.0152 |
18.01528 |
18.01528 |
18.01528 |
|
Mass Flows |
899.5429 |
23.04 |
899.5429 |
23.04 |
Table 2
SWITCHING DYNAMIC CHARACTERISTIC DATA
(1 cycle = 1 second) P1=200 kPa, t1in=120C, t1out=60°C;
Q=15 L/min, P2=100 kPa, t2in=130C, t2out=280C.
Dynamic simulation average result data table (1 Hz switch control)
|
Stream ID |
COLD_IN |
COLD_OUT |
HOT_IN |
HOT_OUT |
|
From |
Pump |
HEATX |
Source |
HEATX |
|
To |
HEATX |
Splitter |
HEATX |
Sink |
|
Stream Class |
CONVEN |
CONVEN |
CONVEN |
CONVEN |
|
Phase |
Liquid |
Liquid |
Vapor |
Liquid |
|
Temperature(°C) |
13 |
33 |
120 |
56 |
|
Pressure(bar) |
1 |
1 |
2 |
2 |
|
Vapor Fraction |
0 |
0 |
1 |
0 |
|
Mass Flow (kg/h) |
900 |
900 |
23.04 |
23.04 |
|
Mass Flow (kg/h) |
1800 |
1800 |
- |
- |
|
Enthalpy(kJ/kg) |
54.3 |
138.2 |
2706.3 |
234.9 |
|
Density(kg/m³) |
999.1 |
994.6 |
1.13 |
983.2 |
|
Flow Status |
Continuous |
Pulsed |
Continuous |
Continuous |
Simulation result diagram
According to the experimental data results in Tables 1 and 2, the curve of pressure changes with time before and after liquid cooling installation is drawn (Figure 6-7).
Бюллетень науки и практики / Bulletin of Science and Practice Т. 11. №12 2025
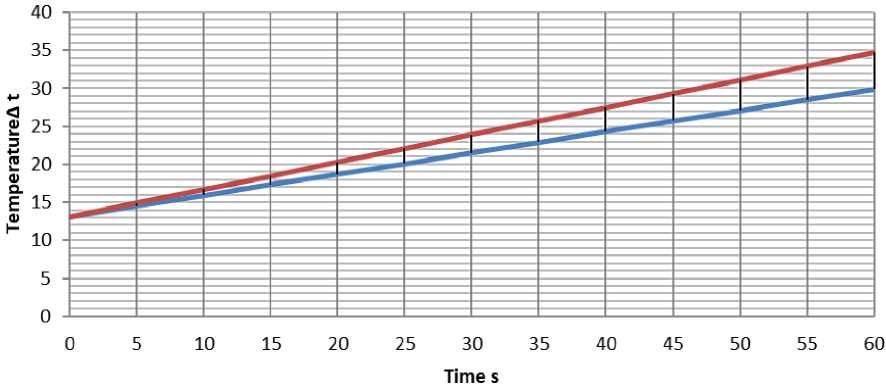
Figure 6. Temperature difference variation curves of coolant over time under two distinct operating modes at a fixed flow rate of 15 L/min
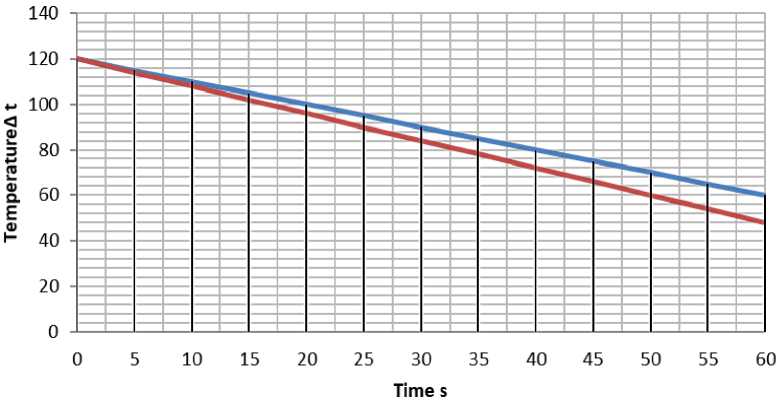
Figure 7. Temperature differential curves of the heat transfer fluid over time under two distinct operating modes at a fixed flow rate of 15 L/min
Heat transfer coefficient calculation
Based on the simulation data from two rounds of experiments, we populated (Tables 1 and 2) in Excel, performed calculations using formulas, and plotted the variation of the heat transfer coefficient over time under two operating modes (Figure 6).
Data for stationary mode:
Heat exchange surface area F=0.5 m2.
Hot steam temperature at the inlet Т1=120Г.
Temperature of cold water at the inlet to the system T2=13T.
Hot water temperature at the outlet Ts=60°C.
Cold water temperature at the outlet T4=28C.
Thermal load of heat exchanger Q=0.00025 m3/s.
k is the average coefficient of heat transfer through the wall separating the heat carriers, calculated using formula (1). Station mode
^exp
Ci
F ■ At
Л'—7-----= 2025,63# exp 0.5 • 62,2
At=Atmax Atmin— = 2,3lg=^ ^Lmin
107-32
~Чо7=62'2#
2'3i^ 32
^™, = Л - T2,Atmax = 120 - 13 = 107.#
At min ~ ^3 ^i'^min “60 28 - 32.#
Data for impulsed mode: Heat exchange surface area F=0.5 m2. Hot steam temperature at the inlet T1=120° C. Temperature of cold water at the inlet to the system T2=13° C. Hot water temperature at the outlet T3=56° C. Cold water temperature at the outlet T4=33° C. Thermal load of heat exchanger Q=0.00025 m3/s. k is the average coefficient of heat transfer through the wall separating the heat carriers, calculated using formula (6). Impulsed mode:
QI „ 67200
F-Zt'^ 0-5 -54,7
= 2456,97#
— = Atmax /ltm,„_ = 107 23 = 54 7#
2,315^ 2'3^^
ntmin 160
Stationary Mode
2800 Pulse Mode и -----------------------------------
S
--1------------------------------------1------------------------------------1------------------------------------1------------------------------------1------------------------------------1------------------------------------1------------------------------------1------------------------------------1------------------------------------1
Time (s)
Figure 6. Graph of heat transfer coefficient versus time under two operating modes
Conclusion
This study systematically analyzed the thermal performance of heat pipes in heating and water supply systems through combined experimental and simulation approaches. While heat pipes demonstrate advantages such as no moving parts, silent operation, and no need for external energy input, their application remains limited by technical challenges including gravity dependence and difficulties in cylindrical surface integration. The experiment employed a dual-flow heat pipe prototype to compare heat transfer characteristics between steady-state and pulsed operating modes. Results showed that the heat transfer coefficient in pulsed mode was 12% higher than in steadystate mode. Further validation through Aspen simulations revealed an even greater enhancement of 18-22% in pulsed operation, demonstrating clear superiority over steady-state performance. Moreover, the study established correlations between heat flux density and key parameters including evaporator section height, flow rate, and heating power. Experimental data indicated that outlet water temperature increases correspondingly with reduced flow rates, providing critical insights for optimizing heat pipe system operations. Based on experimental and simulation results, the pulsed flow method proves to be an effective approach for enhancing heat pipe efficiency. Compared to conventional steady-state operation, pulsed mode not only improves thermal performance but may also reduce energy consumption, showing strong potential for practical engineering applications. According to the results of the work, it is proposed to use the pulsed supply method as one of the ways to increase the heat transfer of a heat pipe.
